
February 10, 2025
Australian manganese explorer and developer, Black Canyon Limited (Black Canyon or the Company) (ASX: BCA) is pleased to announce the results from benchtop scale beneficiation testwork completed on composite reverse circulation (RC) drill chip samples from the W2 prospect at the Wandanya Project1. The testwork demonstrates substantial uplifts from composite feed grades of 21.2% Mn and 41.5% Mn to concentrate grades well above the premium 44% Mn oxide benchmark grade for both the moderate and higher-grade feed samples. The laboratory testwork used HLS techniques as a proxy for widely used, industry based dense media separation (DMS).
- Positive results received from initial beneficiation (Heavy Liquid Separation - HLS) provide confidence that a high-grade manganese oxide concentrate can be readily produced from Wandanya using a simple density-based technique.
- Significant manganese upgrades, on average, well above the premium 44% Mn oxide benchmark achieved:
- WD01MG composite upgraded from a raw feed grade of 21.2% Mn to grades between 44% to 4G% Mn (depending on HLS applied SG and size fraction)
- WD02HG composite upgraded from a raw feed grade of 41.5% Mn to grades between 51% to 53% Mn (depending on HLS applied SG and size fraction)
- Overall concentrate grades range between 50% and 48% Mn achieved with 68% to 76% recoveries respectively when combining the moderate and higher-grade composites results.
- Low deleterious elements such as iron, aluminium and phosphorus from the head grade feedstock and upgraded concentrate element analysis results.
- The Wandanya discovery represents a new exploration model on the eastern margin of the Oakover Basin comprising hydrothermal, stratabound manganese and iron. The Company has only drill tested 240m of the 3km W2 target strike and is looking forward to further drilling these high-grade manganese and iron outcrops2C3.
The initial sighter level metallurgical tests provide a positive insight to the beneficiation characteristics of the manganese mineralisation discovered at Wandanya using feed grades similar to those at Woodie Woodie that routinely use DMS as part of its ore processing circuit.
Black Canyon’s Managing Director Brendan Cummins said:
“Completing this early stage metallurgical testwork and generating a high grade, low impurity concentrate, in excess of the premium 44% Mn oxide benchmark, has been a great achievement and start to 2025. The style of high-grade hydrothermal manganese mineralisation we have discovered at Wandanya lends itself to the application of density-based beneficiation techniques with manganese minerals being denser than the less dense dolomite host rocks. The testwork confirmed our expectation that the mineralisation would beneficiate in a similar manner to the hydrothermal ores processed at Woodie Woodie and demonstrates the potential to produce a high quality manganese concentrate for the silico and ferro alloying industry and as feedstock for high purity manganese sulphate (HPMSM).”
“We continue to learn more about the W2 manganese prospect with these additional layers of analysis and we are quickly building a greater understanding of the prospect’s potential. My main conclusion to date has been the simplicity of the geology, with shallow high-grade mineralisation and now we have demonstrated how readily the manganese can be upgraded using a simple and established density-based process. Our immediate focus is to complete a Heritage Survey and then further drilling down dip and along strike so we can understand the full scale and significance of the discovery.”
“We have only drill tested 240m of strike or less than 10% of the 3km long manganese target based on mapping and rock chip sampling2. This is why we are very keen, following the west season, to get the rig back to site as soon as possible and test not only the manganese targets but also the recently announced high-grade iron mineralisation we have mapped over 2km adjacent to the manganse3.”
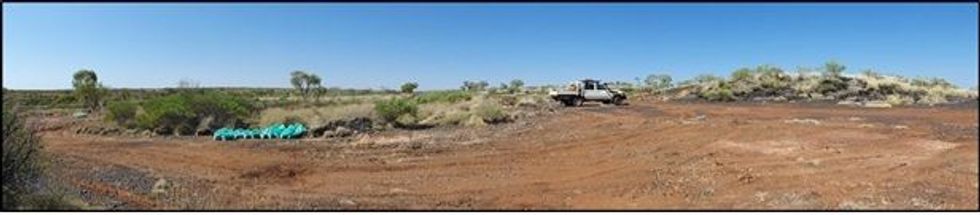
Figure 1. W2 Prospect, RC drill bags from WDRC031 in the foreground
W2 Prospect, Wandanya (BCA 100%)
Heavy Liquid Separation Testwork
Testwork samples were selected from about 110kg of RC drill chip samples collected from the W2 drilling program completed in September 20241. Whilst diamond core would be preferable to RC drill chips, for this early-stage sighter level beneficiation testwork, the processing of RC chips does provide initial concentrate grade and recovery data that can be applied to more detailed diamond core based testwork when available.
To facilitate representative examples of mineralisation, the drill chip samples were collected from six holes, with two holes each from a northern, central and southern drill line along 240m of drilled strike. A moderate and high composite grade of 20% Mn and 40% Mn was targeted based on the average intersection around 30% Mn with reasonably distinct moderate grades in an upper zone and higher grades closer to the footwall. The mineralised intervals were all intersected from less than 10m depth. All the samples were crushed to -10mm and then combined as required to produce a moderate (WD01MG) and higher (WD02HG) grade composite.
Click here for the full ASX Release
This article includes content from Black Canyon, licensed for the purpose of publishing on Investing News Australia. This article does not constitute financial product advice. It is your responsibility to perform proper due diligence before acting upon any information provided here. Please refer to our full disclaimer here.
The Conversation (0)
14 April
Munda Gold Mine Starter Pit Underway
Auric Mining Limited (ASX: AWJ) (Auric or the Company) advises it has begun mobilising plant and equipment including a dry hire fleet to the Munda Gold Mine site, 5km from Widgiemooltha, Western Australia. Site preparation is underway for the imminent mining of a Starter Pit.
Highlights
- Munda Mining Proposal and Mine Closure Plan approved.
- Starter Pit site preparation commenced.
- Munda will be mined by Auric, in its own right, with Auric employees.
- Grade control drilling on a 5m x 5m pattern completed.
- Contracts executed for mining fleet hire, drill and blast and key suppliers.
- Mine camp for 12 people established near Munda.
Management Comment
Managing Director, Mark English, said: “This is a milestone moment for Auric. Our whole team is full of optimism and excited to commence the Munda Gold Mine Starter Pit.
“Munda is our major asset; containing a sizeable gold resource. We will start out conservatively with a target to mine 125,000 tonnes of ore, producing around 6,100 ounces of gold at a projected AISC of A$2,635 per ounce.
“We are right on schedule and have mobilised all the necessary machinery and infrastructure. Earth works have commenced, we will begin mining in a few days.
“The Starter Pit will take us approximately six months to complete.
“The project is another significant step, both in our ambition to become a substantial gold producer in the district, and to develop Munda to its full potential.” said Mr English.
Photo 1: MHM Contracting 40-tonne Moxy dump trucks on site at Munda Gold Mine.
The Munda Starter Pit Mining Proposal and Mine Closure Plan have been approved by the WA Government’s Department of Energy, Mines, Industry Regulation and Safety (DEMIRS).
Survey mark-out of the pit crest, haul road, waste dump, ROM pads and site office has been completed.
Auric has executed a contract to dry hire the mining fleet from MHM Contracting Pty Ltd. The fleet will be operated by Auric employees.
A grade control program over the Starter Pit extents for those holes accessible from surface on a 5m x 5m pattern has also been completed. A total of 428 holes for 14,670m were drilled by Kalgoorlie-based Total Drilling Services. Results have been received allowing the mine geologists to define near surface ore blocks in advance of mining. Further grade control drilling on a 5m x 5m pattern will be undertaken as mining exposes new benches.
The Company will commence mining the Starter Pit this week, where it is estimated 125,000 tonnes of ore will be extracted at an estimated grade of 1.8g/t Au at an AISC of A$2,635 per ounce (Tables 2 and 3). The Starter Pit will take approximately six months to complete.
Click here for the full ASX Release
This article includes content from Auric Mining, licensed for the purpose of publishing on Investing News Australia. This article does not constitute financial product advice. It is your responsibility to perform proper due diligence before acting upon any information provided here. Please refer to our full disclaimer here.
Keep reading...Show less
11 April
Trade War Redux: US and China Dig In as Tariff Tensions Spiral to New Heights
In a rapidly escalating economic conflict that now threatens to fracture global trade, the US and China are locking horns once again in a full-blown, protracted tariff war.
On Wednesday (April 9), US President Donald Trump announced sweeping new tariffs targeting Chinese goods, raising levies to a staggering 125 percent. Hours later, Beijing responded in kind, unveiling retaliatory tariffs of 84 percent on all American imports, as well as tightening restrictions on US companies operating in China.
The Asian country doubled down on Thursday (April 10), hiking tariffs to 125 percent.
Wednesday's action from the US came as the Trump provided a 90 day pause on reciprocal tariffs for countries that had refrained from retaliating to its targeted tariffs last week. China was excluded from the reprieve because it did retaliate.
“I did a 90-day pause for the people that didn’t retaliate, because I told them, 'If you retaliate, we’re going to double it,'” Trump told reporters on Wednesday, asserting that China has failed to approach negotiations in good faith.
“China wants to make a deal, they just don’t know how quite to go about it. They’re proud people. President Xi (Jinping) is a proud man. I know him very well. They don’t know quite how to go about it but they’ll figure it out,” he added.
But in Beijing, the narrative is starkly different. Chinese leader Xi has refused to yield to what the Chinese government calls America’s “unilateral bullying,” instead rallying domestic support through a campaign of economic nationalism.
China’s State Council Tariff Commission has sharply rebuked the US, stating that the American escalation severely infringes upon China’s legitimate rights and interests and seriously damages the global trading system.
It has added six US firms to its "unreliable entity list," barred 12 American companies from receiving dual-use technology with military and civilian applications, and filed a formal complaint with the World Trade Organization (WTO).
“The Chinese government have been preparing for this day for six years — they knew this was a possibility,” CNN quotes Victor Shih, director of the 21st Century China Center at the University of California, San Diego, as saying.
The spiraling tariffs are already having tangible effects. Shipping and logistics costs have surged, global stock markets have dipped sharply and economists are warning of looming inflation as supply chains face disruption.
According to JPMorgan (NYSE:JPM), American consumers may face the equivalent of a US$660 billion tax burden — the highest tax hike in recent decades — before supply chains adapt.
The latest tit-for-tat measures also come at a time of economic vulnerability for both countries. China is attempting to stabilize its economy after a severe downturn in real estate and local government debt.
The US, meanwhile, is grappling with volatile debt markets and rising consumer prices. Just this week, US Treasury yields spiked to 4.5 percent, their highest level since early 2023, prompting a brief but dramatic selloff in global equities.
Markets rebounded slightly after Trump announced the tariff pause for non-retaliating countries, with the S&P 500 (INDEXSP:.INX) closing up 9.5 percent and the Dow Jones Industrial Average (INDEXDJX:.DJI) surging nearly 8 percent.
Still, uncertainty remains around the world as Trump's 90 day reprieve begins.
Europe, which had also faced stiff levies on steel and aluminum, announced its own retaliatory measures on Wednesday.
While it was later included in Trump’s pause list due to the delay in its response, the European Commission made clear that its tariffs “can be suspended at any time, should the US agree to a fair and balanced negotiated outcome.”
How did we get here? A timeline of the trade war escalation
What began with campaign promises to revamp America’s trade relationships rapidly evolved into a tit-for-tat trade war with key US allies and competitors alike. Here's a look at what happened.
- January 20 to 26: Trump’s second presidential term begins with a bold promise to impose tariffs and establish a new “External Revenue Service.” Within days, he threatens 25 percent tariffs on Canadian, Mexican and Colombian imports — punitive measures tied to immigration and border disputes. Colombia briefly retaliates before ultimately backing down.
- February 1 to 4: A key turning point arrives as Trump signs an executive order imposing a 10 percent tariff on all Chinese imports and a 25 percent tariff on Canadian and Mexican goods. China immediately retaliates, while Trump agrees to a temporary 30 day reprieve for Mexico and Canada, citing ongoing negotiations on security and drugs.
- February 10 to 13: The US broadens its tariff scope. Steel and aluminum duties are increased, and Trump unveils a “reciprocal tariff” policy, signaling that countries with higher import taxes on American goods will face equivalent treatment.
- February 25 to March 1: Trump continues the escalation, ordering probes into tariffs on critical materials like copper and lumber under national security justifications.
- March 4 to 6: Tariffs on Mexico and Canada officially go into effect, but carveouts are granted for US automakers. Canada imposes over US$100 billion in retaliatory duties, and China moves to tax key US agricultural exports. Mexico hints at retaliation, but pauses escalation as diplomacy resumes. Trump softens his stance temporarily, postponing additional tariffs.
- March 10 to 13: China’s 15 percent agricultural tariffs take effect. Trump presses forward with new steel and aluminum taxes, prompting retaliation from the EU, Canada and China. Tensions with Europe flare as Trump threatens a 200 percent tariff on European wine and spirits.
- March 24 to 26: Trump targets Venezuela-linked imports and imposes a sweeping 25 percent tariff on foreign autos. The EU, China and Canada respond with a series of planned tariffs of their own.
- April 2 to 5: Trump makes his most dramatic move yet — a “reciprocal” tariff regime applying a baseline 10 percent tax on all global imports, with higher rates on countries running trade surpluses with the US, including China, the EU, Japan and South Korea. On April 5, the 10 percent tariff takes effect.
- April 9 to 10: Hours after the higher reciprocal tariffs are triggered, the Trump administration announces a 90 day suspension for most of them — except for China. Trump ratchets China’s tariff burden up to 125 percent (or 145 percent with fentanyl-linked levies). China retaliates with an 84 percent tariff on US goods. Canada and the EU follow suit with their own targeted tariffs, though the EU pauses immediate retaliation, signaling openness to negotiation.
Bracing for impact
Despite the mutual saber-rattling, both the US and China have left the door open to dialogue — albeit on vastly different terms. China’s Foreign Ministry urged the US to demonstrate “an attitude of equality, respect, and mutual benefit.” US Treasury Secretary Scott Bessent struck a defiant tone, dismissing China's retaliatory measures as ineffective.
“They have the most imbalanced economy in the history of the modern world,” he told Fox Business. “They’re the surplus country. Their exports to the US are five times our exports to China. So, they can raise their tariffs. But so what?”
Yet economists and international trade experts warn the stakes are high — not just for the two economic giants, but for the world. According to WTO forecasts, the fallout could slash global trade volumes by hundreds of billions of dollars.
“Our assessments, informed by the latest developments, highlight the substantial risks associated with further escalation,” said WTO Director-General Ngozi Okonjo-Iweala in an April 9 statement.
Don't forget to follow us @INN_Resource for real-time news updates!
Securities Disclosure: I, Giann Liguid, hold no direct investment interest in any company mentioned in this article.
Keep reading...Show less
11 April
CNN Fear and Greed Index Plunges to Lowest in Five Years — What it Means for Global Markets
Investor anxiety is reaching new heights. CNN’s Fear and Greed Index plunged to just three on April 8, marking its lowest level since March 2020, when COVID-19 lockdowns sent shockwaves through financial markets.
The index has since made a modest improvement and is sitting at eight.
These levels reflect sentiment not seen in over five years. Historically, fear of this magnitude correlates with significant market selloffs. For instance, in 2020, the index remained in single-digit territory from March 5 to 23 — a period when the S&P 500 (INDEXSP:.INX) lost more than 30 percent of its value during the early stages of COVID-19.
Economists and traders alike warn that fluctuations in this range can be short-lived, but tend to bring extreme volatility, often resulting in steep market declines. Although the first signs of recovery usually emerge once the Fear and Greed Index climbs above 10, a more reliable signal is a return above 25, which tends to precede sustainable rallies.
US President Donald Trump's tariffs are behind the latest nosedive. Although a 90 day reprieve has been announced for most countries, uncertainty about the future remains. In addition, tensions between China and the US are heating up — US tariffs on China have ballooned to 145 percent, and China has raised its tariffs on US goods to 84 percent.
The immediate market reaction was negative. US stock markets experienced a sharp decline, and although there's been some recovery, investors are increasingly concerned about the potential for these trade disputes to escalate into a global recession, contributing to the heightened levels of market fear reflected in the index.
While market sentiment indicators like the Fear and Greed Index don’t dictate future price movements, they do provide insight into the emotional state of the market — often a contrarian signal for savvy investors. When fear reaches extreme levels, it has historically marked moments of potential opportunity or further market turbulence.
So what does this latest drop in the Fear and Greed Index really mean? This article explores the significance of the CNN Fear and Greed Index, its historical context and what investors should watch for next.
What is CNN's Fear and Greed Index?
CNN’s Fear and Greed Index is a tool designed to measure the prevailing emotions influencing the stock market by weighing seven key indicators. The Fear and Greed Index operates on a scale of zero to 100, with a score under 45 indicating fear, a score of 55 and above signifying greed and one in between marked as neutral.
Scores of under 25 and above 75 are labeled "extreme fear" and "extreme greed," respectively.
How is CNN's Fear and Greed Index calculated?
The index aggregates seven key indicators, each reflecting different aspects of market sentiment:
- Stock price momentum — Compares the S&P 500's current value to its 125 day moving average.
- Stock price strength — Tracks the number of stocks hitting 52 week highs vs. those reaching 52 week lows.
- Stock price breadth — Examines trading volume in advancing vs. declining stocks.
- Put and call options — Analyzes the ratio of bearish (put) options to bullish (call) options.
- Junk bond demand — Measures the yield spread between high-yield (junk) bonds and safer investment-grade bonds.
- Market volatility (VIX) — Follows the CBOE Volatility Index, often called the "fear gauge."
- Safe-haven demand — Assesses the relative performance of stocks vs. government bonds.
When these indicators collectively signal heightened caution, the Fear and Greed Index falls into the fear zone, with extreme fear indicating widespread pessimism in the markets.
Recent instances of extreme fear
Understanding past instances of extreme fear can provide insights into current market conditions. The last two notable times the index hit extreme fear were August 5, 2024, and December 19, 2024.
1. August 5, 2024: Global selloff and economic uncertainty
On August 5, 2024, markets saw a sharp decline following weak tech earnings and US employment data, accelerated by an unexpected interest rate hike by the Bank of Japan that resulted in investors trying to unwind yen carry trades.
This caused a ripple effect across global markets:
- Japan’s Nikkei 225 (INDEXNIKKEI:NI225) plummeted 12 percent in a single session.
- The S&P 500 fell over 4 percent amid investor concerns about an economic slowdown.
- The International Monetary Fund warned that the volatility could be a precursor to prolonged instability.
2. December 19, 2024: Federal Reserve’s hawkish stance
Investor fears resurfaced in mid-December 2024, when the US Federal Reserve signaled that interest rates would likely remain elevated longer than expected. The announcement sent shockwaves through the markets:
- The US dollar surged to a two year high, weighing heavily on emerging markets.
- Cryptocurrencies took a hit, with Bitcoin dropping over 15 percent in a week.
- The Dow Jones Industrial Average (INDEXDJX:.DJI) fell over 1,200 points as investors reassessed their outlook for rate cuts in 2025.
How do other fear-based indexes compare?
While CNN’s Fear and Greed Index is a popular barometer of market sentiment, it isn’t the only fear-based indicator worth watching. Here’s how other major sentiment gauges compare:
Crypto Fear & Greed Index
The Crypto Fear & Greed Index tracks investor sentiment in the cryptocurrency market. Crypto markets are particularly sensitive to risk-off sentiment, making this index an important measure for digital asset investors.
The Crypto Fear & Greed Index has also dropped into extreme fear, with a score of 15 on March 4. This decline coincided with continued geopolitical tensions, including Trump’s announcement of 25 percent tariffs on Canada and Mexico.
Doomsday Clock
Though not a financial index, the Doomsday Clock, updated annually by the Bulletin of Atomic Scientists, reflects global existential risks, including nuclear tensions, climate change and geopolitical instability.
As of January 28, 2025, the clock was at 89 seconds to midnight, signaling heightened global uncertainty, which can influence investor sentiment in risk assets like equities and cryptocurrencies.
What extreme fear means for investors
The plunge of CNN’s Fear and Greed Index into Extreme Fear territory signals widespread investor anxiety. But is this a warning of further declines, or a contrarian buy signal?
Historically, moments of extreme fear have often preceded strong market rebounds, as panicked selling creates opportunities for value investors. However, not all instances lead to immediate recoveries; some mark the beginning of prolonged downturns, and it can be difficult to tell which scenario is ahead.
Key considerations for investors:
- Economic data: Keep an eye on employment reports, inflation data and GDP growth figures.
- Fed policy: Interest rate decisions will continue to be a key driver of market sentiment.
- Corporate earnings: Weak earnings reports could exacerbate investor fears, while strong results may signal resilience.
- Geopolitical developments: Trade tensions, global conflicts and macroeconomic policies can shift market sentiment quickly.
While fear-based indicators provide valuable insights, investors should use them alongside fundamental and technical analysis to make informed decisions. Whether this moment marks a temporary panic or the start of a broader downturn remains to be seen, but one thing is clear: investors should be prepared for volatility in the weeks or months ahead.
This is an updated version of an article published by the Investing News Network in March 2025.
Don’t forget to follow us @INN_Resource for real-time news updates!
Securities Disclosure: I, Giann Liguid, hold no direct investment interest in any company mentioned in this article.
Keep reading...Show less
10 April
Independent Estimate Confirms Multibillion Barrel Prospective Resources
Condor Energy Limited (ASX: CND) (Condor or the Company) is pleased to announce the results of an independent prospective resource assessment conducted by international resource consultancy Netherland Sewell & Associates Inc. (NSAI) across five selected prospects in the Company’s Tumbes Basin Technical Evaluation Area LXXXVI (TEA or Block) offshore northern Peru.
Highlights
- New independent estimate confirms multibillion barrel prospective resource across five prospects in Tumbes TEA
- Total Best Estimate (2U) of 3 billion barrels of oil prospective resources1 (100% gross unrisked) across Bonito, Raya, Salmon, Caballa and Tiburon prospects
- The largest prospect, Bonito, has a Best Estimate (2U) of 1 billion barrels of oil prospective resource1 (100% gross unrisked)
- Majority of the resources are contained within Lower Miocene Zorritos Formation, a proven reservoir within the basin
- Resource potential determined by leading international petroleum consultancy Netherland Sewell and Associates (NSAI)
- World class multibillion barrel exploration potential builds on Condor’s substantial discovered gas field at Piedra Redonda (1 Tcf 2C)2
- Farmout process commenced with multiple parties in data room
- Shareholder briefing to be held Thursday 10 April, to detail resource estimate update
The NSAI evaluation confirms multibillion barrel potential, with a combined best estimate gross unrisked 2U prospective resource of 3 billion barrels of oil (2.4 billion barrels net to Condor) across the Bonito, Raya, Salmon, Caballa and Tiburon prospect areas (Table 1).
Figure 1 – Independent estimate of prospective resources across five prospects shown in purple, Raya, Salmon, Bonito, Caballa and Tiburon.
Table 1 – Statistically Aggregated Prospective Resource Estimates (Unrisked) at each of the 5 prospect areas Low (P90), Mid (P50), High (P10).
Prospective resources shown are aggregated by prospect area (Table 1). The geological chance of success (GCoS) has been assessed for the primary target reservoir within each prospect. Each prospect contains multiple stacked reservoir intervals, which may increase the effective chance of success due to multiple opportunities within a single structure.
Click here for the full ASX Release
This article includes content from Condor Energy, licensed for the purpose of publishing on Investing News Australia. This article does not constitute financial product advice. It is your responsibility to perform proper due diligence before acting upon any information provided here. Please refer to our full disclaimer here.
Keep reading...Show less
09 April
Mining the Vote: What Australia's Political Parties are Planning for Mining and Trade
Another Australian federal election is happening on May 3, and the country's political parties are in the midst of sharing their plans and goals for various sectors, including the mining industry.
Below is a breakdown of statements and platforms from each party, underlining their positions on the back of recent trade tensions, US tariffs and global production issues.
What are Australia's political parties?
Like many countries, Australia has two major parties, as well as several smaller parties.
The two major parties are the Australian Labor Party (ALP) and the Liberal Party of Australia.
The ALP is the major left party and is currently in government.
The Liberal Party is the centre-right party in opposition. It is in a long-term coalition with the National Party of Australia. Neither party would be able to form majority government without the coalition.
ABC describes the Nationals as representing "the interests of those living in regional and rural areas," with values that are similar to the Liberals but with more of a country focus.
The Greens are another notable party in Australia and are the result of an environmental movement in the 1980s. The group highlights environmental protection, social justice and increasing government support payments.
There's also One Nation, a right-wing populist political party launched in Queensland in 1997. Its focus is to protect Australian jobs, industry, agriculture, manufacturing, culture and natural heritage.
What do Australian politicians think about tariffs?
In terms of tariffs, the ALP and Liberal Party aren't fans of US President Donald Trump’s actions.
Prime Minister Anthony Albanese, head of the ALP, has called Trump's 10 percent tariffs “unjustified” and “harmful,” proposing a five point plan to mitigate impacts. This plan includes zeroing in on anti-dumping measures, financial assistance to affected industries and the establishment of a critical minerals reserve.
In a recent article, Reuters quotes Albanese as calling the imposition of tariffs “not the act of a friend."
The Liberal Party has criticized the ALP’s approach to tariffs, arguing that the conditions laid out under the five year plan are insufficient. Shadow Treasurer and Liberal Party member Angus Taylor said that there is a need for more comprehensive policies to tackle inflation and boost productivity.
For their part, the Greens have urged the Australian government to walk away from its AUKUS pact with the US. According to ABC, party leader Adam Bandt described the imposition of steel and aluminium tariffs as a "wake-up call" for Australia to rethink its relationship with a country that has been a key ally.
Pauline Hanson of One Nation has also commented on the tariffs, advocating for their use along with export quotas and other measures to protect Australian industries.
Commitments to Australia's mining sector
In terms of domestic production and keeping resources intact, the Australian government has already delivered support to increase green metals production through the Future Made in Australia Fund.
Professional leading services firm WSP said the country's 2025/2026 federal budget was a "pre-election pitch," noting that it puts the energy, mining and metals sectors "in the winner's circle."
The Future Made in Australia Fund has been allocated AU$1.5 billion, with AU$700 million dedicated to green metals. The green metals sector has also seen AU$2 billion in support from the Green Aluminium Production Credit, which is geared at supporting the Australian aluminium smelter’s transition to renewable energy.
Another AU$1 billion was given to accelerate the development of a new green iron industry.
“This year’s budget supports a fantastic opportunity for Australian industry to process more of our natural resources domestically — while doing so sustainably with renewable energy,” Paul Williams, WSP's managing director of mining and metals, said about the allocation.
The ALP has also underlined the value of national sovereignty over critical infrastructure. In a Guardian article, the party is quoted as expressing its intentions to reclaim the Port of Darwin from Chinese control.
The port is said to be Australia's nearest port to Asia and the nation's “northern gateway” for Australasian trade.
Issues with its ownership stem from when the Northern Territory's government granted a 99 year lease in 2015, making Chinese company Landbridge Group the owner.
Concerns over Landbridge's financial health have sparked talks on the port’s ownership in recent months. Darwin has also become an important subject in the election campaign, as both parties are keen on the reclamation.
Liberal leader Dutton was also quoted by Lloyd’s List saying that the coalition between the Liberals and Nationals would “move immediately” to bring Darwin back into Australian hands during a visit to the port on April 5.
Who will win the Australian election?
Roy Morgan Research said on Monday (April 7) that the ALP is leading in the polls at 53.5 percent as per the latest survey, showing a 0.5 percent increase from its results last week. Meanwhile, opposition partnership between the Liberals and Nationals is down 0.5 percent, closing with 46.5 percent of the total votes.
“The Albanese Government has strengthened its lead over the Coalition with under four weeks until election day,” said Roy Morgan CEO Michele Levine. “The Roy Morgan survey in the first week of March was the first poll to pick up the shift in support towards the ALP and away from the coalition — and this trend has continued to build over the last month.”
Roy Morgan said that the latest survey comprised a representative cross-section of 1,481 Australian electors from March 31 to April 4, 2025. Of all participants surveyed, only 5 percent can’t say who they would vote for.
Don’t forget to follow us @INN_Australia for real-time news updates!
Securities Disclosure: I, Gabrielle de la Cruz, hold no direct investment interest in any company mentioned in this article.
Keep reading...Show less
09 April
Optimised Root Lithium Project PEA Highlights Robust Economics
Following the release of the December 2023 PEA1 , and in response to lithium market dynamics, the Root Lithium Project has now been optimised within a new PEA which has strengthened the project economics.
Green Technology Metals Limited (ASX: GT1) (GT1 or the Company), a Canadian-focused multi-asset lithium business, is pleased to announce the completion of its optimised Preliminary Economic Assessment (PEA) for the standalone Root Lithium Project. The updated PEA outlines a robust development pathway for the Root Project, featuring a combination of open pit mine and underground mining methods. The processing flowsheet features a hybrid Dense Media Separation (DMS) and Flotation concentrator designed to produce 5.5% Spodumene Concentrate.
HIGHLIGHTS
- The Root Lithium Project in Ontario, Canada has been evaluated on a standalone basis and considering the recently updated Root Project MRE, revised pit optimisations and mine development options and changed lithium market conditions (previous 2023 PEA results were combined with the Company’s Seymour Lithium Project also in Ontario)
- The study confirms favourable economics across alternative mine development scenarios, including both open pit and underground mining, reinforcing Root as a viable and resilient standalone project
- The selected development option for the Root Lithium Project delivers:
- An increase in NPV to US$668 million
- A reduction in pre-production CAPEX, largely due to lower pre-stripping costs
- Reduction in Total Material Movement (TMM)
- Lower NPV and longer payback period due to more conservative SC5.5 pricing assumptions in early processing years
- Significantly improved LOM strip ratio of 8.1:1, driven by underground development—resulting in lower mining costs that help offset reduced revenues
PROJECT DASHBOARD
- The Root Lithium Project underpins GT1’s vertically integrated development strategy and is expected to provide long-term feed to the Company’s planned Lithium Conversion facility in Thunder Bay
- The immediate focus for the Root project will be advancing permitting and consultation activities in parallel with the Pre-Feasibility Study( PFS)
"The completion of the optimised PEA marks a major milestone for the Root Lithium Project, confirming it as a technically and economically robust standalone operation. With a longer mine life, reduced upfront capital requirements, and strong economics, Root is well-positioned to support GT1’s broader strategy of establishing a vertically integrated lithium supply chain in Ontario. This study reinforces our confidence in Root as a long-term feed source for the Thunder Bay conversion facility and highlights the project’s strategic importance in the North American battery materials landscape.
The economic advantages of executing a project in Ontario are obvious and compelling, driven by outstanding infrastructure, government incentives and proximity to the North American EV supply chain. We remain committed to advancing our Root Lithium Project to realise our overall strategy in Ontario.”
-GT1 Managing Director, Cameron Henry
Click here for the full ASX Release
This article includes content from Green Technology Metals Limited, licensed for the purpose of publishing on Investing News Australia. This article does not constitute financial product advice. It is your responsibility to perform proper due diligence before acting upon any information provided here. Please refer to our full disclaimer here.
Keep reading...Show less
Latest News
Latest Press Releases
Related News
TOP STOCKS
American Battery4.030.24
Aion Therapeutic0.10-0.01
Cybin Corp2.140.00
Investing News Network websites or approved third-party tools use cookies. Please refer to the cookie policy for collected data, privacy and GDPR compliance. By continuing to browse the site, you agree to our use of cookies.