- WORLD EDITIONAustraliaNorth AmericaWorld
Investing News NetworkYour trusted source for investing success
Resource
Popular Lists
Investing Ideas
Outlook Reports
- Lithium Outlook
- Oil and Gas Outlook
- Gold Outlook Report
- Uranium Outlook
- Rare Earths Outlook
- All Outlook Reports
Investing Guides
Tech
Popular Lists
- Top Generative AI Stocks
- Top EV Stocks
- Biggest AI Companies
- Biggest Blockchain Stocks
- Biggest Cryptocurrency-mining Stocks
- Biggest Cybersecurity Companies
- Biggest Robotics Companies
- Biggest Social Media Companies
- Biggest Technology ETFs
- Artificial Intellgience ETFs
- Robotics ETFs
- Canadian Cryptocurrency ETFs
Investing Ideas
Outlook Reports
- Artificial Intelligence Outlook
- EV Outlook
- Cleantech Outlook
- Crypto Outlook
- Tech Outlook
- All Market Outlook Reports
Investing Guides
Life Science
Popular Lists
- Cannabis Weekly Round-Up
- Top Alzheimer's Treatment Stocks
- Top Biotech Stocks
- Top Plant-based Food Stocks
- Biggest Cannabis Stocks
- Biggest Pharma Stocks
- Longevity Stocks to Watch
- Psychedelics Stocks to Watch
- Top Cobalt Stocks
- Small Biotech ETFs to Watch
- Top Life Science ETFs
- Biggest Pharmaceutical ETFs
Outlook Reports
- Life Science Outlook
- Biotech Outlook
- Cannabis Outlook
- Pharma Outlook
- Psychedelics Outlook
- All Market Outlook Reports
Investing Guides
September 02, 2024
Up to 18.5% Copper & 34.8% Zinc in initial pXRF readings* on drillcore
Golden Deeps Ltd (ASX: GED) is pleased to announce the intersection of significant sulphide mineralisation in all three completed diamond drillholes at its 100% owned Havilah Project in the Lachlan Fold Belt Copper-Gold Province of central NSW (see Figure 1, below, and regional location, Figures 3 and 4).
- Thick copper and zinc sulphide mineralisation has been intersected in diamond drilling of key targets at the Company’s Havilah Project in the world-class Lachlan Fold Belt Copper-Gold Province of NSW1,2 (see Hazelbrook Prospect plan - Figure 1, cross section - Figure 2 and location plans - Figures 3 and 4).
- Diamond drillhole HVD003, which tested the extensive Hazelbrook copper soil and rockchip (>1% Cu) anomaly3, intersected patches of semi-massive copper (chalcopyrite) and zinc (sphalerite) sulphides as well as vein and disseminated sulphides across an 80m zone in the targeted Sofala Volcanics (see Image 1 showing the sulphide mineralisation; Appendix 1 for drillhole details & Appendix 2 for descriptions of mineralisation).
- The mineralised intersection in HVD003 included a 28m zone (from 85.8m) of more intense sulphide mineralisation which produced high-grade portable XRF (pXRF) readings of up to 18.5% Cu and 34.8% Zn, averaging 0.5% Cu and 0.7% Zn* (see Appendix 3 for full tables of pXRF readings and Cautionary Note below).
- Diamond hole HVD001, which tested the Hazelbrook North Cu-Zn-Au anomaly3, intersected 40m of silicified breccia/veining and disseminated sulphides (py +/-cpy, sph) from surface, and HVD002, which tested a strong Induced Polarisation (IP) anomaly1, intersected a 130m zone of altered mafic volcanics with scattered veinlets and disseminations of pyrite and rare chalcopyrite (see Figure 1, location, and Appendix 2, descriptions).
- The diamond drilling program continues with HVD004 testing the Hazelbrook anomaly 200m along strike to the northeast of HVD003, again under rockchip sample values of >1% Cu3 (see Figure 1).
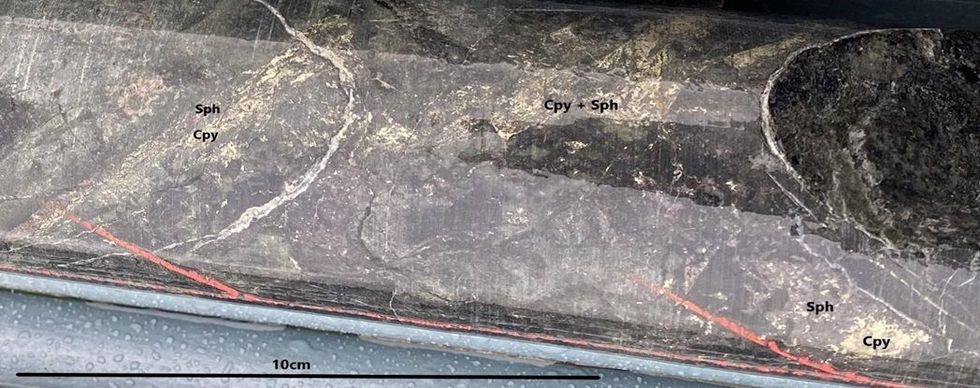
Image 1: HVD003, 85.8m to 86m: semi-massive sulphide patches of copper sulphide - chalcopyrite (cpy) and zinc sulphide - sphalerite (sph) in Ordovician mafic volcanics (pXRF readings up to 18.5% Cu, 34.8% Zn* – see Appendix 3)
*Cautionary Note in relation to disclosure of visual estimates and pXRF readings described in this release and detailed in Appendix 2 and 3 respectively: The Company cautions that visual estimates of sulphide mineralisation abundance and pXRF readings should never be considered a proxy or substitute for laboratory analyses. Laboratory assays (ICP MS/OES and Fire Assay for gold) are required to determine representative grades and intervals of the elements associated with the visible mineralisation reported from geological logging and pXRF readings. Core is being sampled for submission to ALS laboratories in Orange, NSW. Laboratory analytical results are expected within 3 to 6 weeks.
Golden Deeps CEO Jon Dugdale commented: “The intersection of sulphide mineralisation in all three initial holes at Havilah, including thick zones of copper and zinc sulphide mineralisation in HVD003, indicates we’re on top of a large porphyry-sulphide system with similar characteristics to other major copper-gold discoveries in the Lachlan Fold Belt such as Cadia-Ridgeway and the recent Boda-Kaiser discovery.
“We look forward to completing the remainder of our diamond drilling program and receiving the laboratory results from the holes completed, which will be released as soon as they come to hand and are compiled.”
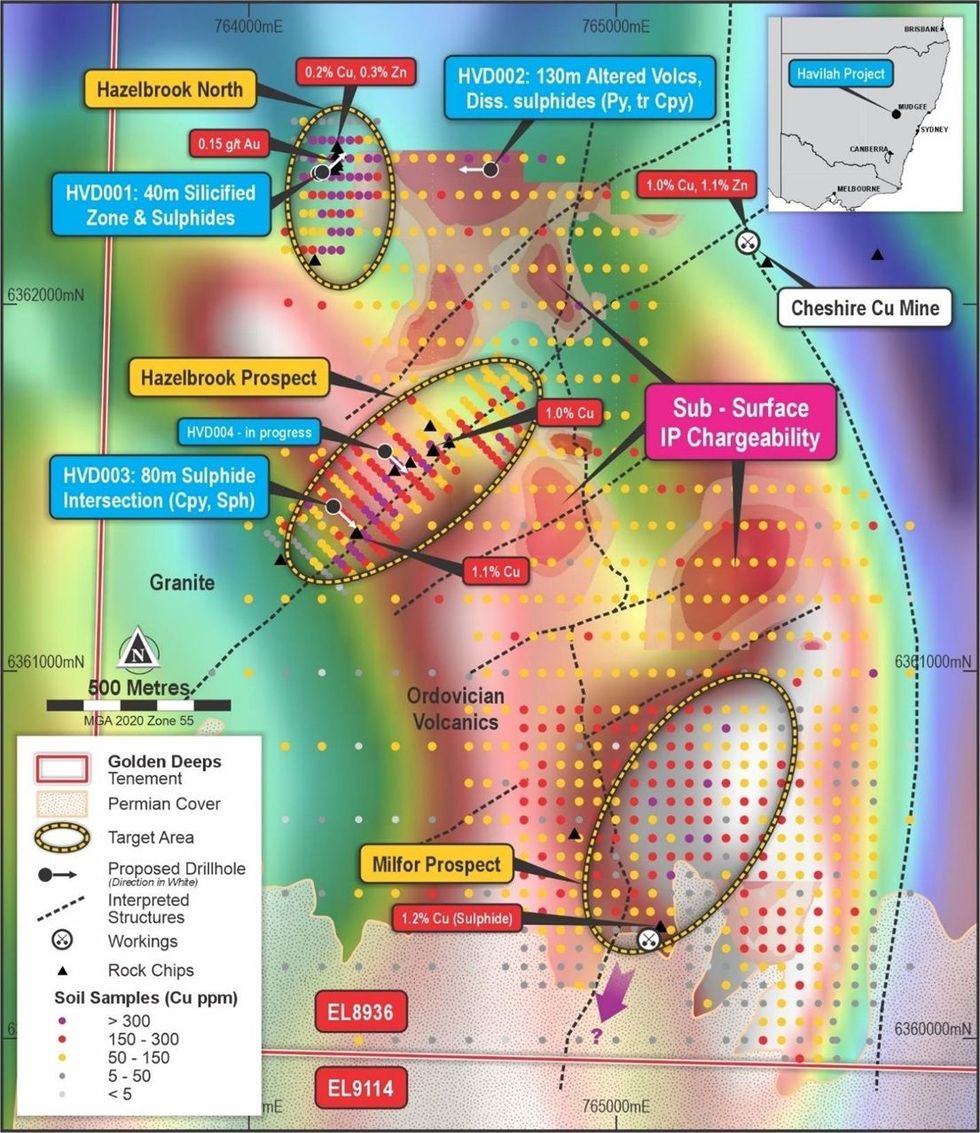
Figure 1: Havilah Project, soil and rockchip copper anomalies on magnetics image with current drilling
The third hole of the program, HVD003, tested the Hazelbrook target where an extensive northeast-southwest trending copper-zinc soil anomaly has been defined with rockchip values of over 1% Cu3 (Figure 1).
HVD003 intersected a sulphide mineralised zone from 85m to 119m which included patches and stringers (averaging 1-2%) of the copper-sulphide - chalcopyrite and the zinc-sulphide - sphalerite. These patches occur within extensively altered (Ordovician) mafic volcanic/volcanoclastic rocks with disseminated chalcopyrite-sphalerite-pyrite mineralisation which occurs from 85m to 166m (over 80m) (see Appendix 2).
The mineralisation aligns with the surface soil and rockchip copper-zinc anomaly, striking northeast, dipping to the northwest, and the drilling intersection approximating true width (see cross section, Figure 2, below).
Click here for the full ASX Release
This article includes content from Golden Deeps, licensed for the purpose of publishing on Investing News Australia. This article does not constitute financial product advice. It is your responsibility to perform proper due diligence before acting upon any information provided here. Please refer to our full disclaimer here.
The Conversation (0)
27 February
Types of Copper Deposits in the World
Copper mineralization occurs in many forms and in a variety of geological settings. As such, there are various factors to consider when determining the value of different types of copper deposits.
Historically, the world’s most profitable copper mines have been large-scale porphyry deposits with chalcopyrite mineralization extracted via open-pit mining. While they do not have the highest grades of ore and generally have more expensive refining costs, they tend to have large mineral resources.
The world's biggest copper mine is the Escondida copper porphyry mine in Chile, which is owned by BHP (NYSE:BHP,ASX:BHP,LSE:BHP), Rio Tinto (NYSE:RIO,ASX:RIO,LSE:RIO) and Japanese firm Jeco at 57.5 percent, 30 percent and 22.5 percent respectively. Escondida means “hidden” in Spanish, and the deposit was given the name because it has no outcrops; the main orebody is hidden below hundreds of meters of overburden.
Copper production figures can change rapidly, but in the first half of BHP's 2025 financial year, the company's portion of Escondida’s copper production reached 644,000 metric tons, up 22 percent over the same period in the previous year. This represents a 10 year production record for the mine. Escondida has processed more than 2 billion metric tons of ore through leaching and flotation since opening more than a quarter century ago. Today it accounts for almost 5 percent of worldwide copper output.
How to determine the value of a copper deposit?
As mentioned, there are many factors to look at when determining the value of a copper deposit.
Among other elements, companies must consider grade, refining costs, the estimated copper resource and the ease at which the copper can be mined. Read on for a brief overview of five things that are important to think about when finding the value of a copper deposit.
1. What are the types of copper deposits?
Porphyry copper deposits are low grade, but are important sources of copper because they can be worked at a large scale for low costs. They typically contain between 0.4 and 1 percent copper in concert with smaller amounts of other metals, such as molybdenum, silver and gold. Porphyry copper mineral deposits are usually massive, with extraction taking place by open-pit mining.
Copper-bearing sedimentary rocks are the second most important type of copper deposit, accounting for approximately one-quarter of the world’s identified copper deposits.
Other types of copper deposits found throughout the world include:
- Volcanogenic massive sulfide (VMS) deposits, a source of copper sulfide formed through hydrothermal events in submarine environments.
- Iron oxide-copper-gold (IOCG) deposits are highly valuable concentrations of copper, gold and uranium ores.
- Copper skarn deposits, which in a broad sense are formed through chemical and physical mineral alterations created when two separate lithologies make contact.
2. What is the average copper deposit grade?
Grade is a significant factor in how much a deposit is worth, and is effectively is a measure of the concentration of metal. Most copper ores contain only a small percentage of copper metal bound up within valuable ore minerals. The remainder of the ore is simply unwanted rock.
Exploration companies conduct drill programs to extract samples of rock called cores. The cores are then subjected to chemical assays to determine the “grade” of a deposit.
Copper deposit grades are usually expressed as a weight percentage of the total rock. For example, 1,000 kilograms of copper ore containing 300 kilograms of copper metal has a grade of 30 percent. When metal is at a much lower concentration, it may be described in terms of parts per million. However, grade is the common convention with copper, and exploration companies estimate grade through drilling and assaying.
The average grade of copper ores in the 21st century is below 0.6 percent copper, with the proportion of ore minerals being less than 2 percent of the total volume of the ore rock.
Investors should approach grade estimates with a critical eye. When an exploration company issues grade statements, investors should be sure to compare them to the total depth of the drill core used to determine the grade. A high grade at a low depth can have far less value than a mediocre grade consistent through a deep core.
3. How much does it cost to mine copper?
The largest, most profitable copper mines have been open-pit mines, although underground copper mines are not uncommon. Of key importance in an open-pit mine is a resource that is relatively close to the surface.
Mining companies are particularly interested in the amount of overburden, which is the amount of worthless rock and soil on top of the copper resource. This material must be removed to access the resource. Escondida, mentioned above, has a resource that is covered by a large amount of overburden, but the deposit is still economic due to the large size of the resource beneath.
4. What are the types of copper ore?
There are two distinct types of copper deposits: sulfide ore and oxide ore. Currently, the most common source of copper ore is the sulfide ore mineral chalcopyrite, which accounts for about 50 percent of copper production. Sulfide ores are processed via froth floatation to obtain copper concentrate. Copper ores containing chalcopyrite can produce a concentrate with 20 to 30 percent copper in concentrate.
The more valuable chalcocite concentrates typically grade higher, coming in between 37 and 40 percent copper in concentrate due to the fact that chalcocite contains no iron. Chalcocite has been mined for centuries, and is one of the most profitable copper ores. The reason for that is its high copper content and the ease at which the copper it contains can be separated from sulfur.
It is not, however, the primary copper ore today. Copper oxide ores are leached with sulfuric acid to liberate the copper minerals into a solution of sulfuric acid laden with copper sulfate solution. The copper sulfate solution (called the pregnant leach solution) is then stripped of copper via a solvent extraction and electrowinning process, which is more economical compared to froth flotation.
5. What are primary and secondary ores?
All copper mines have different mineral assemblages. The primary assemblage is the mineralization type that is most prevalent. Most types of copper deposits also have secondary ores, however, and they can add a great deal of value to a deposit. The Escondida mine is primarily a chalcopyrite porphyry deposit overlain by secondary oxides. It is important for companies not to discount secondary mineralization.
What makes a world-class copper deposit?
While there are other factors to consider when valuing a copper deposit, the upshot is that a world-class copper deposit holds a copper resource whose value far exceeds the cost of mining and refining. To date, some of the biggest copper finds have been the Kennecott copper mine, a large-scale porphyry deposit, the Chuquicamata copper porphyry complex and, of course, Escondida.
This is an updated version of an article originally published by the Investing News Network in 2016.
Don’t forget to follow us @INN_Resource for real-time news updates!
Securities Disclosure: I, Melissa Pistilli, hold no direct investment interest in any company mentioned in this article.
Keep reading...Show less
27 February
Trump's Copper Tariff Investigation Triggers Global Market Response
American head of state Donald Trump has directed the US government to explore potential tariffs on copper imports, marking another significant move in his administration’s ongoing trade strategy.
The executive order, signed on Tuesday (February 25), instructs the commerce department to investigate whether imported copper poses a national security risk under Section 232 of the Trade Expansion Act of 1962.
The decision has already triggered a sharp reaction in the global copper market, widening price spreads for the red metal and prompting traders to start rushing shipments to the US.
According to the Globe and Mail, White House trade adviser Peter Navarro said the move is designed to curb China’s expanding copper sector while addressing vulnerabilities in the US supply chain. He emphasized the need to restore domestic mining, smelting and refining of copper, citing military and technological applications.
Despite Trump’s longstanding push for trade balance, the US currently runs a surplus in copper trade. In 2024, the country exported US$11.3 billion worth of copper while importing US$9.6 billion, according to census bureau data.
US officials are arguing that shifting supply and demand forecasts create a national security risk.
Trump has used tariffs extensively as part of his trade policies, previously removing exemptions for 2018 tariffs on steel and aluminum. Most recently, he has threatened neighboring nations — Canada and Mexico — with 25 percent tariffs on all imports. These could take effect as early as next week, although plans have changed multiple times.
The president has also pledged broader tariffs to match rates imposed by other nations, and has targeted industries including automobiles, semiconductors and pharmaceuticals.
Traders seek copper arbitrage opportunities
The announcement about potential copper tariffs has sent US copper prices soaring, leading to an arbitrage opportunity that traders have been quick to exploit. Prices for the metal on New York’s Comex surged as much as 4.9 percent, with copper trading over US$1,000 above the London Metal Exchange (LME) benchmark.
Earlier this month, Comex copper contracts spiked to a US$1,300 premium over LME prices before narrowing to US$600 and then widening again after Trump’s announcement. The investigation into copper could take months to complete, allowing traders more time to move metal into the US without penalties.
Major companies, including Glencore (LSE:GLEN,OTC Pink:GLCNF) and Trafigura Group, have been moving to ship copper to the US market in recent weeks, according to industry sources. While the bulk of their shipments are coming from South America, inquiries have also been made about shipping copper from Asian warehouses tracked by the LME.
The potential tariffs are also reshaping global copper flows, with requests to withdraw copper from LME warehouses in Asia surging by over 93,000 metric tons in recent days, marking the largest four day drawdown since 2013.
The shift is redirecting metal that typically flows to China, the world’s top copper consumer, toward the US market.
The increase in US copper prices is also raising costs for domestic manufacturers, which have paid an average premium of 8 percent over global prices since Trump first floated the idea of copper tariffs in late January.
One challenge for copper importers is that only a limited number of producers are approved for delivery on Comex, with Chinese smelters notably absent from the list. Furthermore, Trump’s existing 10 percent tariff on Chinese goods, implemented earlier this month, has dissuaded some firms from targeting the US market.
While global copper markets brace for uncertainty, companies with assets in the US are looking to capitalize on the government's efforts to shore up domestic supply. Those include American Pacific Mining (CSE:USGD,OTCQX:USGDF), which believes its two US-based copper projects could play a role in Trump's copper ambitions.
“The current market dynamics and US policy trends underscore the strategic value of our US-based copper assets. With projects like our Madison Copper-Gold project in Montana and Palmer Copper-Zinc project in Alaska, we are well-positioned to potentially supply the growing domestic demand for copper, a critical metal for the US economy and clean energy transition,” Warwick Smith, CEO of American Pacific, said in a statement.
Don’t forget to follow us @INN_Resource for real-time news updates!
Securities Disclosure: I, Giann Liguid, hold no direct investment interest in any company mentioned in this article.
Keep reading...Show less
25 February
Top 10 Copper Producers by Country
In 2024, concern grew about copper supply as copper mines in the top copper-producing countries continued to age without new mines to replace them.
Additionally, copper demand from electrification is expected to rise significantly in the coming years.
The competing forces of the global macroeconomic situation and a tightening supply and demand situation caused major swings in the copper price last year, and the red metal set a new all-time high in May 2024 as it moved above the US$5 per pound mark for the first time.
Despite a tight supply situation, demand from the energy transition has largely been muted as China, traditionally the largest consumer of copper for its infrastructure, works to stimulate its flagging economy.
The forecast for copper over the next few years is that the copper market will move into supply deficits, which in turn should provide more tailwinds for the price of copper and greater upside to company balance sheets.
For investors interested in copper, it’s worth looking at production by country. According to the latest US Geological Survey data, global copper production reached 23 million metric tons (MT) in 2024. Mining output figures for this article were supplemented with data provided by Mining Data Online (MDO).
Chile again took the crown to become the top copper producing country last year, but some of the others on the list may surprise you. Read on to find out the top 10 copper countries and what mines are driving each country's copper output.
1. Chile
Copper production: 5.3 million metric tons
In 2024, Chile produced 5.3 million metric tons of copper, making it the world’s largest copper producing country with about 23 percent of the total global copper output.
Naturally, many of the world's leading copper miners have substantial operations in Chile, including the state-owned Codelco, Anglo American (LSE:AAL,OTCQX:AAUKF), Glencore (LSE:GLEN,OTC Pink:GLCNF) and Antofagasta (LSE:ANTO,OTC Pink:ANFGF).
Chile is also home to BHP’s (ASX:BHP,NYSE:BHP,LSE:BHP) Escondida, the largest copper mine in the world with an annual output in the 2 million metric ton range. According to MDO, BHP owns a 57.5 percent stake in the operation, with Rio Tinto (ASX:RIO,NYSE:RIO,LSE:RIO) owning 30 percent and Jeco holding the remaining stake
According to BHP’s 2024 annual report, the company's portion of Escondida production came in at 1.13 million MT of copper in 2024.
However, Chile’s copper production is expected to rebound to record levels in 2025, according to S&P Global, to hit a projected 6 million MT as new mines ramp up their output.
2. Democratic Republic of Congo
Copper production: 3.3 million metric tons
In 2024, the Democratic Republic of Congo (DRC) produced 3.3 million metric tons of copper, accounting for more than 11 percent of global copper output. The DRC has increased its copper production rapidly in recent years, and its 2024 output marked a significant rise from the 2.93 million metric tons of copper produced the previous year.
One contributor to this increase is Phase 3 of the Ivanhoe Mines (TSX:IVN,OTCQX:IVPAF) Kamoa-Kakula project, which achieved commercial production in August 2024. A joint venture with partner Zijin Mining Group (OTC Pink:ZIJMY,SHA:601899), Kamoa-Kakula produced 437,061 MT of copper in 2024, an increase from the 393,551 MT produced in 2023. Ivanhoe is expecting further increases in production in 2025 and set its guidance for the year at 520,000 and 580,000 MT of copper.
3. Peru
Copper production: 2.6 million metric tons
In 2024, Peru produced 2.6 million metric tons of copper, according to USGS data. The total is down 160,000 MT from its copper output in 2023.
Among the factors impacting the declines was a 3.7 percent drop at Freeport McMoRan’s (NYSE:FCX) Cerro Verde, the largest copper mine in Peru. According to data from MDO, Cerro Verde produced 1.94 million metric tons of copper concentrate in 2023. Freeport McMoRan indicated in its Q1 2024 report that declines in its South American operations were due to lower volumes of stockpiled leach ore and lower milling rates associated with maintenance.
Other significant copper operations in Peru include Anglo American’s Quellaveco mine and Southern Copper’s (NYSE:SCCO) Tia Maria mine. The majority of copper produced in Peru is shipped to China and Japan, and South Korea and Germany are other top export destinations.
4. China
Copper production: 1.8 million metric tons
In 2024, China produced 1.8 million metric tons of copper. The total was marginally lower than the 1.82 million metric tons produced in 2023, but also marks a steady decline over the past few years, seeing production slip from a recent high of 1.91 million metric tons in 2021.
However, when it comes to refined copper production, China is by far the winner. In 2024, its refined copper production totaled 12 million metric tons, representing more than 44 percent of global refined copper production and six times the production of Chile, the next-top refinery producer. China also holds the world’s highest copper reserves at 190 million MT.
Zijin Mining Group, a leading metal producer in China, owns the Qulong copper-molybdenum-silver-gold mine in Tibet. The company purchased a 50.1 interest in the owner of the Qulong mine in 2024 and is working to consolidate 100 percent ownership. Zijin increased its mine production in 2024 and it is now the largest copper mine in China.
According to MDO, the Qulong mine produced 340 million pounds of copper in 2023. While its 2024 copper production is still being finalized, it is estimated to have increased to 366 million pounds.
5. Indonesia
Copper production: 1.1 million metric tons
In 2024, Indonesia produced 1.1 million metric tons of copper, passing the United States and Russia to become the fifth highest copper producer. The country's copper production has increased steadily in recent years, and is up significantly from 907,000 MT in 2023 and 731,000 MT in 2021.
Freeport McMoRan's Grasberg complex is the country’s largest copper mine. According to MDO data, the mine produced 1.66 billion pounds of copper in 2023.
Another of the country’s largest operations is PT Amman Mineral’s (IDX:AMMN,FWB:U4Z) Batu Hijau mine. While production in 2023 was modest compared to Grasberg at 542 million pounds of copper concentrate, it’s estimated that 2024 will see production increase significantly to 1.84 billion pounds as the mine begins processing high-grade ore from its Phase 7 cutback.
In mid-2024, Amman Minerals commissioned a smelting facility that will process 900,000 metric tons of copper concentrate annually to produce 222,000 MT of copper cathodes and 830,000 MT of sulfuric acid.
6. United States
Copper production: 1.1 million metric tons
The United States produced 1.1 million metric tons of copper in 2024. While only 30,000 metric tons less than its 2023 production totals, the country’s 2024 output was a sharp decline from the 1.23 million MT it produced in 2022.
The majority of US copper comes from Arizona, which accounts for 70 percent of domestic supply. Other states with significant copper output include Michigan, Missouri, Montana, Nevada and New Mexico. Overall, 17 mines are responsible for 99 percent of copper production in the United States.
Freeport McMoRan’s Morenci mine in Arizona, a joint venture with Sumitomo (TSE:8053), is the largest copper mine in the US. According to MDO data, the mine produced 700 million pounds of copper metal in 2024 and has 12.63 million pounds of proven and probable reserves.
Other significant operations include Freeport McMoRan’s Safford and Sierrita mines, at which copper production totaled 249 million MT and 165 million MT respectively.
7. Russia
Copper production: 930,000 metric tons
Russia produced 930,000 metric tons of copper in 2024, a sizable increase from the 890,000 MT produced the previous year.
One of the key contributions to the rise in Russian copper output is the ramp-up in Phase 1 production at Udokan Copper’s Udokan mine in Siberia. Although the mine experienced multiple fires at the very end of 2023, copper production was reported to be unaffected. The mine was expected to produce up to 135,000 metric tons of copper in 2024. This is expected to grow to 450,000 MT once Phase 2 comes online in 2028.
8. Australia
Copper production: 800,000 metric tons
In 2024, Australia produced 800,000 metric tons of copper, a slight increase from the 778,000 MT produced in 2023.
The country’s largest copper operation is BHP’s Olympic Dam mine in South Australia. According to MDO data, 2024 marked a 10 year high in total copper production for Olympic Dam at 216,000 metric tons.
The state of Queensland is home to the Mount Isa complex, run by a subsidiary of Glencore. While it is one of Australia’s largest copper producers, the operations will be closed in the second half of 2025.
Australia may have modest output compared to those at the top of the list, but it is tied with Peru for the second highest copper reserves in the world at 100 million metric tons, behind only China with 190 million metric tons.
9. Kazakhstan
Copper production: 740,000 metric tons
In 2024, Kazakhstan produced 740,000 metric tons of copper, on par with 2023’s production totals. Although its production was unchanged year-over-year, the country entered the top 10 copper producers list this year, leapfrogging over Mexico and Zambia.
Kazakhstan's copper output is up substantially compared to just a few years ago, with the country producing just 510,000 MT in 2021.
The nation plans to continue that trend, releasing a National Development Plan in February 2024 that aims to increase mineral production by 40 percent by 2029. The plan will involve increased exploration, project co-financing and tax incentives for investment.
Among the country’s largest mining companies is private firm KAZ Minerals, which owns the Aktogay mine. According to the company’s Q4 2024 production report, the mine produced 228,800 metric tons of copper during the year, a decline from the 252,400 MT produced in 2023.
10. Mexico
Copper production: 700,000 metric tons
Rounding out our list of top copper producers, Mexico produced 700,000 metric tons of copper in 2024, just 1,000 MT above its 2023 output.
The Buenavista del Cobre mine in Sonora, owned by Grupo Mexico (BMV:GMEXICOB), is the largest copper mine in the country. According to MDO data, the mine produced 725 million pounds of copper concentrate and 193 million pounds of copper cathode in 2023.
In addition, Grupo Mexico also owns Mexico’s second-largest copper mine, La Caridad, which produced 387,000 MT of copper concentrate and 51 million pounds of copper cathode in 2023.
Don’t forget to follow us @INN_Resource for real-time updates!
Securities Disclosure: I, Dean Belder, hold no direct investment interest in any company mentioned in this article.
Keep reading...Show less
24 February
Issue of shares and cleansing notice
24 February
Application for quotation of securities - ANX
21 February
Top 5 Canadian Mining Stocks This Week: Minsud Resources Up 47 Percent on Maiden Resource
Welcome to the Investing News Network's weekly look at the best-performing Canadian mining stocks on the TSX, TSXV and CSE, starting with a round-up of Canadian and US news impacting the resource sector.
Statistics Canada released its January consumer price index (CPI) figures on Tuesday (February 18). The data showed that inflation ticked up on a yearly basis to 1.9 percent from the 1.8 percent recorded in December. On a monthly basis, CPI rose 0.1 percent in January following a 0.4 percent decline in December.
The rise in inflation was owed to a 5.3 percent increase in energy prices on an annualized basis, primarily gasoline and natural gas, after recording a more modest 1 percent gain the previous month. Headlining the gains was an 8.6 percent jump in gasoline prices versus the same period last year and a 3.5 percent increase over December.
The agency also released its December mineral production survey on Thursday (February 20). The report showed overall increases in copper, gold and silver production and shipments compared to November’s totals.
Copper production increased by over 5 million kilograms to 38.93 million kilograms in December, up from 33.23 million kilograms the prior month. Shipments saw a similar increase, with 49.17 million kilograms shipped compared to 44.6 million kilograms shipped in November.
Gold production increased to 17,325 kilograms from 16,573 kilograms in November. Meanwhile, shipments of the precious metal increased even more, coming in at 23,217 kilograms compared to 14,332 kilograms in November.
As for silver, December saw the highest production and shipment levels for silver in 2024. Silver production increased to 33,074 kilograms, up significantly month-over-month from 24,959 kilograms. Silver shipments jumped even more at 36,984 kilograms, a considerable uptick from November’s 23,709 kilograms.
In mining news, Anglo American (LSE:AAL,OTCQX:AAUKF) announced that its 50.1 percent owned subsidiary Anglo American Sur and Chilean state mining company Codelco signed a memorandum of understanding to create a framework for implementing a joint mining plan for the companies’ adjacent Los Bronces and Andina mines in Chile.
Anglo American says the new operating company will optimize the use of processing capacity between the two mines. The companies expect that the mines will produce an additional 2.7 million metric tons of copper over a 21-year period starting in 2030, and generate an additional US$5 billion in pre-tax value. The companies will retain full ownership of their respective properties.
Markets and commodities react
US equity markets were broadly down this week, with the S&P 500 (INDEXSP:INX) losing 1.67 percent to end Friday (February 21) at 6,013.12 and the Nasdaq-100 (INDEXNASDAQ:NDX) falling 1.93 percent to 21,614.08. The Dow Jones Industrial Average (INDEXDJX:.DJI) sank the furthest, down 2.89 percent to 43.428.03.
In Canada, markets were also in decline. The S&P/TSX Venture Composite Index (INDEXTSI:JX) fell 2.48 percent on the week to close at 634.69 on Friday, the S&P/TSX Composite Index (INDEXTSI:OSPTX) posted a 2.15 percent loss to hit 25,147.03 and the CSE Composite Index (CSE:CSECOMP) dropped 2.59 percent to 132.46.
After hitting new all-time highs on Wednesday, the gold price remained in record territory on Friday, seeing a 1.78 percent increase on the week to close at US$2,934.24 per ounce at 4:00 p.m. EST. Silver also saw gains this week, moving up 1.22 percent to US$32.52.
In base metals, the copper price was in decline this week, shedding 2.13 percent throughout the week to close at US$4.59 per pound on the COMEX. Meanwhile, the S&P GSCI (INDEXSP:SPGSCI) was flat, shedding 0.08 percent to close at 569.41.
Top Canadian mining stocks this week
So how did mining stocks perform against this backdrop?
We break down this week’s five best-performing Canadian mining stocks below.
Data for this article was retrieved at 3:00 p.m. EST on Friday using TradingView's stock screener. Only companies trading on the TSX, TSXV and CSE with market capitalizations greater than C$10 million are included. Companies within the non-energy minerals and energy minerals sectors were considered.
1. Minsud Resources (TSXV:MSR)
Weekly gain: 47.06 percent
Market cap: C$156.7 million
Share price: C$1
Minsud Resources is a copper exploration company focused on advancing its operations in Argentina.
Its flagship project, Chita Valley, is located in San Juan and covers 19,883 hectares. The area hosts widespread porphyry copper-molybdenum-silver-gold mineralization and includes three core properties: the Chita, Brechas Vacas and the Minas de Pinto mineral concessions. Minsud’s primary target is its Chinchillones deposit.
Shares in Minsud saw recent gains following the release of a technical report for Chita Valley on February 14 reporting its January maiden mineral resource estimate (MRE) for the Chinchillones deposit. The deposit’s total indicated resource is 188 million metric tons (MT) of ore containing 466,000 MT of copper, 674,000 ounces of gold, 63.5 million ounces of silver, 6,800 MT of molybdenum and 291,000 MT of zinc.
The deposit also hosts an inferred resource of 573 million MT of ore containing 1.24 million MT of copper, 1.65 million ounces of gold, 166.6 million ounces of silver, 53,200 MT of molybdenum and 616,000 MT of zinc.
2. Kapa Gold (TSXV:KAPA)
Weekly gain: 32 percent
Market cap: C$11.58 million
Share price: C$0.165
Kapa gold is an exploration company focused on advancing the past-producing Blackhawk mine in San Bernardino County, California.
The project site is composed of seven patented and 178 contiguous federal lode claims covering 1,496.2 hectares. The property hosts multiple mineralized zones with previous exploration work revealing deposits with high grade gold, silver, lead and zinc. Historic production has seen grading from ramps and underground mines averaging 10 grams per metric ton (g/t) gold.
Kapa has not released news since January 7, when it announced that it was advancing baseline studies and surface exploration at Blackhawk. The company said the work was being conducted in preparation for a 2025 drill program, with data gathered being used to identify drill targets.
3. Power Metals (TSXV:PWM)
Weekly gain: 31.03 percent
Market cap: C$160.67 million
Share price: C$1.14
Power Metals is a lithium and cesium exploration company focused on its Case Lake project.
Located in Northeastern Ontario, the site is 10 kilometers by 9.5 kilometers in size and comprises 585 cell claims. Exploration at the site between 2017 and 2024 led to the discovery of pegmatite dykes bearing lithium, cesium and tantalum (LCT). Case Lake now consists of six spodumene dykes that form a mineralization trend of about 10 kilometers.
Assays from the site released on February 14 included a highlight of 8.07 meters grading 2.19 percent lithium oxide, 5.19 percent cesium oxide and 1,438 parts per million (ppm) tantalum. The results also included a 1 meter intersection bearing 1.85 percent lithium oxide, 11.7 percent cesium oxide and 208 ppm tantalum.
In addition to its most recent exploration news, Power Metals announced on February 10 that it had brought on DRA Global to begin work on a maiden mineral resource estimate and preliminary economic assessment for the Case Lake project. It expects to have the former completed by the end of Q1 2025, with the latter to follow in Q2.
Adding to Power Metals' recent share gains was a release on February 5 in which the company reported that it had been awarded a new exploration permit for Case Lake. The new permit will remain valid for the next three years and will be used to target newly identified cesium targets uncovered in late 2024.
While the company did not release news this week, it continued its upward trend from recent weeks.
4. Minco Silver (TSXV:MSV)
Weekly gain: 29.73 percent
Market cap: C$12.82 million
Share price: C$0.24
Minco Silver is a development company working to advance its Fuwan silver project in China’s Guangdong province.
The property consists of three exploration permits covering a total of 125.74 square kilometers. Exploration to date has largely been focused on an area hosting 2.8 kilometers by 10 kilometers of strike.
A 2009 feasibility study for the property included a total probable reserve estimate of 55.3 million ounces of silver across 9.12 million metric tons of ore with an average grade of 189 g/t.
Shares in Minco have seen gains this past week but the company has not released news.
5. K2 Gold (TSXV:KTO)
Weekly gain: 29.03 percent
Market cap: C$24.65 million
Share price: C$0.18
K2 Gold is a gold exploration and development company with a portfolio of three assets located in Canada and the United States.
The company’s Wels project in Canada is composed of 351 contiguous quartz claims covering 7,200 hectares near Beaver Creek, Yukon. According to the project page, K2 says the deposit is similar to Newmont’s (TSX:NGT,NYSE:NEM) nearby 4 million ounce Coffee gold deposit.
In the US, K2 owns its flagship Mojave gold project in Inyo County, California, which covers 5,830 hectares with 12 exploration targets. In addition to gold, Mojave also contains mineralization of copper, silver, lead and zinc.
The company’s final asset is the Si2 gold project in Esmeralda County, Nevada, US. The site consists of 118 Bureau of Land Management lode claims covering 986 hectares in the Walker Land trend. Exploration has indicated gold-bearing mineralization, with concentrated veins hosted by fault structures at depth.
On January 17, K2 announced that it signed an agreement with Orogen Royalties (TSXV:OGN) to accelerate its acquisition of a 100 percent stake in the Si2 project.
The new deal will see K2 pay Orogen C$250,000 in cash or common shares and a 2 percent net smelter return royalty to immediately acquire the property, replacing a January 2022 deal in which K2 had to make US$200,000 in cash payments and C$2.3 million in exploration expenditures.
The release also included results from an alteration study on Si2 drill core that determined the presence of an intact, low-sulfidation epithermal gold system.
K2 said the acquisition “allows us the flexibility to advance the project at our own pace as we approach the final steps in permitting at K2’s flagship Mojave project.
The Company’s most recent news came on February 21, when it said it had increased its previously announced non-brokered private placement to C$3 million in capital through the sale of 20 million units at a price of C$0.15 per share. The funds will be used for exploration and permitting at the Mojave gold project.
FAQs for Canadian mining stocks
What is the difference between the TSX and TSXV?
The TSX, or Toronto Stock Exchange, is used by senior companies with larger market caps, and the TSXV, or TSX Venture Exchange, is used by smaller-cap companies. Companies listed on the TSXV can graduate to the senior exchange.
How many companies are listed on the TSXV?
As of June 2024, there were 1,630 companies listed on the TSXV, 925 of which were mining companies. Comparatively, the TSX was home to 1,806 companies, with 188 of those being mining companies.
Together the TSX and TSXV host around 40 percent of the world’s public mining companies.
How much does it cost to list on the TSXV?
There are a variety of different fees that companies must pay to list on the TSXV, and according to the exchange, they can vary based on the transaction’s nature and complexity. The listing fee alone will most likely cost between C$10,000 to C$70,000. Accounting and auditing fees could rack up between C$25,000 and C$100,000, while legal fees are expected to be over C$75,000 and an underwriters’ commission may hit up to 12 percent.
The exchange lists a handful of other fees and expenses companies can expect, including but not limited to security commission and transfer agency fees, investor relations costs and director and officer liability insurance.
These are all just for the initial listing, of course. There are ongoing expenses once companies are trading, such as sustaining fees and additional listing fees, plus the costs associated with filing regular reports.
How do you trade on the TSXV?
Investors can trade on the TSXV the way they would trade stocks on any exchange. This means they can use a stock broker or an individual investment account to buy and sell shares of TSXV-listed companies during the exchange's trading hours.
Article by Dean Belder; FAQs by Lauren Kelly.
Don't forget to follow us @INN_Resource for real-time updates!
Securities Disclosure: I, Dean Belder, hold no direct investment interest in any company mentioned in this article.
Securities Disclosure: I, Lauren Kelly, hold no direct investment interest in any company mentioned in this article.
Keep reading...Show less
Latest News
Latest Press Releases
Related News
TOP STOCKS
American Battery4.030.24
Aion Therapeutic0.10-0.01
Cybin Corp2.140.00
Investing News Network websites or approved third-party tools use cookies. Please refer to the cookie policy for collected data, privacy and GDPR compliance. By continuing to browse the site, you agree to our use of cookies.