Far Northern Resources

Geophysical Survey Identify Five IP Anomalies on a Granted Mining Lease.

The Empire IRGS Project in North QLD.

Far Northern Resources Limited ASX (FNR) is pleased to announce that it has successfully completed the Pole Dipole Induced Polarisation (PDIP) geophysical survey covering the Empire Mining Lease (ML20380) in far north Queensland.


Highlights

  • Pole Dipole Induced Polarisation has delineated five new chargeability high anomalies over the Empire North and Empire South on ML20380. (Fig 1)
  • The survey covered 13 lines over 19.7km using 50m & 100 dipole-dipole.
  • The five new anomalies are characterised by high chargeability with associated structurally controlled resistivity low.
  • Targets 1 and 2 appear to be close to surface and structurally controlled with chargeability high over some 400m. (Fig 3 & 4) with Target 1 appearing to dip to the northwest.
  • Target 3,4 & Target 5 appear to be connected on an arcuate structure, some 800m in length. (Fig 5, 6 & 7)
  • This is the first systematic IP survey over the Mining Lease. No part of the 5 anomalies has been drill tested to date.
  • FNR is finalising a drilling plan for mid July 2024.
  • The Mining Lease incorporates two breccia pipes with gold bearing epithermal quartz veins mantling the eastern flank totalling a JORC of 23,000Oz Au.

Empire Mining Lease IP Lines

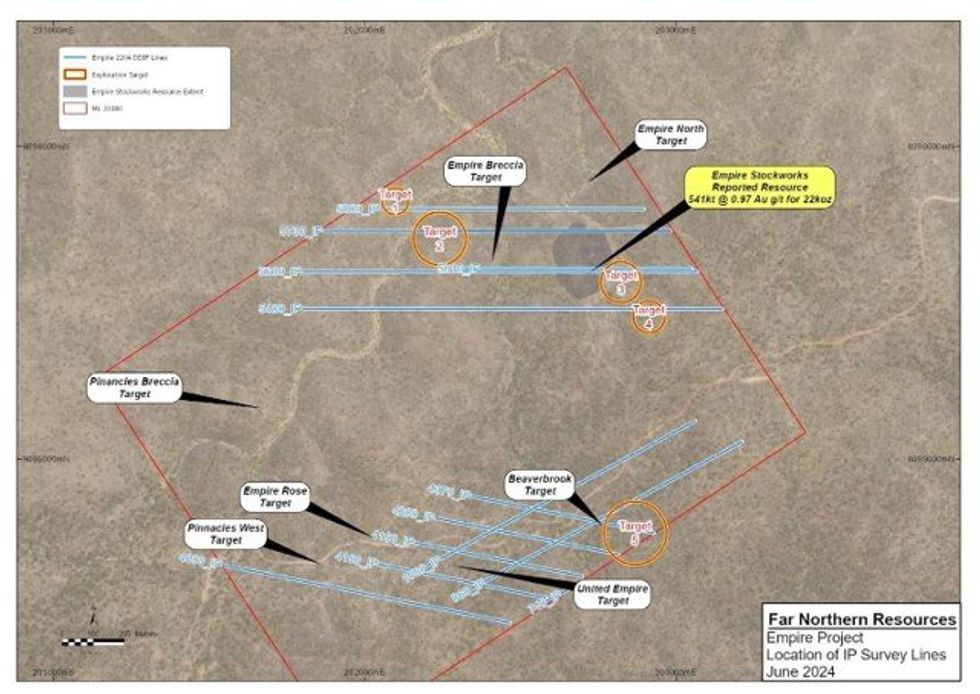
Figure 1: Location of IP survey lines and target areas. Empire

The survey was designed to test first the extent of the porphyry discovered at depth beneath Empire North from the latest drilling by FNR. Secondly, to help delineate the area to the south over the copper gold projects that were highlighted by airborne magnetic survey and the recent rock chips reported in April (ASX Announcement 15/04/2024). The key focus of the PDIP survey was to better define the structural controls of the Mining Lease taking into consideration the magnetic low anomalies, the two breccia pipes and the historic mine shafts and pits at Empire South.

The survey data has confirmed three new large and two smaller chargeability anomalies associated with the magnetics (Fig 2) and has allowed FNR’s technical team to locate and plan new drill targets within the project area ahead of the planned drilling in July this year.


Click here for the full ASX Release

This article includes content from Far Northern Resources, licensed for the purpose of publishing on Investing News Australia. This article does not constitute financial product advice. It is your responsibility to perform proper due diligence before acting upon any information provided here. Please refer to our full disclaimer here.

FNR:AU
The Conversation (0)
Bridge Creek Phase 1 Assays

Bridge Creek Phase 1 Assays

Far Northern Resources (FNR:AU) has announced Bridge Creek Phase 1 AssaysDownload the PDF here. Keep Reading...
Bridge Creek Phase 1 Assay Composites Received

Bridge Creek Phase 1 Assay Composites Received

Far Northern Resources (FNR:AU) has announced Bridge Creek Phase 1 Assay Composites ReceivedDownload the PDF here. Keep Reading...
Quarterly Activities/Appendix 5B Cash Flow Report

Quarterly Activities/Appendix 5B Cash Flow Report

Far Northern Resources (FNR:AU) has announced Quarterly Activities/Appendix 5B Cash Flow ReportDownload the PDF here. Keep Reading...
Drilling to Commence on Bridge Creek Mining Lease

Drilling to Commence on Bridge Creek Mining Lease

Far Northern Resources (FNR:AU) has announced Drilling to Commence on Bridge Creek Mining LeaseDownload the PDF here. Keep Reading...
Amended Appendix 5B

Amended Appendix 5B

Far Northern Resources (FNR:AU) has announced Amended Appendix 5BDownload the PDF here. Keep Reading...
Gold and silver bars in scale with green arrow pointing up. Text reads: "Weekly Editor’s Picks."

Editor's Picks: Gold, Silver Prices Gain Ground, Oil Trades Face Scrutiny

The gold price caught a tailwind this week as tensions between the US and Iran eased, first breaking US$4,600 per ounce and then pushing well above US$4,700.Silver was also on the move, briefly passing US$82 per ounce.The situation in the Middle East remains fluid, but at the time of this... Keep Reading...
Gold bars with financial chart overlay, showcasing market trends.

Top Gold Producers Log Record Q1 Margins Despite Price Swings

Following a chaotic first quarter that saw gold prices shatter the US$5,000 per ounce barrier before suffering a historic collapse, the world’s top gold producers delivered a string of record financial results. The first quarter of 2026 brought severe whiplash to the gold market. Driven by... Keep Reading...
Chris Temple, gold bars.

Chris Temple: Gold's Next Leg Up — Price Trigger, Key Headwinds

Chris Temple, founder, editor and publisher of the National Investor, shares his outlook for the gold price, explaining why it could still fall as low as US$3,500 per ounce. He also discusses what will trigger the yellow metal's next leg higher.Don't forget to follow us @INN_Resource for... Keep Reading...
Mini cart with gold bars on wooden surface, dark background.

WGC: Gold Demand Faces East/West Divide in Q1 2026

A strong gold price and steady demand for safe-haven assets led to record gold demand value in the first quarter of the year, according to the World Gold Council’s (WGC) latest report.The WGC published its latest Gold Demand Trends report on April 29, highlighting that investor and central bank... Keep Reading...
Gold map of the world over black background.

10 Largest Producers of Gold by Country

With gold prices surging to new all-time highs at the start of 2026, the top gold-producing countries are set to benefit significantly from a runaway bull market. After surging more than 80 percent since January 2025, the market's momentum peaked on January 28, when gold reached an all-time high... Keep Reading...

Interactive Chart

Latest Press Releases

Related News