The Conversation (0)

Cardiex Limited (ASX:CDX) leverages its proprietary SphygmoCor® technology to develop and market vascular biomarker technologies and digital solutions focused on the world’s largest health disorders. SphygmoCor®, the company's groundbreaking technology, has set the benchmark for noninvasive measurement of central aortic pressures and related arterial health characteristics, collectively referred to as vascular biomarkers.
The unique physiologic insights from the company’s devices provide clinically relevant information that helps guide treatment decisions and offer profound benefits for all members of the healthcare community:
For Healthcare Providers: Enable physicians to make more informed treatment decisions based on clinically relevant vascular health data.
For Patients: Give patients the tools to make better decisions about their own health.
For Pharmaceutical Companies: Generate reliable, real-world, clinically relevant data to accelerate drug development and commercialization.
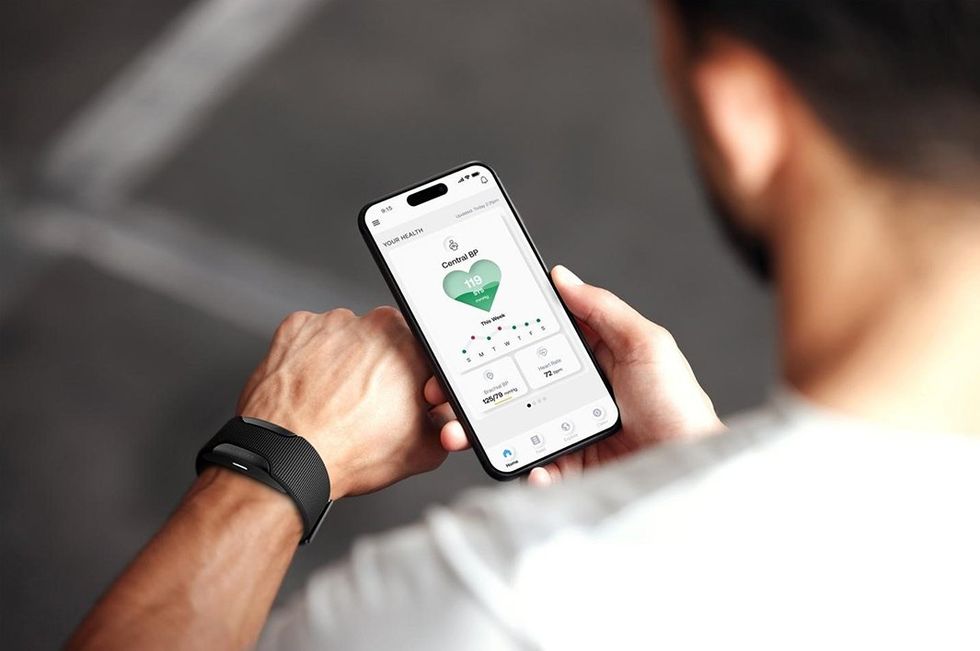
Cardiex’s goal is to establish a holistic ecosystem that promotes cardiovascular well-being and empowers users to proactively manage their health as an integral part of individuals' health routines, contributing to a paradigm shift in preventive cardiovascular care.
The company’s first-mover advantage and exclusive technology FDA-cleared for noninvasive measurement of central pulse pressures and vascular biomarkers across all adult demographics grant it a distinctive market position. CDX recently secured AU$14 million in funding, which is enough to steer the company towards profitability.
This Cardiex profile is part of a paid investor education campaign.*
Click here to connect with Cardiex Limited (ASX:CDX) to receive an Investor Presentation