Silver Tiger Metals Inc. (TSXV:SLVR)(OTCQX:SLVTF) ("Silver Tiger" or the "Company") is pleased to provide an update on the Company's ongoing Pre-Feasibility Study ("PFS") drilling program on the Stockwork gold deposit on its El Tigre Project in Sonora, Mexico. Silver Tiger has completed 23,500 metres of a 25,000 metre drilling program focused on expanding the Mineral Resource, up-grading the classification, completing metallurgical testwork and geotechnical studies as it progresses from an exploration to a development project. The value-added PFS progress is on schedule for publication in H2-2024
Three main areas of the Stockwork gold deposit are being targeted and show potential for expansion: a) the footwall, b) the hanging wall and c) bottom ‘keel'. After releasing the first 75 drill holes of the program, the Company is pleased to announce conversion, expansion and derisking of the potential ‘Starter Stockwork Zone'.
The Stockwork gold deposit, comprised of the Footwall, Hanging Wall and high-grade Keel Zones, is seen in the below highlighted intercepts:
Drill hole ET-23-541: 79.5 metres grading 0.75 g/t gold equivalent or 56.1 g/t silver equivalent from 92.5 to 172.0 metres, consisting of 0.52 g/t gold and 17.4 g/t silver INCLUDING 26.5 metres grading 1.19 g/t gold equivalent or 89.3 g/t silver equivalent from 94.0 to 120.5 metres consisting of 1.08 g/t gold and 8.0 g/t silver in the Hanging Wall Zone.
Drill hole ET-23-543: 40.2 metres grading 1.21 g/t gold equivalent or 90.7 g/t silver equivalent from 148.0 to 188.2 metres, consisting of 0.84 g/t gold and 27.9 g/t silver INCLUDING 23.0 metres grading 1.72 g/t gold equivalent or 129.3 g/t silver equivalent from 152.0 to 175.0 metres consisting of 1.22 g/t gold and 37.9 g/t silver in the Keel Zone.
Drill hole ET-23-548: 71.0 metres grading 0.67 g/t gold equivalent or 50.6 g/t silver equivalent from 0.0 to 71.0 metres, consisting of 0.62 g/t gold and 3.9 g/t silver INCLUDING 18.5 metres grading 1.36 g/t gold equivalent or 101.7 g/t silver equivalent from 39.5 to 58.0 metres consisting of 1.32 g/t gold and 2.4 g/t silver in the Footwall Zone.
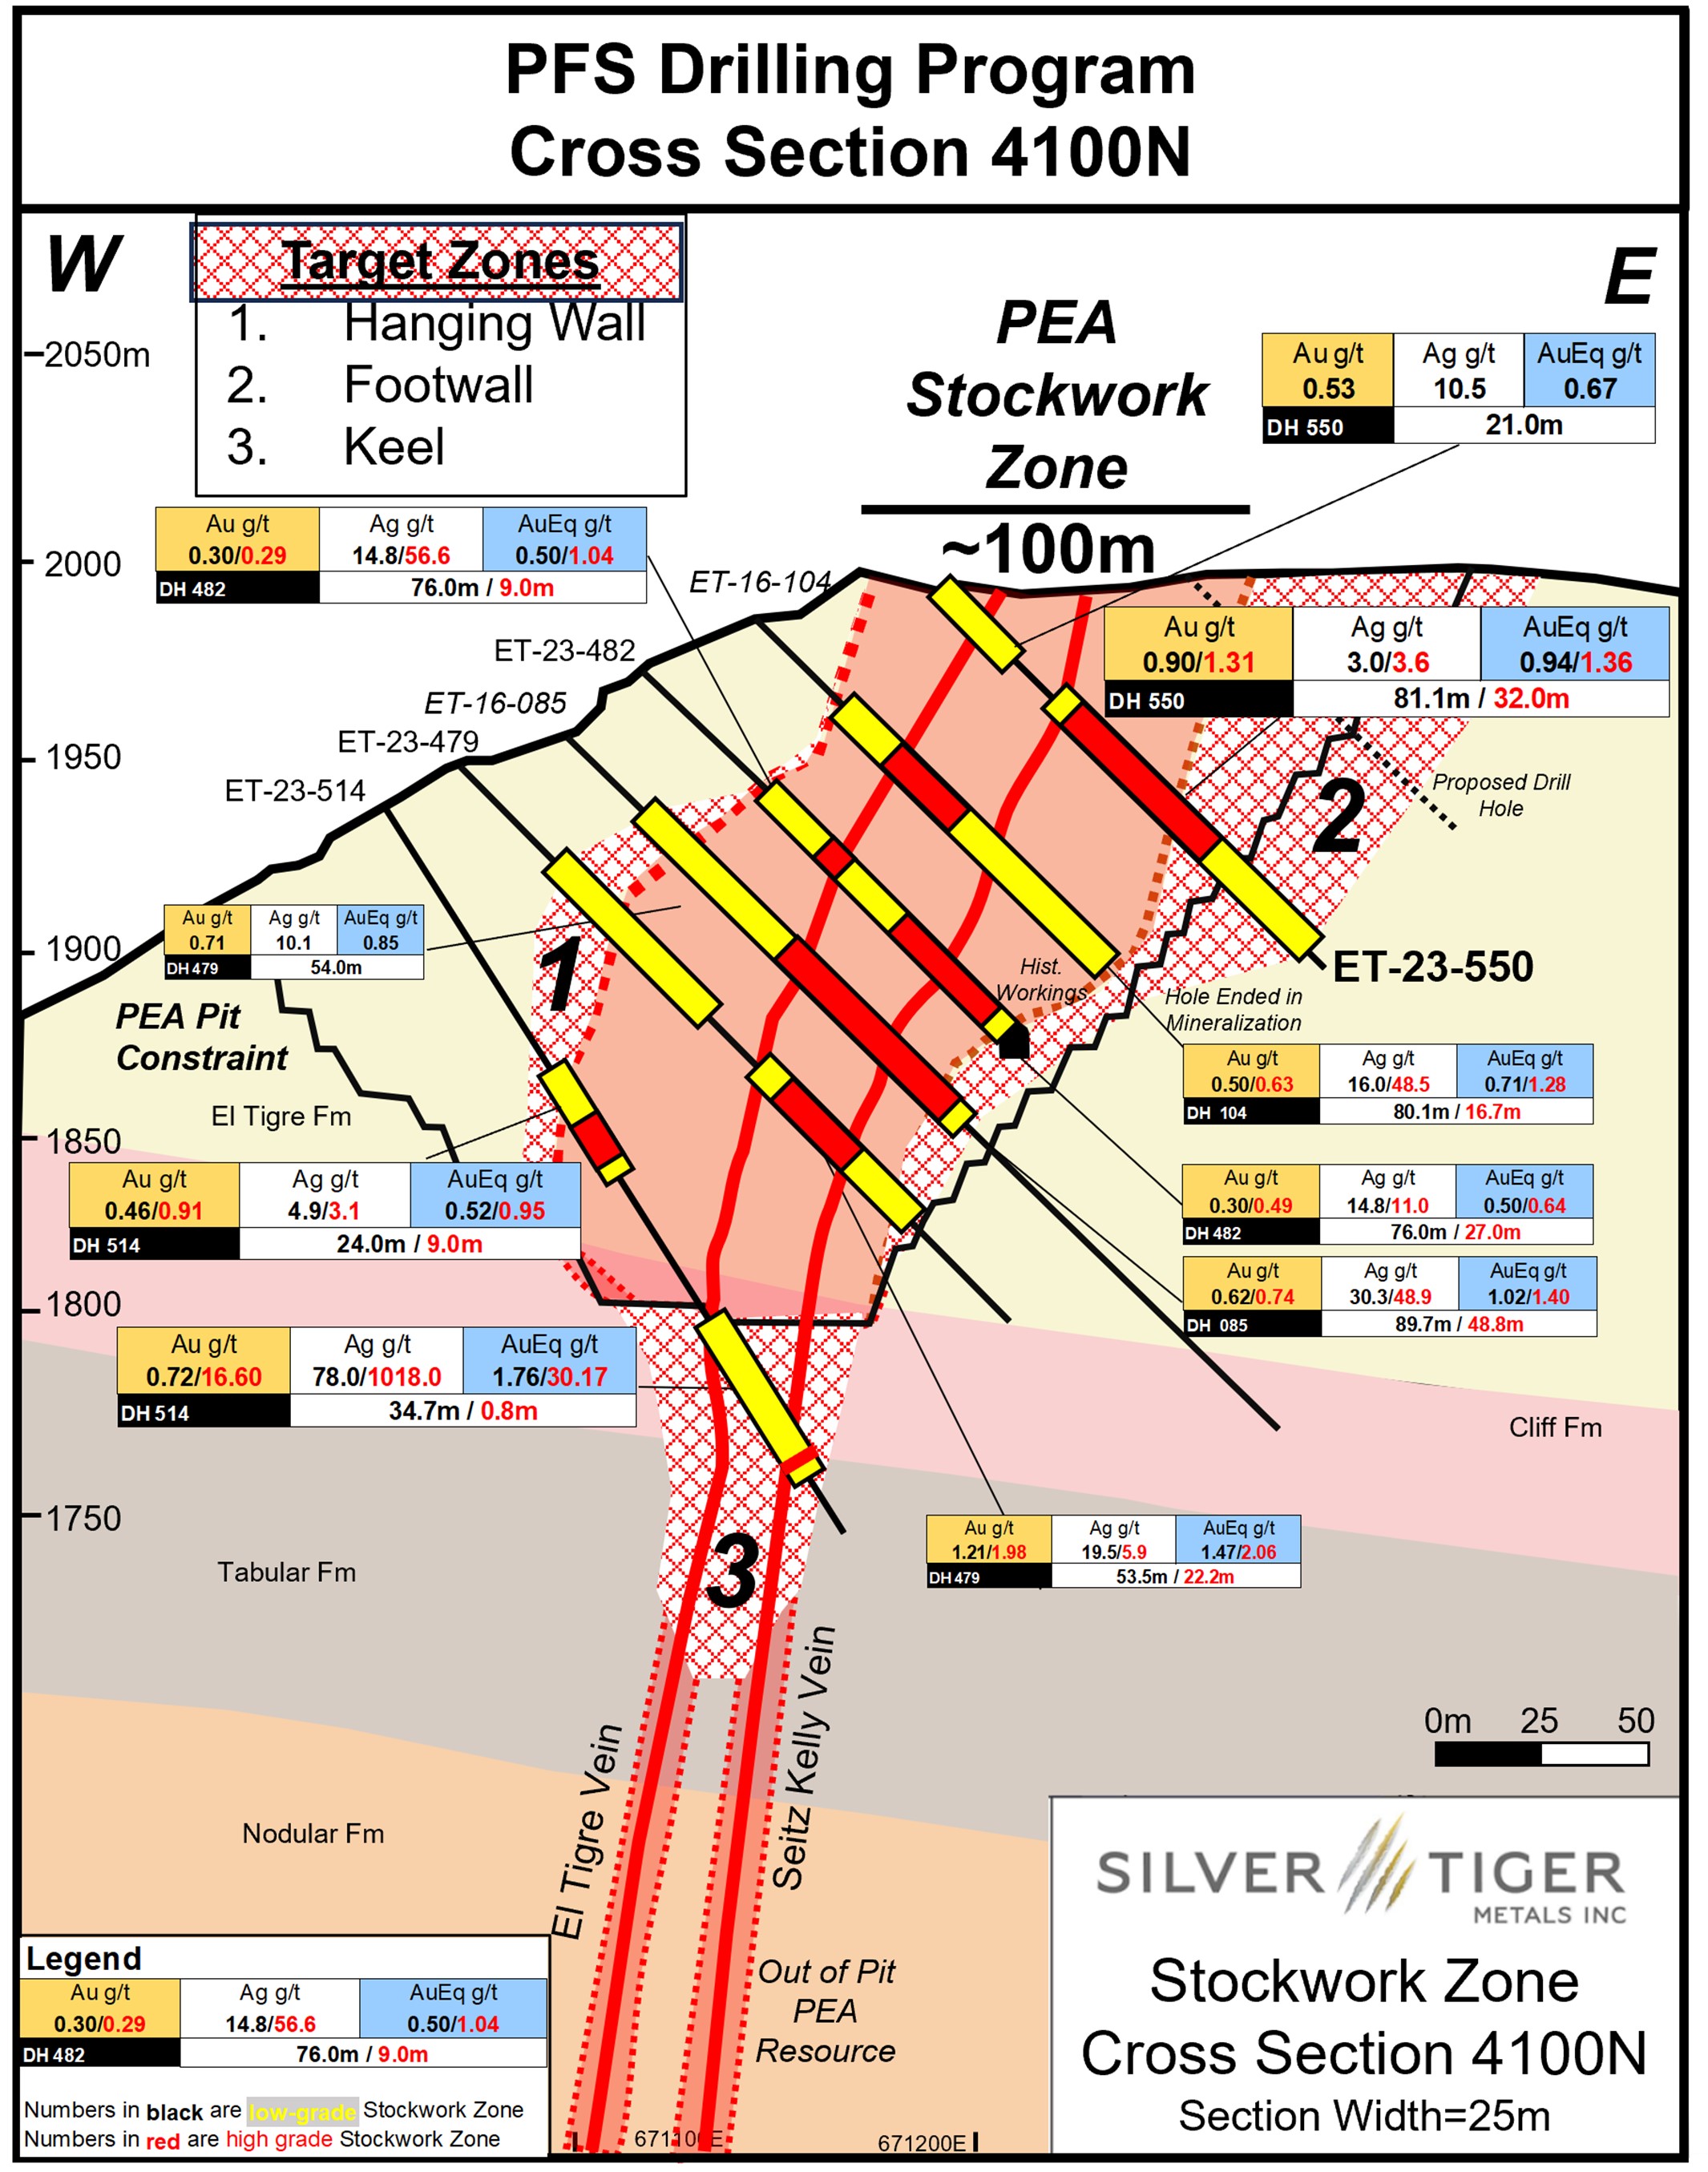
Drill hole ET-23-550: 81.1 metres grading 0.94 g/t gold equivalent or 70.3 g/t silver equivalent from 43.5 to 124.5 metres, consisting of 0.90 g/t gold and 3.0 g/t silver INCLUDING 32.0 metres grading 1.36 g/t gold equivalent or 102.1 g/t silver equivalent from 54.0 to 86.0 metres consisting of 1.31 g/t gold and 3.6 g/t silver in the Footwall Zone (Figure 2) and 21.0 metres grading 0.68 g/t gold equivalent or 50.1 g/t silver equivalent from 0.0 to 21.0 metres, consisting of 0.53 g/t gold and 10.5 g/t silver at the top of the hole.
Silver Tiger's CEO, Glenn Jessome, stated, "As we continue receiving promising assay results, it is apparent that the developing "Footwall" and "Keel Zones" shows excellent grade and continuity." Mr. Jessome further stated, "The results may increase the updated MRE associated with the PFS-level study, as well as further de-risk the project."
Figure 1 : Stockwork Zone - Plan View
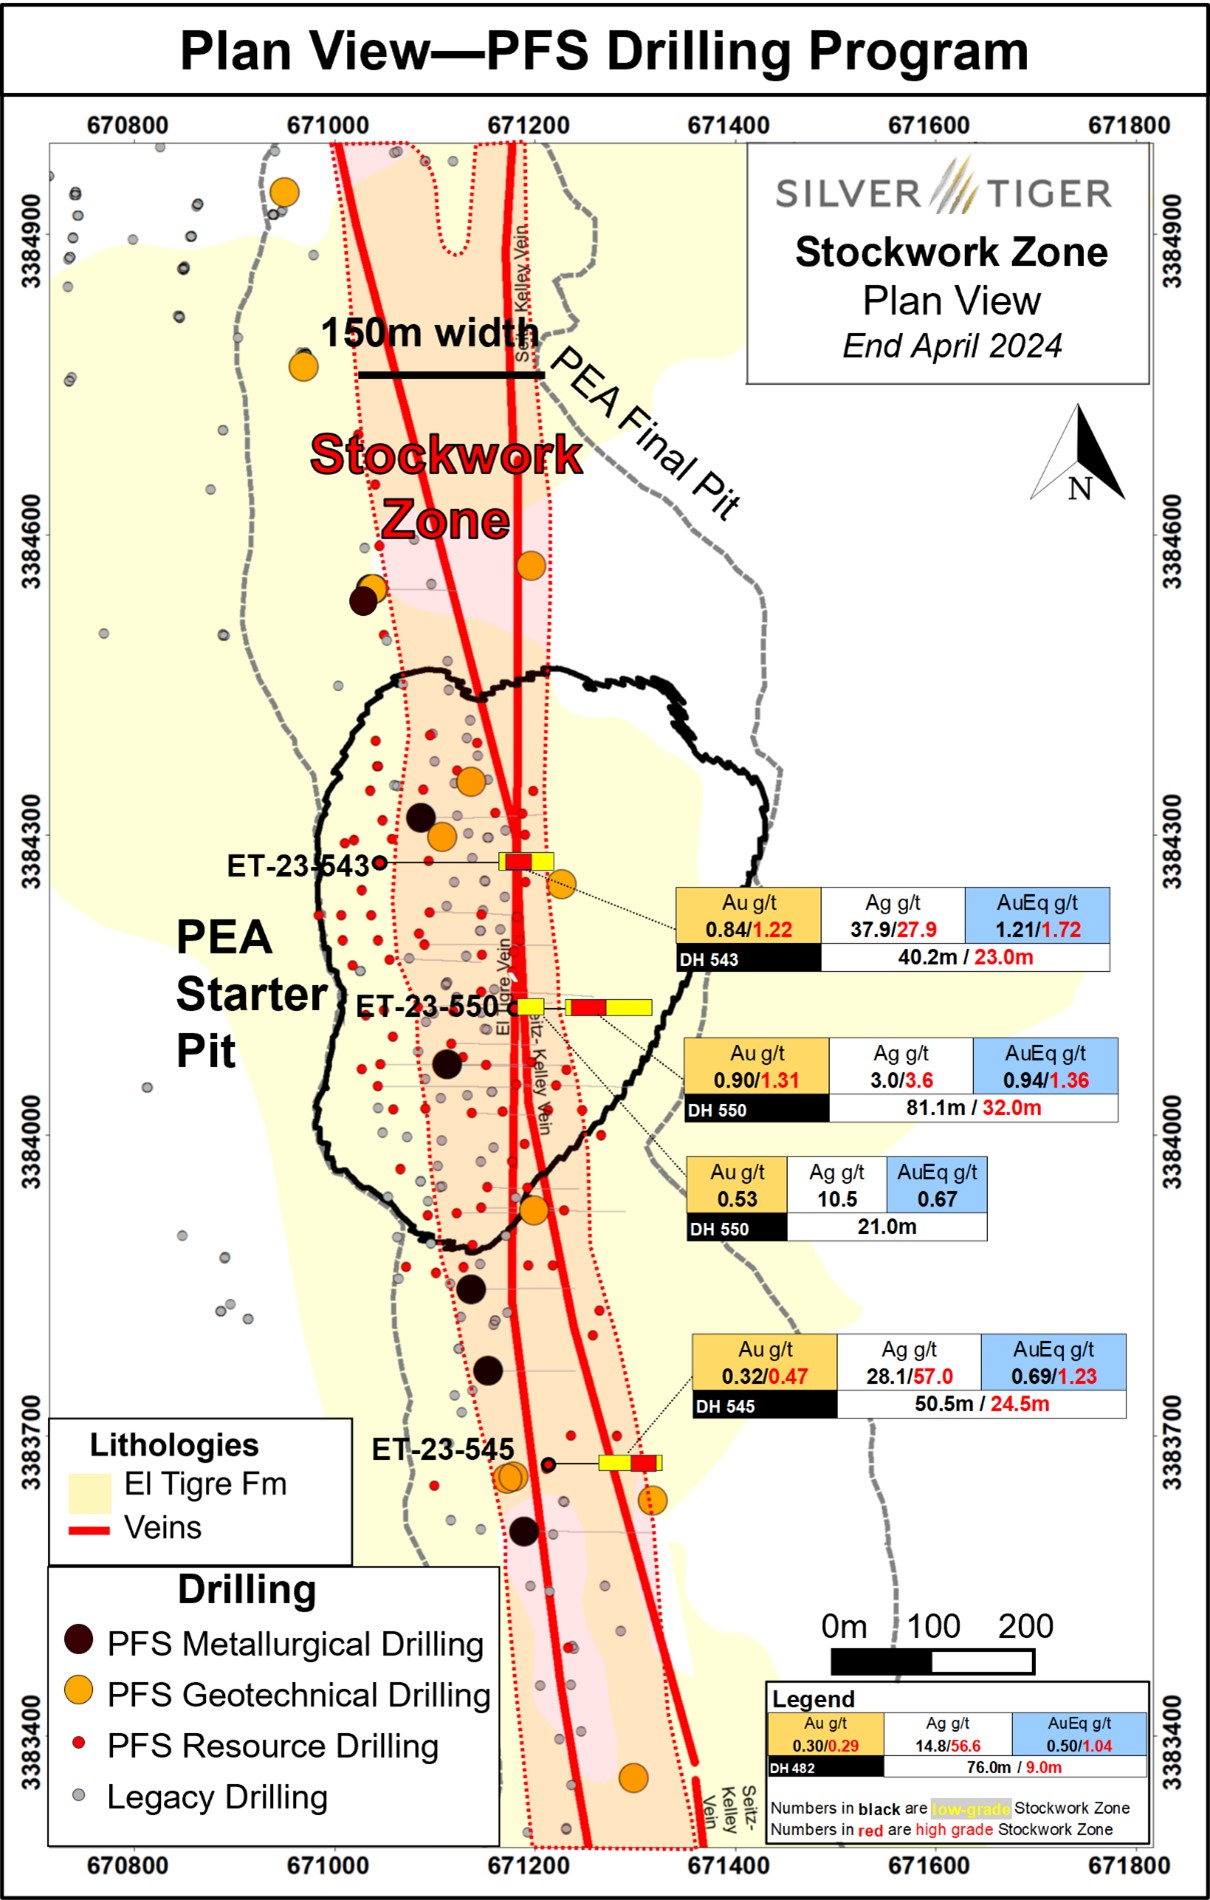
Figure 2: Stockwork Zone Cross Section 4100N
Highlights from the on-going Pre-Feasibility Study Drilling Program include the following:
Expanding known mineralization by 10 to 15%, to the footwall and hanging wall zones, as well as the higher-grade ‘keel' at PEA pit bottom associated with the El Tigre and SK Veins;
Converting first two to three years of mineralized material in the potential ‘Starter Stockwork Zone' from Indicated Mineral Resource to Measured;
Converting a significant portion of the 2 km strike length ‘ultimate' PEA pit-constrained Inferred Mineral Resource to Indicated;
Completion of enhanced PFS Metallurgical Drilling, with samples underway comminution and leach testing; and
Completion of enhanced PFS Geotechnical Drilling, with samples undergoing testing.
Mineral Resource Drilling
P&E Mining Consultants Inc. ("P&E") of Brampton, Ontario completed the initial MRE in 2017. On Oct 27, 2023, P&E released an updated El Tigre Project NI 43-101 and NI 43-01 F1 compliant MRE technical report titled "Technical Report and Updated Mineral Resource Estimate of the El Tigre Silver-Gold Project, Sonora, Mexico" authored by William Stone, Ph.D., P.Geo.,Yungang Wu, P.Geo.,
Fred H. Brown, P.Geo., Jarita Barry, P.Geo., David Burga, P.Geo., D. Grant Feasby, P.Eng., Eugene Puritch, P.Eng., FEC, CET and David Salari, P.Eng. The MRE has a pit-constrained Indicated Mineral Resource totaling 43.0 million tonnes containing 818 thousand ounces AuEq grading 0.59 g/t AuEq; and a pit-constrained Inferred Mineral Resource of 11.5 million tonnes containing 267 thousand ounces AuEq grading 0.72 g/t AuEq (see update MRE press release dated September 12th 2023).
PEA-level bench optimization of the pit-constrained Mineral Resource highlighted the higher-grade (~0.80 gpt AuEq), low strip ratio (~0.3) potential Starter Stockwork Zone which contains 5.7 million tonnes of mineralized material (see PEA press release dated November 1st, 2023). Recommendations of the PEA-level study included increasing Mineral Resource confidence in potential ‘Starter Stockwork Zone' and additional exploratory drilling to target the 1) Footwall, 2) Hanging Wall and 3) ‘Keel' areas of the Stockwork Zone. P&E were again retained to lead the current El Tigre PFS-level study with 23,500 metres of the program complete (Figure 1). Complete and final assay results are listed in Table 1.
Below, highlighted intersections are enumerated with reference to the three (3) zones targeted:
Drill hole ET-23-541: Confirms location and grade of the Hanging Wall Zone, and downhole, expands depth of high-grade Keel Zone (Figure 1);
Drill hole ET-23-543: Expands depth and strike of Keel Zone over the 2023 MRE (Figure 1);
Drill hole ET-23-545: Expands Footwall Zone by 20 m to east over 2023 MRE (Figure 1); and
Drill hole ET-23-550: Expands Footwall Zone by 40 m to east over 2023 MRE (Figure 2).
Table 1-Mineral Resource Drill Hole Results
AuEq Total (2)
AgEq Total (2)
Hole ID
Comment
From
To
Length(1)
Gold
Silver
m
m
m
g/t
g/t
g/t
g/t
ET-23-532
STOCKWORK ZONE
22.0
74.5
52.5
0.48
5.3
0.56
41.7
including
29.5
57.0
27.5
0.73
5.4
0.80
60.1
ET-23-533
STOCKWORK ZONE
30.0
44.0
14.0
0.86
24.0
1.18
88.2
STOCKWORK ZONE
59.7
66.5
6.8
0.36
2.2
0.39
29.3
STOCKWORK ZONE
121.2
144.0
22.9
0.04
28.7
0.42
31.6
including
141.0
144.0
3.0
0.08
102.0
1.44
108.0
ET-23-534
STOCKWORK ZONE
8.4
16.8
8.5
0.14
15.4
0.35
26.2
STOCKWORK ZONE
38.7
57.5
18.9
0.45
2.0
0.47
35.5
ET-23-535
STOCKWORK ZONE
15.5
29.1
13.6
0.85
3.8
0.90
67.6
Mining VOID
29.1
32.2
3.1
*
*
*
*
STOCKWORK ZONE
32.2
50.8
18.6
0.13
7.1
0.23
17.1
STOCKWORK ZONE
56.5
64.0
7.5
0.29
5.0
0.36
27.1
ET-23-536
STOCKWORK ZONE
89.0
99.0
10.0
0.78
3.1
0.82
61.4
STOCKWORK ZONE3
112.3
158.0
45.7
0.38
7.9
0.49
36.4
Mining VOID
144.1
145.5
1.4
*
*
*
*
STOCKWORK ZONE
123.0
133.0
10.0
0.58
8.5
0.70
52.4
STOCKWORK ZONE
197.0
207.0
10.0
0.14
15.7
0.35
26.1
ET-23-537
STOCKWORK ZONE
88.0
90.0
2.0
1.39
2.5
1.42
106.5
STOCKWORK ZONE
101.0
140.0
39.0
0.37
11.8
0.52
39.3
STOCKWORK ZONE
168.0
182.0
14.0
0.30
15.2
0.50
37.7
El Tigre vein
206.0
210.0
4.0
2.93
46.5
3.55
266.6
ET-23-539
STOCKWORK ZONE
0.0
42.7
42.7
0.36
42.9
0.94
70.2
including
22.5
41.2
18.7
0.43
74.8
1.42
106.8
ET-23-540
STOCKWORK ZONE4
128.0
173.0
45.0
0.50
9.1
0.63
46.9
including
158.0
162.5
4.5
0.85
52.1
1.54
115.6
ET-23-541
STOCKWORK ZONE
92.5
172.0
79.5
0.52
17.4
0.75
56.1
including
94.0
120.5
26.5
1.08
8.0
1.19
89.3
Seitz Kelly
187.0
197.2
10.2
0.14
26.8
0.50
37.6
ET-23-543
STOCKWORK ZONE5
148.0
188.2
40.2
0.84
27.9
1.21
90.7
Including
152.0
175.0
23.0
1.22
37.9
1.72
129.3
Mining VOID
183.0
184.7
1.7
*
*
*
*
ET-23-545
STOCKWORK ZONE
74.5
125.0
50.5
0.32
28.1
0.69
52.1
including
87.5
112.0
24.5
0.47
57.0
1.23
92.0
El Tigre vein
93.3
95.1
1.8
2.22
549.4
9.55
715.9
ET-23-547
STOCKWORK ZONE
99.0
117.0
18.0
0.53
1.5
0.55
41.0
STOCKWORK ZONE
132.9
155.0
22.1
0.96
2.6
1.00
74.9
including
143.0
152.0
9.0
1.71
2.3
1.74
130.2
Seitz Kelly
218.0
221.0
3.0
1.48
0.8
1.49
111.4
ET-23-548
STOCKWORK ZONE
0.0
71.0
71.0
0.62
3.9
0.67
50.6
including
39.5
58.0
18.5
1.32
2.4
1.36
101.7
STOCKWORK ZONE
86.3
97.5
11.3
0.68
0.7
0.69
52.0
ET-23-550
STOCKWORK ZONE
0.0
21.0
21.0
0.53
10.5
0.67
50.1
STOCKWORK ZONE
43.5
124.5
81.1
0.90
3.0
0.94
70.3
including
54.0
86.0
32.0
1.31
3.6
1.36
102.1
Notes:
Not true width.
Silver Equivalent ("AgEq") ratios are based on a silver to gold price ratio of 75:1 (Au:Ag).
Excludes 1.40m of Mining void
Excludes 1.70m of Mining void
Excludes 2.00m of Mining void
Table 2-Drill Hole Locations
Hole ID
Easting
Northing
Elevation
Azimuth
Dip
Length
ET-23-532
671,190.4
3,384,252.8
1993.5
90
-44
90.5
ET-23-533
671,071.1
3,383,868.4
1867.9
90
-45
152.0
ET-23-534
671,189.9
3,384,300.6
1989.4
90
-45
96.6
ET-23-535
671,187.3
3,384,321.6
1987.9
90
-45
90.5
ET-23-536
671,044.6
3,384,272.1
1978.6
90
-45
228.0
ET-23-537
671,235.0
3,383,485.4
2014.3
90
-70
291.0
ET-23-539
671,167.4
3,384,023.7
1933.0
90
-45
154.5
ET-23-540
671,043.9
3,384,272.1
1978.5
90
-54
241.0
ET-23-541
671,058.4
3,384,026.1
1925.7
90
-50
215.9
ET-23-543
671,043.6
3,384,271.9
1978.4
90
-61
261.0
ET-23-545
671,211.2
3,383,666.6
2001.0
65
-50
150.0
ET-23-547
671,047.5
3,384,314.8
1983.5
90
-45
221.0
ET-23-548
671,196.8
3,384,073.1
1963.0
90
-45
150.0
ET-23-550
671,180.3
3,384,125.6
2002.6
90
-45
166.5
Figure 3: El Tigre - Conceptual Cross-Section Showing Mineralization Styles
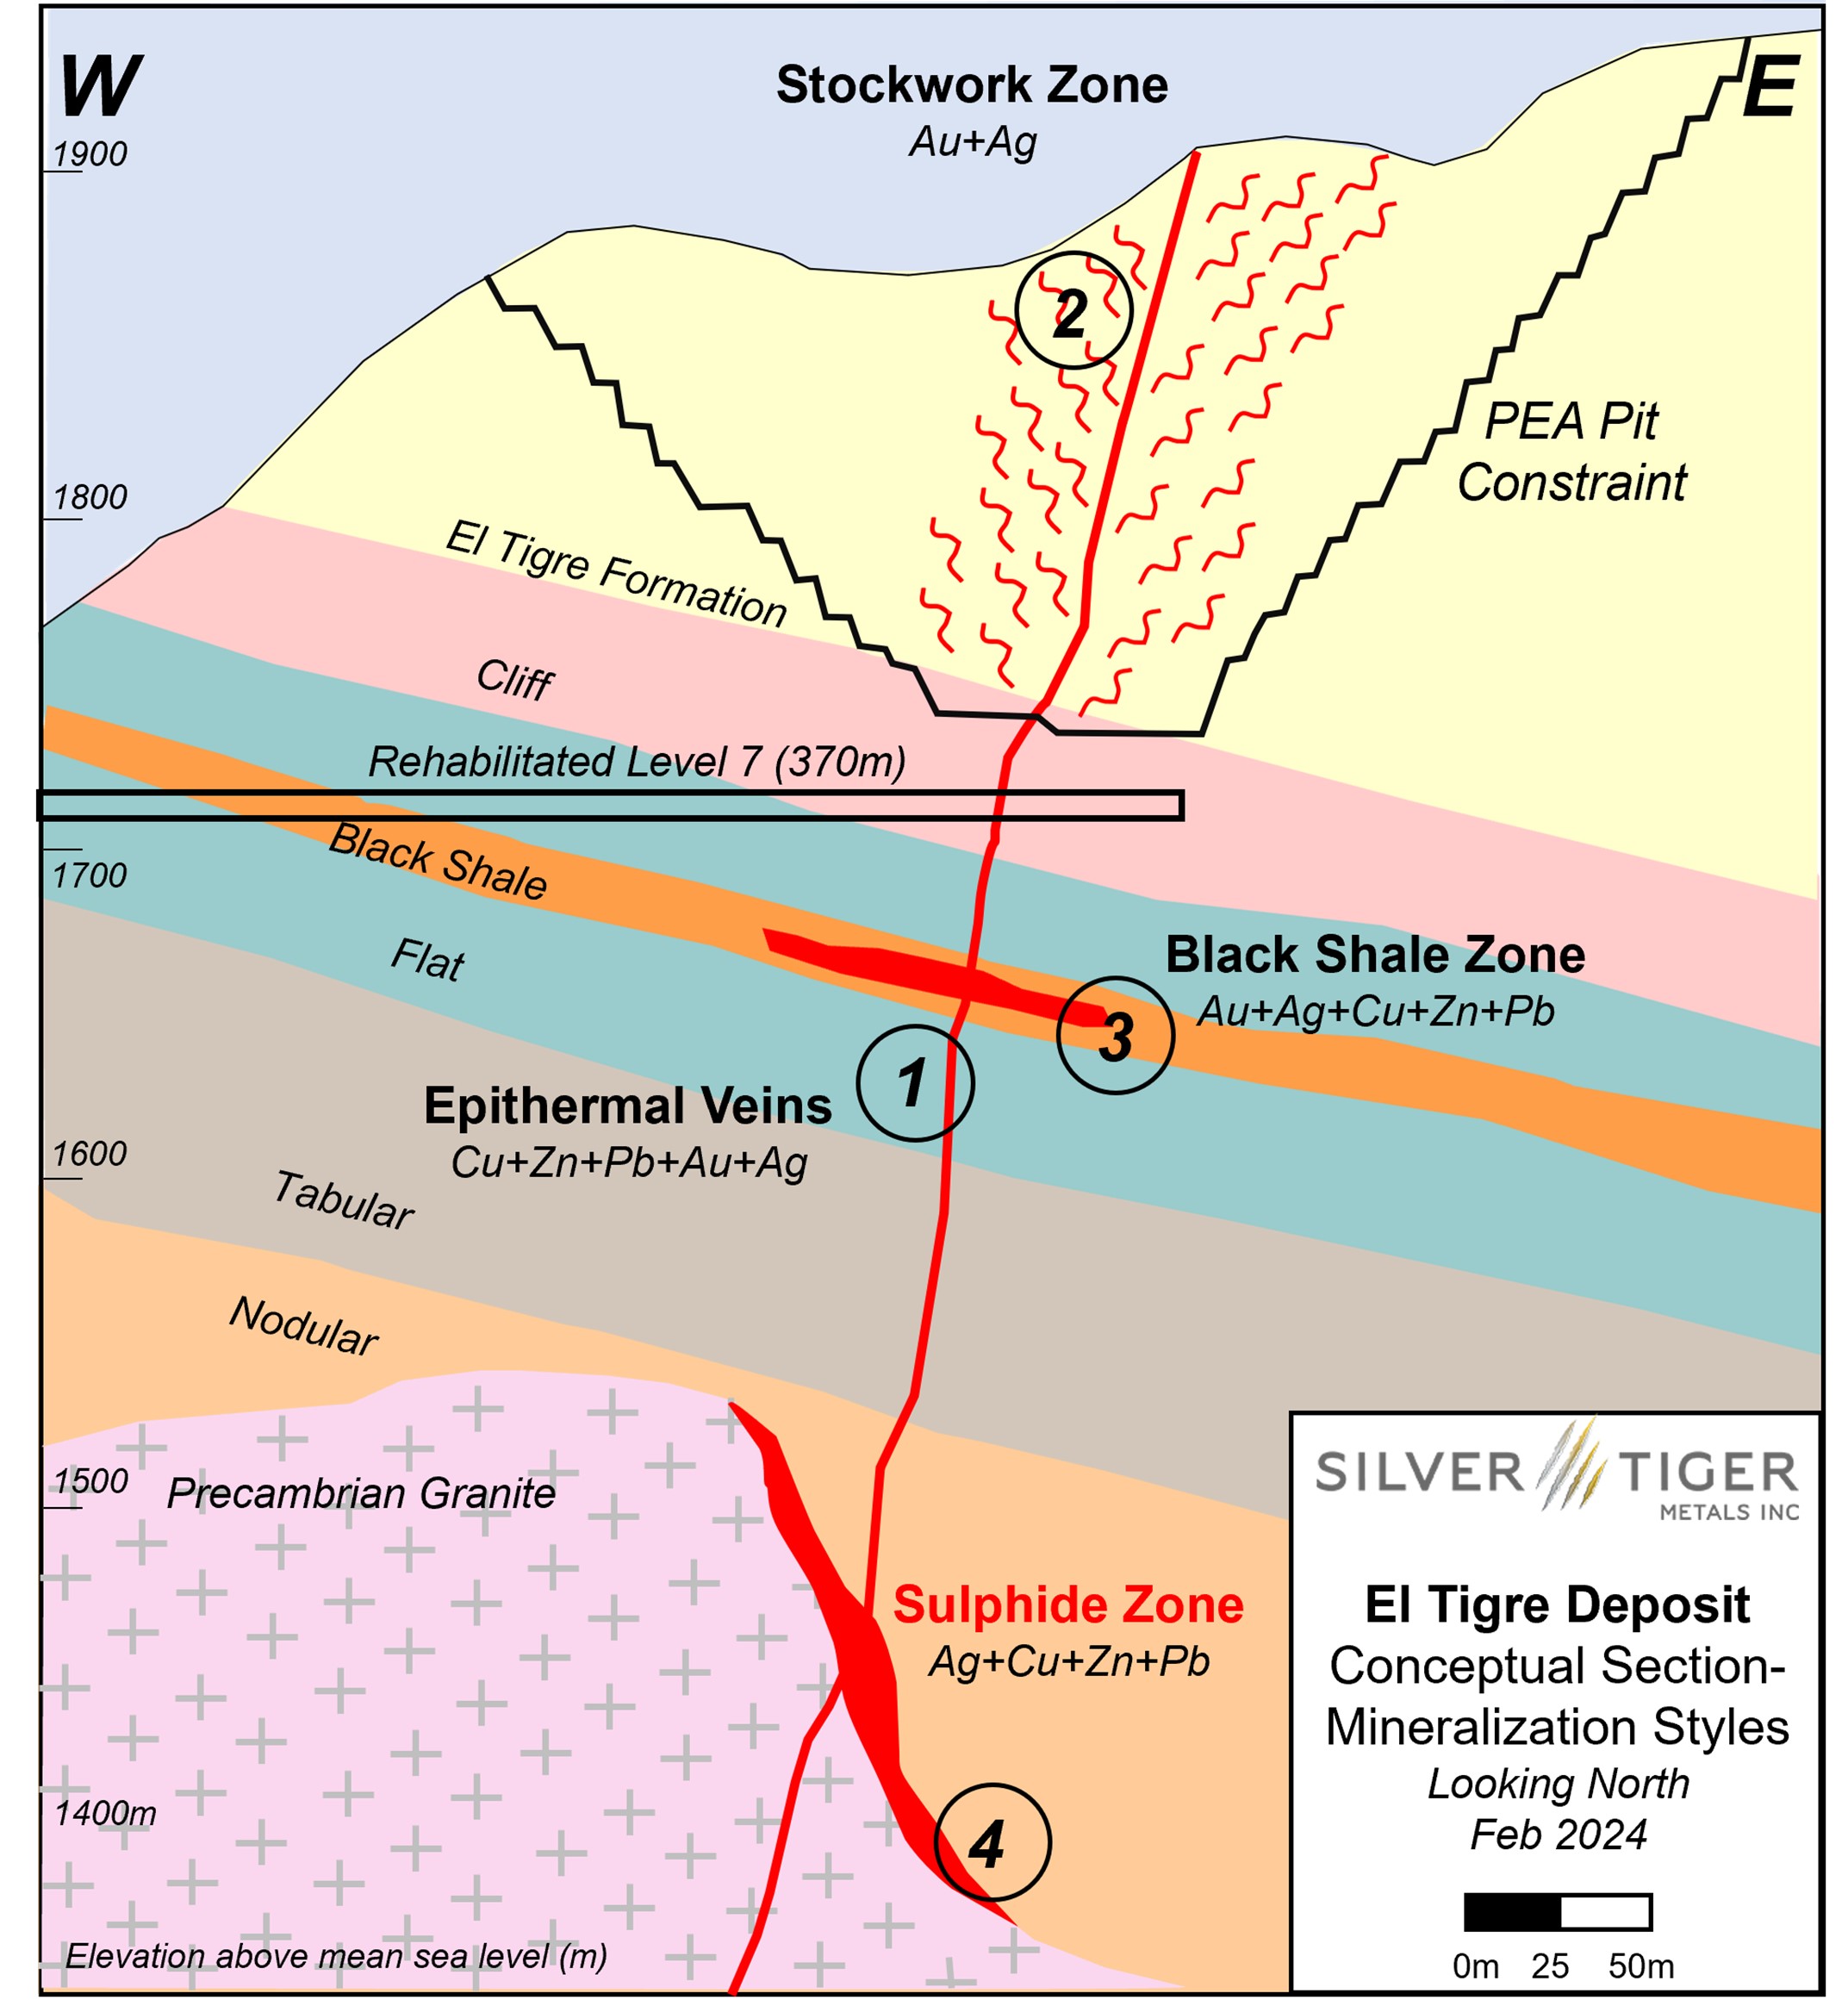
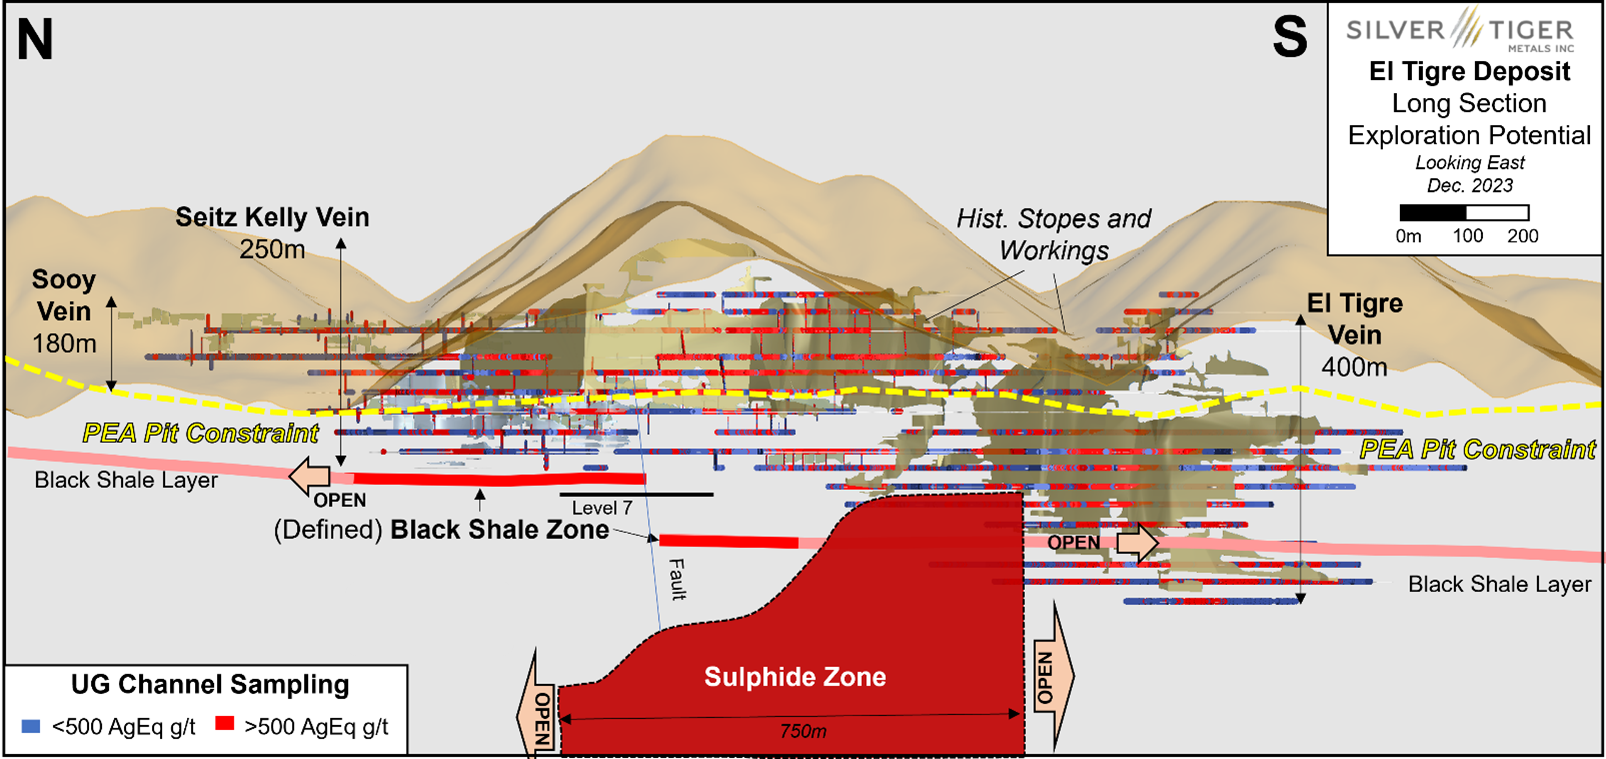
Figure 4: El Tigre-Longitudinal Projection Showing Exploration Potential
About Silver Tiger and the El Tigre Historic Mine District
Silver Tiger Metals Inc. is a Canadian company whose management has more than 25 years' experience discovering, financing and building large hydrothermal silver projects in Mexico. Silver Tiger's 100% owned 28,414 hectare historic El Tigre Mining District is located in Sonora, Mexico. Principled environmental, social and governance practices are core priorities at Silver Tiger.
The El Tigre historic mine district is located in Sonora, Mexico and lies at the northern end of the Sierra Madre silver and gold belt which hosts many epithermal silver and gold deposits, including Dolores, Santa Elena and Las Chispas at the northern end. In 1896, gold was first discovered on the Property in the Gold Hill area and mining started with the Brown Shaft in 1903. The focus soon changed to mining silver veins in the area with production coming from 3 parallel veins the El Tigre Vein, the Seitz Kelley Vein and the Sooy Vein. Underground mining on the middle El Tigre Vein extended 1,450 metres along strike and was mined on 14 levels to a depth of approximately 450 metres. The Seitz Kelley Vein was mined along strike for 1 kilometre to a depth of approximately 200 metres. The Sooy Vein was only mined along strike for 250 metres to a depth of approximately 150 metres. Mining abruptly stopped on all three of these veins when the price of silver collapsed to less than US20¢ per ounce with the onset of the Great Depression. By the time the mine closed in 1930, it is reported to have produced a total of 353,000 ounces of gold and 67.4 million ounces of silver from 1.87 million tons (Craig, 2012). The average grade mined during this period was over 2 kilograms silver equivalent per ton.
The El Tigre silver and gold deposit is related to a series of epithermal veins controlled by a north-south trending structure cutting across the andesitic and rhyolitic tuffs of the Sierra Madre Volcanic Complex within a broad silver and gold mineralized prophylitic alteration zone developed in the El Tigre Formation that can be up to 150 metres wide. The veins dip steeply to the west and are typically 0.5 metre wide; however, locally can be up to 5 metres in width. The veins, structures and mineralized zones outcrop on surface and have been traced for 5.3 kilometres along strike in our brownfield exploration area. Historical mining and exploration activities focused on a 1.6-kilometre portion of the southern end of the deposits, principally on the El Tigre, Seitz Kelly and Sooy veins. The under explored Caleigh, Benjamin, Protectora and the Fundadora exposed veins continue north for more than 3 kilometres. Silver Tiger has delivered its updated NI 43-101 compliant Mineral Resource Estimate and PEA and is currently drilling to update its Mineral Resource Estimate and publish a PFS.
VRIFY Slide Deck and 3D Presentation - Silver Tiger's El Tigre Project
VRIFY is a platform being used by companies to communicate with investors using 360° virtual tours of remote mining assets, 3D models and interactive presentations. VRIFY can be accessed by website and with the VRIFY iOS and Android apps.
Procedure, Quality Assurance / Quality Control and Data Verification
The diamond drill core (HQ size) is geologically logged, photographed and marked for sampling. When the sample lengths are determined, the full drill core is sawn with a diamond blade drill core saw with one half of the drill core being bagged and tagged for assay. The remaining half portion is returned to the drill core trays for storage and/or for metallurgical test work.
The sealed and tagged drill core sample bags are transported to the Bureau Veritas facility in Hermosillo, Mexico. Bureau Veritas crushes the samples (Code PRP70-250) and prepares 200-300 gram pulp samples with ninety percent passing Tyler 200 mesh (Code PUL85). The pulps are assayed for gold using a 30-gram charge by fire assay (Code FA630) and over limits greater than 10 grams per tonne are re-assayed using a gravimetric finish (Code FA530). Silver and multi-element analysis is completed using total digestion (Code MA200 Total Digestion ICP). Over limits greater than 100 grams per tonne silver are re-assayed using a gravimetric finish (Code FA530).
Quality assurance and quality control ("QA/QC") procedures monitor the chain-of-custody of the samples and includes the systematic insertion and monitoring of appropriate reference materials (certified reference materials, blanks and duplicates) into the sample strings. The results of the assaying of the QA/QC material included in each batch are tracked to ensure the integrity of the assay data. All results stated in this announcement have passed Silver Tiger's QA/QC protocols.
Qualified Person
David R. Duncan, P. Geo., V.P. Exploration of the Corporation, is the Qualified Person for Silver Tiger as defined under National Instrument 43-101. Mr. Duncan has reviewed and approved the scientific and technical information in this press release.
Neither TSX Venture Exchange nor its Regulation Services Provider (as that term is defined in the policies of the TSX Venture Exchange) accepts responsibility for the adequacy or accuracy of this release.
This News Release includes certain "forward-looking statements". All statements other than statements of historical fact included in this release, including, without limitation, statements regarding potential mineralization, Mineral Resources and Mineral Reserves, the ability to convert Inferred Resources to Indicated Resources, the ability to complete future drilling programs and infill sampling, the ability to extend Mineral Resource blocks, the similarity of mineralization at El Tigre to Delores, Santa Elena and Chispas, exploration results, and future plans and objectives of Silver Tiger, are forward-looking statements that involve various risks and uncertainties. Forward-looking statements are frequently characterized by words such as "may", "is expected to", "anticipates", "estimates", "intends", "plans", "projection", "could", "vision", "goals", "objective" and "outlook" and other similar words. Although Silver Tiger believes the expectations expressed in such forward-looking statements are based on reasonable assumptions, there can be no assurance that such statements will prove to be accurate and actual results and future events could differ materially from those anticipated in such statements. Important factors that could cause actual results to differ materially from Silver Tiger's expectations include risks and uncertainties related to exploration, development, operations, commodity prices and global financial volatility, risk and uncertainties of operating in a foreign jurisdiction as well as additional risks described from time to time in the filings made by Silver Tiger with securities regulators.
Silver Tiger Metals Inc. (TSXV:SLVR)(OTCQX:SLVTF) ("Silver Tiger" or the "Company") is pleased to provide an update on the first 95 drill holes for the Company's ongoing Pre-Feasibility Study ("PFS") drilling program on the Stockwork deposit on its El Tigre Project in Sonora, Mexico. These new results are highlighting the high-grade mineralization beneath the floor of the 2023 PEA Open Pit in the Keel Zone and expansion of the PEA Starter Pit to the north
Drill hole ET-24-568 cut 16.0 metres grading 875.6 g/t silver equivalent or 11.67 g/t gold equivalent from 155.0 to 171.0 metres, consisting of 409.9 g/t silver and 6.21 g/t gold and INCLUDING 1.0 metres grading 12,851.5 g/t silver equivalent or 171.35 g/t gold equivalent from 161.0 to 162.0 metres consisting of 6,034.0 g/t silver and 90.90 g/t gold and in the Keel Zone (Figures 1 & 2). The hole passed through the El Tigre vein located some 15m beneath the floor of the PEA Open Pit and is referred to as the Keel Zone.
Figure 1 : Stockwork Zone Cross Section 4325N
Figure 2 : Keel Zone - Isometric View
New intersections through the Stockwork deposit, comprised of the Footwall, Hanging Wall and high-grade Keel Zones, are highlighted below, shown on Figure 3 and listed in Table 1.
Drill hole ET-24-570: 59.3 metres grading 1.92 g/t gold equivalent or 144.1 g/t silver equivalent from 100.3 to 159.6 metres, consisting of 1.63 g/t gold and 21.8 g/t silver AND 9.5 metres grading 1.32 g/t gold equivalent or 99.2 g/t silver equivalent from 173.5 to 183.0 metres consisting of 1.32 g/t gold and 0.5 g/t silver. These intersections are located approximately 150 metres past the northern end of the 2023 PEA Starter Pit as shown in Figure 3.
Drill hole ET-23-563: 45.0 metres grading 1.17 g/t gold equivalent or 87.6 g/t silver equivalent from 4.0 to 49.0 metres, consisting of 0.70 g/t gold and 35.0 g/t silver INCLUDING 15.0 metres grading 2.20 g/t gold equivalent or 164.7 g/t silver equivalent from 11.0 to 26.0 metres consisting of 1.01 g/t gold and 89.0 g/t silver gold in both the Hanging Wall and Footwall Zones.
Drill hole ET-23-552: 35.5 metres grading 0.92 g/t gold equivalent or 68.7 g/t silver equivalent from 107.0 to 142.5 metres, consisting of 0.83 g/t gold and 6.2 g/t silver INCLUDING 7.0 metres grading 1.68 g/t gold equivalent or 126.3 g/t silver equivalent from 135.5 to 142.5 metres consisting of 1.66 g/t gold and 1.9 g/t silver in the Hanging Wall Zone.
Silver Tiger's CEO, Glenn Jessome, stated, "As we continue receiving promising assay results, it is apparent that the developing "Starter Pit" and "Keel Zone" show excellent grade and continuity." Mr. Jessome further stated, "The results may increase the updated MRE associated with the PFS-level study which we expect to deliver by September 2024, which will also further de-risk the project." Mr. Jessome continued, "We contemplate being able to make a build decision based on our upcoming PFS."
Silver Tiger has completed 24,500 metres of a 25,000 metre drilling program focused on expanding the Mineral Resource, up-grading the classification, completing metallurgical testwork and geotechnical studies as it progresses from an exploration to a development project. The value-added PFS progress is on schedule for publication in H2-2024.
Figure 3 : Stockwork Zone - Plan View
Highlights from the on-going Pre-Feasibility Study Drilling Program include the following:
Expanding known mineralization by 10 to 15%, to the footwall and hanging wall zones, as well as the higher-grade ‘Keel' at PEA pit bottom associated with the El Tigre and SK Veins;
Converting first two to three years of mineralized material in the potential ‘Starter Stockwork Zone' from Indicated Mineral Resource to Measured;
Converting a significant portion of the 2 km strike length ‘ultimate' PEA pit-constrained Inferred Mineral Resource to Indicated;
Completion of enhanced PFS Metallurgical Drilling, with samples underway comminution and leach testing; and
Completion of enhanced PFS Geotechnical Drilling, with samples undergoing testing.
Mineral Resource Drilling
P&E Mining Consultants Inc. ("P&E") of Brampton, Ontario completed the initial MRE in 2017. On Oct 27, 2023, P&E released an updated El Tigre Project NI 43-101 and NI 43-01 F1 compliant MRE technical report titled "Technical Report and Updated Mineral Resource Estimate of the El Tigre Silver-Gold Project, Sonora, Mexico" authored by William Stone, Ph.D., P.Geo.,Yungang Wu, P.Geo., Fred H. Brown, P.Geo., Jarita Barry, P.Geo., David Burga, P.Geo., D. Grant Feasby, P.Eng., Eugene Puritch, P.Eng., FEC, CET and David Salari, P.Eng. The MRE has a pit-constrained Indicated Mineral Resource totaling 43.0 million tonnes containing 818 thousand ounces AuEq grading 0.59 g/t AuEq; and a pit-constrained Inferred Mineral Resource of 11.5 million tonnes containing 267 thousand ounces AuEq grading 0.72 g/t AuEq (see update MRE press release dated September 12th 2023).
PEA-level bench optimization of the pit-constrained Mineral Resource highlighted the higher-grade (~0.80 gpt AuEq), low strip ratio (~0.3) potential Starter Stockwork Zone which contains 5.7 million tonnes of mineralized material (see PEA press release dated November 1st, 2023). Recommendations of the PEA-level study included increasing Mineral Resource confidence in potential ‘Starter Stockwork Zone' and additional exploratory drilling to target the 1) Footwall, 2) Hanging Wall and 3) ‘Keel' areas of the Stockwork Zone. P&E were again retained to lead the current El Tigre PFS-level study with 24,500 metres of the program completed as of May 15, 2024 . Complete and final assay results are listed in Table 1.
Below, highlighted intersections are enumerated with reference to the three (3) zones targeted (Figure 2):
Drill hole ET-23-563: Confirms location and grade of the Hanging Wall Zone, and downhole, the Footwall Zone, and high-grade SK vein;
Drill hole ET-23-552: Confirms location and grade of the Hanging Wall Zone, and downhole, expands the Footwall Zone 25m to the east over 2023 MRE;
Drill hole ET-24-568: Expands depth and strike of Keel Zone over the 2023 MRE; and
Drill hole ET-24-570: Confirms location and grade of the Hanging Wall Zone associated with El Tigre Vein.
Table 1-Mineral Resource Drill Hole Results
AuEq Total (2)
AgEq Total (2)
Hole ID
Comment
From
To
Length(1)
Gold
Silver
m
m
m
g/t
g/t
g/t
g/t
ET-23-552
STOCKWORK ZONE3
107.0
142.5
35.5
0.83
6.2
0.92
68.7
Mining VOID
121.7
123.8
2.1
*
*
*
*
including
135.5
142.5
7.0
1.66
1.9
1.68
126.3
STOCKWORK ZONE
156.5
176.0
19.5
0.44
0.5
0.45
33.4
ET-23-553
STOCKWORK ZONE
85.5
97.0
11.5
0.32
0.6
0.33
24.4
STOCKWORK ZONE
131.0
155.0
24.0
0.42
1.4
0.44
33.1
including
183.0
201.0
18.0
0.22
172.4
2.52
189.1
ET-23-554
STOCKWORK ZONE4
138.0
183.0
45.0
0.52
3.9
0.57
42.6
including
159.0
171.0
12.0
0.88
5.9
0.96
72.0
Mining VOID
171.0
174.0
3.0
*
*
*
*
STOCKWORK ZONE
219.6
235.6
16.0
0.91
4.3
0.97
72.5
ET-23-557
STOCKWORK ZONE
24.0
32.0
8.0
0.48
3.3
0.52
39.3
STOCKWORK ZONE
113.0
125.0
12.0
0.37
1.2
0.39
29.1
STOCKWORK ZONE
148.0
179.0
31.0
0.33
11.8
0.48
36.3
including
173.0
178.0
5.0
0.63
40.4
1.17
87.8
ET-23-558
STOCKWORK ZONE
108.5
141.0
32.5
0.72
1.7
0.75
56.0
including
116.5
134.0
17.5
1.04
1.9
1.07
80.1
El Tigre HW
162.1
163.0
0.9
0.20
224.0
3.19
239.1
Mining VOID
163.0
165.0
2.0
*
*
*
*
El Tigre FW
165.0
165.9
0.9
0.22
362.0
5.05
378.5
STOCKWORK ZONE
181.0
207.0
26.0
0.17
13.6
0.35
26.3
ET-23-560
STOCKWORK ZONE
153.0
157.0
4.0
1.40
7.9
1.50
112.7
STOCKWORK ZONE
164.9
168.0
3.1
0.94
1.4
0.96
72.0
STOCKWORK ZONE5
205.5
225.0
19.5
0.36
4.1
0.41
30.9
including
211.5
216.5
5.0
0.63
6.0
0.71
53.0
Mining VOID
221.2
223.2
2.0
*
*
*
*
ET-23-563
STOCKWORK ZONE
4.0
49.0
45.0
0.70
35.0
1.17
87.6
including
11.0
26.0
15.0
1.01
89.0
2.20
164.7
including
24.0
26.0
2.0
1.43
634.0
9.89
741.5
STOCKWORK ZONE
64.0
70.0
6.0
0.68
2.0
0.71
53.1
ET-24-564
STOCKWORK ZONE
15.0
40.5
25.5
1.30
24.3
1.63
122.1
including
16.0
24.0
8.0
2.76
71.4
3.71
278.4
STOCKWORK ZONE
73.9
99.0
25.1
0.18
2.3
0.22
16.2
ET-24-565
STOCKWORK ZONE
103.0
150.9
47.9
0.32
1.9
0.35
26.0
STOCKWORK ZONE
182.0
190.0
8.0
0.33
1.3
0.34
25.7
STOCKWORK ZONE
204.0
225.0
21.0
0.84
3.7
0.88
66.4
including
219.0
225.0
6.0
1.94
7.8
2.04
153.4
ET-24-566
STOCKWORK ZONE
12.0
43.5
31.5
0.39
12.5
0.56
41.9
including
18.0
31.5
13.5
0.60
13.8
0.79
59.0
STOCKWORK ZONE
112.0
121.5
9.5
1.02
0.6
1.03
76.9
ET-24-567
STOCKWORK ZONE6
31.5
106.5
75.0
0.35
16.6
0.57
43.0
including6
80.0
92.0
12.0
0.51
70.8
1.46
109.1
ET-24-568
KEEL ZONE
155.0
171.0
16.0
6.21
409.9
11.67
875.6
including
161.0
162.0
1.0
90.90
6034.0
171.35
12851.5
ET-24-569
STOCKWORK ZONE
71.4
111.7
40.3
0.36
24.0
0.68
51.2
including
71.4
83.0
11.6
0.57
78.4
1.61
121.1
ET-24-570
STOCKWORK ZONE
100.3
159.6
59.3
1.63
21.8
1.92
144.1
Mining VOID
168.0
173.5
5.5
*
*
*
*
STOCKWORK ZONE
173.5
183.0
9.5
1.32
0.5
1.32
99.2
Notes:
Not true width.
SilverEquivalent ("AgEq") ratiosare based on a silverto gold priceratio of 75:1 (Au:Ag).
Excludes 2.1m of Mining void
Excludes 3.0m of Mining void
Excludes 2.0m of Mining void
Excludes 1.1m of Mining void
Table 2-Drill Hole Locations
Hole ID
Easting
Northing
Elevation
Azimuth
Dip
Length
ET-23-552
671,057.8
3,384,293.5
1976.5
90
-45
191.0
ET-23-553
671,020.6
3,384,046.9
1937.5
90
-45
220.0
ET-23-554
671,014.1
3,384,293.7
1985.2
90
-45
276.0
ET-23-557
671,047.4
3,384,494.1
2070.0
90
-65
230.8
ET-23-558
671,031.0
3,384,121.0
1920.9
90
-45
222.0
ET-23-560
671,046.9
3,384,493.9
2070.0
90
-80
261.0
ET-23-563
671,201.7
3,383,902.6
1903.7
90
-45
90.0
ET-24-564
671,212.7
3,384,050.0
1944.7
90
-47
117.0
ET-24-565
671,223.4
3,383,425.5
1977.2
90
-45
253.5
ET-24-566
671,211.0
3,384,093.9
1977.8
90
-45
140.0
ET-24-567
671,093.5
3,384,273.4
1965.7
90
-48
150.0
ET-24-568
671,046.7
3,384,314.9
1983.4
90
-60
258.0
ET-24-569
671,307.9
3,383,304.6
1917.9
90
-50
175.5
ET-24-570
671,044.5
3,384,587.4
2099.3
90
-70
200.4
Note: Holes ET-23-551, 555, 556, 559, 561, and 562 are geotechnical holes with assays pending
Figure 4: El Tigre - Conceptual Cross-Section Showing Mineralization Styles
Figure 5: El Tigre-Longitudinal Projection Showing Exploration Potential
About Silver Tiger and the El Tigre Historic Mine District
Silver Tiger Metals Inc. is a Canadian company whose management has more than 25 years' experience discovering, financing and building large hydrothermal silver projects in Mexico. Silver Tiger's 100% owned 28,414 hectare historic El Tigre Mining District is located in Sonora, Mexico. Principled environmental, social and governance practices are core priorities at Silver Tiger.
The El Tigre historic mine district is located in Sonora, Mexico and lies at the northern end of the Sierra Madre silver and gold belt which hosts many epithermal silver and gold deposits, including Dolores, Santa Elena and Las Chispas at the northern end. In 1896, gold was first discovered on the Property in the Gold Hill area and mining started with the Brown Shaft in 1903. The focus soon changed to mining silver veins in the area with production coming from 3 parallel veins the El Tigre Vein, the Seitz Kelley Vein and the Sooy Vein. Underground mining on the middle El Tigre Vein extended 1,450 metres along strike and was mined on 14 levels to a depth of approximately 450 metres. The Seitz Kelley Vein was mined along strike for 1 kilometre to a depth of approximately 200 metres. The Sooy Vein was only mined along strike for 250 metres to a depth of approximately 150 metres. Mining abruptly stopped on all three of these veins when the price of silver collapsed to less than US20¢ per ounce with the onset of the Great Depression. By the time the mine closed in 1930, it is reported to have produced a total of 353,000 ounces of gold and 67.4 million ounces of silver from 1.87 million tons (Craig, 2012). The average grade mined during this period was over 2 kilograms silver equivalent per ton.
The El Tigre silver and gold deposit is related to a series of epithermal veins controlled by a north-south trending structure cutting across the andesitic and rhyolitic tuffs of the Sierra Madre Volcanic Complex within a broad silver and gold mineralized prophylitic alteration zone developed in the El Tigre Formation that can be up to 150 metres wide. The veins dip steeply to the west and are typically 0.5 metre wide; however, locally can be up to 5 metres in width. The veins, structures and mineralized zones outcrop on surface and have been traced for 5.3 kilometres along strike in our brownfield exploration area. Historical mining and exploration activities focused on a 1.6-kilometre portion of the southern end of the deposits, principally on the El Tigre, Seitz Kelly and Sooy veins. The under explored Caleigh, Benjamin, Protectora and the Fundadora exposed veins continue north for more than 3 kilometres. Silver Tiger has delivered its updated NI 43-101 compliant Mineral Resource Estimate and PEA and is currently drilling to update its Mineral Resource Estimate and publish a PFS.
VRIFY Slide Deck and 3D Presentation - Silver Tiger's El Tigre Project
VRIFY is a platform being used by companies to communicate with investors using 360° virtual tours of remote mining assets, 3D models and interactive presentations. VRIFY can be accessed by website and with the VRIFY iOS and Android apps.
Procedure, Quality Assurance / Quality Control and Data Verification
The diamond drill core (HQ size) is geologically logged, photographed and marked for sampling. When the sample lengths are determined, the full drill core is sawn with a diamond blade drill core saw with one half of the drill core being bagged and tagged for assay. The remaining half portion is returned to the drill core trays for storage and/or for metallurgical test work.
The sealed and tagged drill core sample bags are transported to the Bureau Veritas facility in Hermosillo, Mexico. Bureau Veritas crushes the samples (Code PRP70-250) and prepares 200-300 gram pulp samples with ninety percent passing Tyler 200 mesh (Code PUL85). The pulps are assayed for gold using a 30-gram charge by fire assay (Code FA630) and over limits greater than 10 grams per tonne are re-assayed using a gravimetric finish (Code FA530). Silver and multi-element analysis is completed using total digestion (Code MA200 Total Digestion ICP). Over limits greater than 100 grams per tonne silver are re-assayed using a gravimetric finish (Code FA530).
Quality assurance and quality control ("QA/QC") procedures monitor the chain-of-custody of the samples and includes the systematic insertion and monitoring of appropriate reference materials (certified reference materials, blanks and duplicates) into the sample strings. The results of the assaying of the QA/QC material included in each batch are tracked to ensure the integrity of the assay data. All results stated in this announcement have passed Silver Tiger's QA/QC protocols.
Qualified Person
David R. Duncan, P. Geo., V.P. Exploration of the Corporation, is the Qualified Person for Silver Tiger as defined under National Instrument 43-101. Mr. Duncan has reviewed and approved the scientific and technical information in this press release.
Neither TSX Venture Exchange nor its Regulation Services Provider (as that term is defined in the policies of the TSX Venture Exchange) accepts responsibility for the adequacy or accuracy of this release.
This News Release includes certain "forward-looking statements". All statements other than statements of historical fact included in this release, including, without limitation, statements regarding potential mineralization, Mineral Resources and Mineral Reserves, the ability to convert Inferred Resources to Indicated Resources, the ability to complete future drilling programs and infill sampling, the ability to extend Mineral Resource blocks, the similarity of mineralization at El Tigre to Delores, Santa Elena and Chispas, exploration results, and future plans and objectives of Silver Tiger, are forward-looking statements that involve various risks and uncertainties. Forward-looking statements are frequently characterized by words such as "may", "is expected to", "anticipates", "estimates", "intends", "plans", "projection", "could", "vision", "goals", "objective" and "outlook" and other similar words. Although Silver Tiger believes the expectations expressed in such forward-looking statements are based on reasonable assumptions, there can be no assurance that such statements will prove to be accurate and actual results and future events could differ materially from those anticipated in such statements. Important factors that could cause actual results to differ materially from Silver Tiger's expectations include risks and uncertainties related to exploration, development, operations, commodity prices and global financial volatility, risk and uncertainties of operating in a foreign jurisdiction as well as additional risks described from time to time in the filings made by Silver Tiger with securities regulators.
Silver Tiger Metals Inc. (TSXV:SLVR) and (OTCQX:SLVTF) ("Silver Tiger" or the "Company") is pleased to provide an update on the Company's ongoing Pre-Feasibility Study ("PFS") drilling program on the Stockwork gold deposit on its El Tigre Project in Sonora, Mexico. Silver Tiger has completed 23,000 metres of a 25,000 metre drilling program focused on expanding the Mineral Resource, up-grading the classification, completing metallurgical test work and geotechnical studies as it progresses from an exploration to a development project. The value-added PFS progress is on schedule for publication in H2-2024
Three main areas of the Stockwork gold deposit are being targeted and show potential for expansion: a) the footwall, b) the hanging wall and c) bottom ‘keel'. After releasing the first 55 drill holes of the program, the Company is pleased to announce conversion, expansion and derisking of the potential ‘Starter Stockwork Zone'.
Silver Tiger's CEO, Glenn Jessome, stated, "We are pleased this new set of assay results continue to both confirm and expand the near-surface Stockwork gold deposit. Of particular interest is the developing "Footwall Zone" to east that continues to show grade and continuity while expanding the mineralization footprint." Mr. Jessome further stated, "These promising assay results help to further de-risk the project in conjunction with the underway PFS-level geotechnical and metallurgical studies."
In the northern area of the PEA "starter pit", several new intersections in the footwall side of the Stockwork gold deposit are shown below in the highlighted intercepts:
Drill hole ET-23-527: 74.0 metres grading 0.78 g/t gold equivalent or 58.5 g/t silver equivalent from 0.0 to 74.0 metres, consisting of 0.55 g/t gold and 17.0 g/t silver INCLUDING 9.2 metres grading 2.19 g/t gold equivalent or 164.0 g/t silver equivalent from 5.4 to 14.6 metres consisting of 0.90 g/t gold and 96.3 g/t silver gold in the Footwall Zone.
Drill hole ET-23-529: 42.5 metres grading 0.99 g/t gold equivalent or 73.9 g/t silver equivalent from 107.0 to 149.5 metres, consisting of 0.91 g/t gold and 5.6 g/t silver INCLUDING 18.0 metres grading 1.42 g/t gold equivalent or 106.2 g/t silver equivalent from 122.0 to 140.0 metres consisting of 1.27 g/t gold and 11.2 g/t silver in the Footwall Zone.
Drill hole ET-23-530: 56.9 metres grading 0.73 g/t gold equivalent or 54.9 g/t silver equivalent from 44.3 to 101.2 metres, consisting of 0.68 g/t gold and 3.7 g/t silver INCLUDING 18.7 metres grading 1.01 g/t gold equivalent or 75.8 g/t silver equivalent from 82.5 to 101.2 metres consisting of 0.93 g/t gold and 6.1 g/t silver in the Footwall Zone (Figure 2).
At the southern end of the PEA "starter pit", a new intersection in the Keel Zone is shown below.
Drill hole ET-23-518: 16.9 metres grading 0.96 g/t gold equivalent or 72.3 g/t silver equivalent from 97.7 to 114.6 metres, consisting of 0.07 g/t gold and 66.9 g/t silver INCLUDING 2.0 metres grading 6.7 g/t gold equivalent or 502.5 g/t silver equivalent from 108.0 to 110.0 metres consisting of 0.20 g/t gold and 487.5 g/t silver in the Keel Zone (Figure 2)
Figure 1 : Stockwork Zone - Plan View
Figure 2 : Stockwork Zone Cross Section 4275N
Highlights from the on-going Pre-Feasibility Study Drilling Program include the following:
Expanding known mineralization by 10 to 15%, to the footwall and hanging wall zones, as well as the higher-grade ‘keel' at PEA pit bottom associated with the El Tigre and SK Veins;
Converting first two to three years of mineralized material in the potential ‘Starter Stockwork Zone' from Indicated Mineral Resource to Measured;
Converting a significant portion of the 2 km strike length ‘ultimate' PEA pit-constrained Inferred Mineral Resource to Indicated;
Completion of enhanced PFS Metallurgical Drilling, with samples underway comminution and leach testing; and
Completion of enhanced PFS Geotechnical Drilling, with samples undergoing testing.
Mineral Resource Drilling
P&E Mining Consultants Inc. ("P&E") of Brampton, Ontario completed the initial MRE in 2017. On Oct 27, 2023, P&E released an updated El Tigre Project NI 43-101 and NI 43-01 F1 compliant MRE technical report titled "Technical Report and Updated Mineral Resource Estimate of the El Tigre Silver-Gold Project, Sonora, Mexico" authored by William Stone, Ph.D., P.Geo., Yungang Wu, P.Geo., Fred H. Brown, P.Geo., Jarita Barry, P.Geo., David Burga, P.Geo., D. Grant Feasby, P.Eng., Eugene Puritch, P.Eng., FEC, CET and David Salari, P.Eng. The MRE has a pit-constrained Indicated Mineral Resource totaling 43.0 million tonnes containing 818 thousand ounces AuEq grading 0.59 g/t AuEq; and a pit-constrained Inferred Mineral Resource of 11.5 million tonnes containing 267 thousand ounces AuEq grading 0.72 g/t AuEq (see update MRE press release dated September 12th, 2023).
PEA-level bench optimization of the pit-constrained Mineral Resource highlighted the higher-grade (~0.80 gpt AuEq), low strip ratio (~0.3) potential Starter Stockwork Zone which contains 5.7 million tonnes of mineralized material (see PEA press release dated November 1st, 2023). Recommendations of the PEA-level study included increasing Mineral Resource confidence in potential ‘Starter Stockwork Zone' and additional exploratory drilling to target the 1) Footwall, 2) Hanging Wall and 3) ‘Keel' areas of the Stockwork Zone. P&E were again retained to lead the current El Tigre PFS-level study with 23,000 metres of the program complete (Figure 1). Complete and final assay results are listed in Table 1.
Below, highlighted intersections are enumerated with reference to the three (3) zones targeted:
Drill hole ET-23-518: Confirms at surface mineralization in the Hanging Wall Zone, and downhole, expands known strike of high-grade Keel Zone to north;
Drill hole ET-23-527: Expands Footwall Zone by 25m to east over 2023 MRE (Figure 2);
Drill hole ET-23-529: Confirms location and grade of Hanging Wall Zone, as well as high-grade El Tigre Vein; and
Drill hole ET-23-530: Expands Footwall Zone by 35 m to east over 2023 MRE (Figure 1);
Table 1-Mineral Resource Drill Hole Results
AuEq Total (2)
AgEq Total (2)
Hole ID
Comment
From
To
Length(1)
Gold
Silver
m
m
m
g/t
g/t
g/t
g/t
ET-23-516
STOCKWORK ZONE
0.0
43.0
43.0
0.73
5.0
0.79
59.5
including
19.0
30.0
11.0
1.48
10.4
1.62
121.2
STOCKWORK ZONE
73.0
108.2
35.2
0.39
18.8
0.64
48.3
including
99.8
106.5
6.7
0.20
64.0
1.06
79.3
STOCKWORK ZONE
125.5
132.0
6.5
0.15
115.1
1.69
126.5
ET-23-517
STOCKWORK ZONE
57.0
70.6
13.6
0.30
13.5
0.48
35.8
Mining VOID
70.6
73.0
2.4
*
*
*
*
STOCKWORK ZONE
75.0
135.0
60.0
0.37
10.1
0.51
38.1
including
123.4
128.5
5.1
1.15
71.6
2.11
157.9
ET-23-518
STOCKWORK ZONE
0.0
19.0
19.0
0.69
4.9
0.76
56.8
STOCKWORK ZONE
28.0
63.0
35.0
0.40
2.0
0.43
32.2
STOCKWORK ZONE
97.7
114.6
16.9
0.07
66.9
0.96
72.3
including
108.0
110.0
2.0
0.20
487.5
6.70
502.5
and
123.0
126.0
3.0
0.08
101.7
1.44
108.0
ET-23-519
STOCKWORK ZONE
44.5
63.5
19.0
0.31
1.3
0.32
24.3
ET-23-520
STOCKWORK ZONE
103.8
154.0
50.2
0.69
4.2
0.75
56.3
including
126.5
138.0
11.5
1.01
6.4
1.09
81.8
ET-23-521
STOCKWORK ZONE
33.5
118.0
84.5
0.47
3.8
0.52
39.2
including
94.0
107.0
13.0
0.78
9.7
0.91
68.5
ET-23-523
STOCKWORK ZONE
0.0
94.5
94.5
0.26
4.1
0.32
23.9
STOCKWORK ZONE
0.0
17.5
17.5
0.25
10.2
0.39
29.0
STOCKWORK ZONE
25.5
45.0
19.5
0.35
2.7
0.39
28.9
STOCKWORK ZONE
54.8
94.5
39.7
0.32
3.1
0.36
27.2
ET-23-524
STOCKWORK ZONE3
25.0
63.2
38.2
0.45
14.8
0.64
48.4
Mining VOID
42.7
43.8
1.1
*
*
*
*
STOCKWORK ZONE
56.2
63.2
7.0
0.88
2.4
0.91
68.6
STOCKWORK ZONE
103.2
125.0
21.8
0.62
14.0
0.81
60.4
including
103.2
119.0
15.8
0.81
18.9
1.06
79.5
ET-23-525
STOCKWORK ZONE
2.0
9.0
7.0
0.32
10.4
0.46
34.3
and
30.0
31.0
1.0
0.40
87.0
1.56
116.8
STOCKWORK ZONE
59.0
63.0
4.0
0.60
0.5
0.60
45.3
ET-23-526
STOCKWORK ZONE
113.0
161.8
48.8
0.39
2.8
0.43
32.1
including
113.0
119.0
6.0
0.91
1.6
0.93
69.5
Mining VOID
161.8
164.3
2.5
*
*
*
*
STOCKWORK ZONE
164.3
168.0
3.7
0.37
2.8
0.41
30.4
ET-23-527
STOCKWORK ZONE
0.0
74.0
74.0
0.55
17.0
0.78
58.5
including
5.4
14.6
9.2
0.90
96.3
2.19
164.0
including
48.8
74.0
25.2
1.04
5.3
1.11
83.4
ET-23-528
STOCKWORK ZONE
5.0
15.0
10.0
0.41
1.8
0.43
32.3
STOCKWORK ZONE
32.1
36.0
3.9
0.52
1.4
0.54
40.5
STOCKWORK ZONE4
85.0
98.0
13
0.14
90.8
1.35
101.6
Mining VOID
90.6
92.0
1.4
*
*
*
*
STOCKWORK ZONE
126.9
130.0
3.1
0.26
410.7
5.73
429.9
ET-23-529
STOCKWORK ZONE
107.0
149.5
42.5
0.91
5.6
0.99
73.9
including
107.0
140.0
33.0
1.09
6.6
1.18
88.7
including
107.0
115.0
8.0
1.57
1.3
1.58
118.7
including
122.0
140.0
18.0
1.27
11.2
1.42
106.2
ET-23-530
STOCKWORK ZONE
28.5
39.4
10.9
0.51
2.4
0.54
40.6
STOCKWORK ZONE
44.3
101.2
56.9
0.68
3.7
0.73
54.9
including
73.5
101.2
27.7
0.86
4.6
0.92
69.3
including
82.5
101.2
18.7
0.93
6.1
1.01
75.8
Notes:
Not true width.
SilverEquivalent ("AgEq") ratiosare based on a silverto gold priceratio of 75:1 (Au:Ag).
Excludes 1.10m mining void
Excludes 1.40m mining void
Table 2-DrillHole Locations
Hole ID
Easting
Northing
Elevation
Azimuth
Dip
Length
ET-23-516
671,128.6
3,383,868.3
1890.3
90
-45
150.0
ET-23-517
671,095.1
3,384,399.5
2022.0
90
-45
166.0
ET-23-518
671,101.1
3,383,862.6
1875.8
90
-45
150.0
ET-23-519
671,142.2
3,384,392.3
2012.0
90
-45
116.6
ET-23-520
671,043.0
3,384,368.6
2007.2
90
-45
166.0
ET-23-521
671,178.5
3,384,183.5
1992.4
90
-45
135.6
ET-23-522
671,195.8
3,384,569.2
2108.3
80
-60
141.0
ET-23-523
671,192.3
3,383,947.4
1879.7
90
-45
102.0
ET-23-524
671,122.2
3,384,364.5
1993.4
90
-45
130.1
ET-23-525
671,231.3
3,384,065.5
1959.1
90
-45
109.3
ET-23-526
671,042.1
3,384,368.5
2007.1
90
-55
193.0
ET-23-527
671,182.2
3,384,277.9
1992.3
90
-45
100.0
ET-23-528
671,092.7
3,383,920.0
1854.7
90
-45
140.0
ET-23-529
671,040.9
3,384,394.0
2020.3
90
-45
172.0
ET-23-530
671,181.7
3,384,218.7
1989.7
90
-45
106.3
Figure 3: El Tigre - Conceptual Cross-Section Showing Mineralization Styles
Figure 3: El Tigre-Longitudinal Projection Showing Exploration Potential
About Silver Tiger and the El Tigre Historic Mine District
Silver Tiger Metals Inc. is a Canadian company whose management has more than 25 years' experience discovering, financing and building large hydrothermal silver projects in Mexico. Silver Tiger's 100% owned 28,414 hectare historic El Tigre Mining District is located in Sonora, Mexico. Principled environmental, social and governance practices are core priorities at Silver Tiger.
The El Tigre historic mine district is located in Sonora, Mexico and lies at the northern end of the Sierra Madre silver and gold belt which hosts many epithermal silver and gold deposits, including Dolores, Santa Elena and Las Chispas at the northern end. In 1896, gold was first discovered on the Property in the Gold Hill area and mining started with the Brown Shaft in 1903. The focus soon changed to mining silver veins in the area with production coming from 3 parallel veins the El Tigre Vein, the Seitz Kelley Vein and the Sooy Vein. Underground mining on the middle El Tigre Vein extended 1,450 metres along strike and was mined on 14 levels to a depth of approximately 450 metres. The Seitz Kelley Vein was mined along strike for 1 kilometre to a depth of approximately 200 metres. The Sooy Vein was only mined along strike for 250 metres to a depth of approximately 150 metres. Mining abruptly stopped on all three of these veins when the price of silver collapsed to less than US20¢ per ounce with the onset of the Great Depression. By the time the mine closed in 1930, it is reported to have produced a total of 353,000 ounces of gold and 67.4 million ounces of silver from 1.87 million tons (Craig, 2012). The average grade mined during this period was over 2 kilograms silver equivalent per ton.
The El Tigre silver and gold deposit is related to a series of epithermal veins controlled by a north-south trending structure cutting across the andesitic and rhyolitic tuffs of the Sierra Madre Volcanic Complex within a broad silver and gold mineralized prophylitic alteration zone developed in the El Tigre Formation that can be up to 150 metres wide. The veins dip steeply to the west and are typically 0.5 metre wide; however, locally can be up to 5 metres in width. The veins, structures and mineralized zones outcrop on surface and have been traced for 5.3 kilometres along strike in our brownfield exploration area. Historical mining and exploration activities focused on a 1.6-kilometre portion of the southern end of the deposits, principally on the El Tigre, Seitz Kelly and Sooy veins. The under explored Caleigh, Benjamin, Protectora and the Fundadora exposed veins continue north for more than 3 kilometres. Silver Tiger has delivered its updated NI 43-101 compliant Mineral Resource Estimate and PEA and is currently drilling to update its Mineral Resource Estimate and publish a PFS.
VRIFY Slide Deck and 3D Presentation - Silver Tiger's El Tigre Project
VRIFY is a platform being used by companies to communicate with investors using 360° virtual tours of remote mining assets, 3D models and interactive presentations. VRIFY can be accessed by website and with the VRIFY iOS and Android apps.
Procedure, Quality Assurance / Quality Control and Data Verification
The diamond drill core (HQ size) is geologically logged, photographed and marked for sampling. When the sample lengths are determined, the full drill core is sawn with a diamond blade drill core saw with one half of the drill core being bagged and tagged for assay. The remaining half portion is returned to the drill core trays for storage and/or for metallurgical test work.
The sealed and tagged drill core sample bags are transported to the Bureau Veritas facility in Hermosillo, Mexico. Bureau Veritas crushes the samples (Code PRP70-250) and prepares 200-300 gram pulp samples with ninety percent passing Tyler 200 mesh (Code PUL85). The pulps are assayed for gold using a 30-gram charge by fire assay (Code FA630) and over limits greater than 10 grams per tonne are re-assayed using a gravimetric finish (Code FA530). Silver and multi-element analysis is completed using total digestion (Code MA200 Total Digestion ICP). Over limits greater than 100 grams per tonne silver are re-assayed using a gravimetric finish (Code FA530).
Quality assurance and quality control ("QA/QC") procedures monitor the chain-of-custody of the samples and includes the systematic insertion and monitoring of appropriate reference materials (certified reference materials, blanks and duplicates) into the sample strings. The results of the assaying of the QA/QC material included in each batch are tracked to ensure the integrity of the assay data. All results stated in this announcement have passed Silver Tiger's QA/QC protocols.
Qualified Person
David R. Duncan, P. Geo., V.P. Exploration of the Corporation, is the Qualified Person for Silver Tiger as defined under National Instrument 43-101. Mr. Duncan has reviewed and approved the scientific and technical information in this press release.
Neither TSX Venture Exchange nor its Regulation Services Provider (as that term is defined in the policies of the TSX Venture Exchange) accepts responsibility for the adequacy or accuracy of this release.
This News Release includes certain "forward-looking statements". All statements other than statements of historical fact included in this release, including, without limitation, statements regarding potential mineralization, Mineral Resources and Mineral Reserves, the ability to convert Inferred Resources to Indicated Resources, the ability to complete future drilling programs and infill sampling, the ability to extend Mineral Resource blocks, the similarity of mineralization at El Tigre to Delores, Santa Elena and Chispas, exploration results, and future plans and objectives of Silver Tiger, are forward-looking statements that involve various risks and uncertainties. Forward-looking statements are frequently characterized by words such as "may", "is expected to", "anticipates", "estimates", "intends", "plans", "projection", "could", "vision", "goals", "objective" and "outlook" and other similar words. Although Silver Tiger believes the expectations expressed in such forward-looking statements are based on reasonable assumptions, there can be no assurance that such statements will prove to be accurate and actual results and future events could differ materially from those anticipated in such statements. Important factors that could cause actual results to differ materially from Silver Tiger's expectations include risks and uncertainties related to exploration, development, operations, commodity prices and global financial volatility, risk and uncertainties of operating in a foreign jurisdiction as well as additional risks described from time to time in the filings made by Silver Tiger with securities regulators.
Significant increase in estimated mineral resources for the La Colorada Skarn project
Mineral reserve replacement and 1.2 million ounce increase in gold inferred mineral resources at Jacobina demonstrates exploration potential
Pan American Silver Corp. (NYSE: PAAS) (TSX: PAAS) ("Pan American" or the "Company") reports its estimated mineral reserves and mineral resources as at June 30, 2024. Proven and probable mineral reserves are estimated to contain approximately 468.0 million ounces of silver and 6.9 million ounces of gold. Measured and indicated ("M&I") mineral resources (excluding proven and probable ("P&P") reserves) are estimated to total approximately 1,148.0 million ounces of silver and 15.5 million ounces of gold. Inferred mineral resources are estimated to total approximately 366.0 million ounces of silver and 9.4 million ounces of gold. The updated mineral reserves and mineral resources estimates are reported net of the sales of the MARA, Agua de la Falda and Morococha properties, as announced in the Company's news release dated July 31, 2023. The divestment of these non-core, non-producing assets is largely responsible for a decrease in mineral reserves and mineral resources compared to 2023.
"Our exploration efforts have successfully replaced mine production and expanded mineral reserves at Jacobina, La Colorada, Huaron and Minera Florida. In addition, infill and extensional drilling at the Jacobina mine has increased inferred mineral resources by over 1.2 million ounces of gold, highlighting the significant exploration potential of the deposit and the opportunity to replace mineral resources and mineral reserves in the future," said Christopher Emerson, Pan American's Vice President of Exploration and Geology. "At the La Colorada Skarn project, estimated indicated mineral resources have grown substantially to 309 million ounces of silver due to higher tonnage and higher grades, with the inferred mineral resource now estimated at 59 million ounces of silver. Zinc and lead contained within the skarn deposit have also increased since our last resource update."
In 2024, Pan American plans to complete over 360,000 metres of drilling across its portfolio of mines, focused on near-mine exploration for mineral reserve replacement.
Consolidated Proven and Probable Mineral Reserves, as at June 30, 2024 (1,2,3)
Segment
Category
Tonnes (millions)
Ag
(g/t)
Contained Ag (Moz)
Au
(g/t)
Contained Au
(koz)
Silver Segment (4)
Proven Reserves
13.3
278
119.1
0.68
135.1
Probable Reserves
32.5
293
306.2
0.49
444.6
Proven and Probable Reserves
45.8
289
425.2
0.52
579.7
Gold Segment (5)
Proven Reserves
80.3
13
17.6
1.14
2,952.9
Probable Reserves
99.8
16
25.2
1.05
3,360.3
Proven and Probable Reserves
180.1
14
42.7
1.09
6,313.1
Total Segments (6)
Proven Reserves
93.7
75
136.6
1.11
3,088.0
Probable Reserves
132.3
124
331.4
0.92
3,804.8
Proven and Probable Reserves
225.9
105
468.0
1.00
6,892.8
(1) See table below entitled "Metal price assumptions used to estimate mineral reserves and mineral resources as at June 30, 2024". (2) Please refer to the complete mineral reserve and mineral resource tables at the end of this news release for more information. (3) This summary table does not include base metal grades or contents. Please refer to the Reserves & Resources page on Pan American's website for a more complete table, including zinc, lead and copper grades and contents. (4) Silver Segment mineral reserves comprised of Escobal, La Colorada, Huaron, San Vicente, and Cerro Moro. (5) Gold Segment mineral reserves comprised of Jacobina, Shahuindo, El Peñon, Timmins, Minera Florida, La Arena, and Dolores. (6) Totals may not add up due to rounding. Total average grades of each metal are with respect to those mines that produce the metal.
Consolidated Mineral Resources, as at June 30, 2024 (1,2,3,4)
Segment
Category
Tonnes (millions)
Ag
(g/t)
Contained Ag (Moz)
Au
(g/t)
Contained Au
(koz)
Silver Segment (5)
Measured Resources
20.7
159
105.6
0.63
65.2
Indicated Resources
425.4
73
1,002.7
0.47
276.9
M&I Resources
446.1
77
1,108.4
0.50
342.2
Gold Segment (6)
Measured Resources
271.8
21
17.8
0.62
5,431.2
Indicated Resources
704.7
26
21.8
0.43
9,751.0
M&I Resources
976.5
24
39.6
0.48
15,182.2
Total Segments (7)
Measured Resources
292.4
82
123.5
0.62
5,496.4
Indicated Resources
1,130.1
71
1,024.5
0.43
10,027.9
M&I Resources
1,422.6
72
1,148.0
0.48
15,524.3
(1) See table below entitled "Metal price assumptions used to estimate mineral reserves and mineral resources as at June 30, 2024". (2) Mineral resources are reported exclusive of mineral reserves. (3) Please refer to the complete mineral reserve and resource tables at the end of this news release for more information. (4) This summary table does not include base metal grades or contents. Please refer to the Reserves & Resources page on Pan American's website for a more complete table, including zinc, lead and copper grades and contents. (5) Silver Segment mineral resources comprised of Navidad, La Colorada Skarn, Escobal, Huaron, La Colorada, Manantial Espejo, Cerro Moro, San Vicente, and Joaquin. (6) Gold Segment mineral resources comprised of Jacobina, La Arena II, La Pepa, El Peñon, Minera Florida, La Bolsa, Lavra Velha, Pico Machay, Timmins, Shahuindo, Vogel, Gold River, Whitney, Marlhill, Dolores, and La Arena. (7) Totals may not add up due to rounding. Total average grades of each metal are with respect to those mines that produce the metal.
Consolidated Inferred Mineral Resources, as at June 30, 2024 (1,2,3,4)
Segment
Category
Tonnes (millions)
Ag
(g/t)
Contained Ag (Moz)
Au
(g/t)
Contained Au
(koz)
Silver Segment (5)
Inferred Resources
130.0
78
327.8
0.61
304.3
Gold Segment (6)
Inferred Resources
254.0
21
38.2
1.12
9,118.4
Total Segments (7)
Inferred Resources
384.0
61
366.0
1.09
9,422.8
(1) See table below entitled "Metal price assumptions used to estimate mineral reserves and mineral resources as at June 30, 2024". (2) Mineral resources are reported exclusive of mineral reserves. (3) Please refer to the complete mineral reserve and mineral resource tables at the end of this news release for more information. (4) This summary table does not include base metal grades or contents. Please refer to the Reserves & Resources page on Pan American's website for a more complete table, including zinc, lead and copper grades and contents. (5) Silver Segment inferred mineral resources comprised of Navidad, La Colorada, La Colorada Skarn, Huaron, San Vicente, Escobal, Cerro Moro, Manantial Espejo and Joaquin. (6) Gold Segment inferred mineral resources comprised of Jacobina, Gold River, El Peñon, Arco Sul, Minera Florida, Whitney, Pico Machay, La Arena II, Timmins, La Pepa, Lavra Velha, La Bolsa, Vogel, Shahuindo, Dolores, and La Arena. (7) Totals may not add up due to rounding. Total average grades of each metal are with respect to those mines that produce the metal.
Mineral reserve and mineral resource highlights for the 12-months ended June 30, 2024:
The successful divestment of non-core, non-producing properties - MARA, Morococha and Agua de la Falda - in 2023 reduced the consolidated P&P mineral reserves by 89.9 million ounces of silver and 5.2 million ounces of gold. After adjusting for a full year of production, the significant exploration success at many of our operations and other parameters, the consolidated mineral reserves at June 30, 2024, are estimated to total 468.0 million ounces of silver and 5.2 million ounces of gold.
Consolidated M&I silver mineral resources increased from an estimated 959.0 million ounces to an estimated 1,148.0 million ounces. The increase in M&I silver mineral resources is mainly due to the increase in indicated resources at the La Colorada Skarn project more than offsetting the sales of MARA and Morococha. Consolidated M&I gold mineral resources decreased from an estimated 17.5 million ounces to an estimated 15.5 million ounces, largely due to the sales of the MARA and Agua de la Falda properties.
At the La Colorada Skarn project, estimated indicated mineral resources significantly increased to 308.7 million ounces of contained silver with higher tonnage, higher silver and base metal grades, and improved geological confidence.
At Jacobina, exploration more than replaced mine production with new mineral reserves, marking the eighth consecutive year of full replacement of production. New gold inferred mineral resources estimated at over 1.2 million ounces were also added, including 495 thousand ounces at Maricota, a new zone north of Morro do Cuscuz. See the Company's news releases dated June 17, 2024 and December 5, 2023, for further information on Maricota.
At El Peñon, mineral resources and mineral reserves were added to the southeast of the current mining zones in major veins like Pampa Sur and Pampa Campamento, as well as in silver rich structures like Tostado Sur and others. Future exploration will continue to target converting the large inferred mineral resource to mineral reserves and to discovering new veins on the mine's extensive land position.
At La Colorada, the eastward extensions of the veins, described in previous news releases, contributed to a net addition to silver P&P mineral reserves.
At Minera Florida, 103.7 thousand ounces of P&P gold mineral reserves and 864 thousand ounces of P&P silver mineral reserves were added, more than replacing mine production.
At Huaron, P&P silver mineral reserves increased by 1.7 million ounces, more than replacing mine production, with the Horizonte zone alone adding 2.7 million ounces of new P&P silver mineral reserves.
At Timmins, exploration has been focused on the Whitney joint venture project, with more than 20,500 metres of drilling completed over the 2021 to 2023 period, contributing to an updated estimate for indicated gold mineral resources of 93.6 thousand ounces and inferred gold mineral resources of 574.0 thousand ounces (based on a 100% interest). Pan American is now focused on further exploratory and confirmation drilling of the project. See the December 5, 2023 news release for more information on the Whitney project.
A detailed summary of the silver and gold mineral reserves and mineral resources as at June 30, 2024 is provided in the tables at the end of this news release.
LA COLORADA SKARN MINERAL RESOURCE UPDATE
Approximately 73,000 metres of exploration and infill drilling have been completed since the last mineral resource update, including high-grade intercepts reported in previous news releases. The drilling has resulted in a significant increase in estimated mineral resources and higher silver and base metal grades. It also improved a large portion of mineral resources from the inferred category to indicated. The tables below illustrate the improvements and the highlights include:
A 53% increase in indicated mineral resources to an estimated 265.4 million tonnes.
Improvement in silver, zinc and lead grades by 10%, 2% and 4%, respectively, for the indicated mineral resource category.
A 69% increase in contained silver to 308.7 million ounces in indicated mineral resources. Contained silver in inferred mineral resources is estimated at 58.6 million ounces.
A 56% increase in contained zinc to 7.6 million tonnes and a 60% increase in contained lead to 3.6 million tonnes in indicated mineral resources.
Addition of 125.5 million ounces of silver, 2.7 million tonnes of zinc and 1.4 million tonnes of lead to indicated mineral resources.
Exploration and resource infill drilling is ongoing with additional drill rigs completing condemnation and hydrogeological work. Engineering work continues with geotechnical studies required for sub level caving ("SLC") and reviewing the updated mineral resource and mining shapes to optimize mineral extraction.
Next steps include further infill drilling, additional analysis of alternative mining methods, optimizing throughputs, preparing capital and operating cost estimates, as well as advancing discussions with potential project partners.
La Colorada Skarn Estimated Mineral Resource as at June 30, 2024
Classification
Tonnes
(millions)
Zn
(%)
Pb
(%)
Ag
(g/t)
Indicated
265.4
2.85
1.37
36
Inferred
61.7
2.55
0.95
30
Notes:
The effective date of the mineral resources estimate is June 30, 2024.
Estimation and reporting of mineral resources were carried out in accordance with Canadian Institute of Mining, Metallurgy and Petroleum ("CIM") guidelines.
Mineral resources have been classified into indicated and inferred confidence categories.
Mineral resources have reasonable prospects for eventual economic extraction demonstrating sufficient spatial continuity of mineralization constrained within a potentially mineable shape. Mineral resources that are not mineral reserves do not have demonstrated economic viability. No mineral reserves are reported at this time for the La Colorada Skarn project.
Prices used to report mineral resources were: $22.00 per ounce of silver, $2,800 per tonne of zinc and $2,200 per tonne of lead.
An estimated NSR (in US$/t) was calculated using metallurgical recoveries of 84.9% Ag, 84.3% Pb and 93.7% Zn with mineral concentrate qualities of 61% Pb in lead concentrate and 59% Zn in zinc concentrate, obtained from metallurgical testing. Estimates for transport, payability and refining/selling costs, based on experience and long-term views of the marketing, treatment and refining of these types of mineral concentrates, were included.
Reasonable prospects for eventual economic extraction were assessed by determining the total in-situ tonnes and metal grades constrained inside volumes that are based on a SLC mining method considering operating and sustaining capital cost estimates of $45/t. To determine the constraining SLC shapes, an initial elevated cutoff value of $50/t NSR was applied. Then geotechnical, geometry and caving rules were applied to ensure practical mining shapes were achieved. The resulting constraining shapes were then considered to be practical mining outlines. The tonnes and grades are inclusive of the must-take low grade material within the volume. No other mining recovery, ring recovery, dilution or mineral losses have been applied.
This mineral resource estimate was prepared under the supervision of, or was reviewed by, Christopher Emerson, FAusIMM, Vice President Exploration and Geology, who is a Qualified Person as that term is defined in NI 43-101.
Grades are shown as contained metal before mill recoveries are applied. The Company has undertaken a verification process with respect to the data disclosed in this news release.
A total of 376 diamond drill holes with a total length of 314,930 metres were used in the geological interpretation and resource estimate. Several old historic drill holes were included in the modeling. Drilling of the La Colorada Skarn deposit has been completed from both surface and underground drill platforms.
All drill hole samples used in the mineral resource estimate have been previously reported in news releases dated October 23, 2018, February 21, 2019, May 8, 2019, August 1, 2019, October 30, 2019, February 13, 2020, August 4, 2020, May 12, 2021, November 10, 2021, February 24, 2022, May 9, 2022, November 1, 2022, May 2, 2023, December 5, 2023, and April 7, 2024.
MINERAL RESERVES AND MINERAL RESOURCES TABLES
Consolidated Pan American Mineral Reserves as at June 30, 2024 (1)
Property
Location
Classification
Tonnes
(millions)
Ag
(g/t)
Contained Ag
(koz)
Au
(g/t)
Contained Au
(koz)
Silver Segment
Escobal
Guatemala
Proven
2.5
486
39.5
0.42
34.2
Probable
22.1
316
225.0
0.34
243.8
La Colorada
Mexico
Proven
3.2
305
31.4
0.20
20.5
Probable
5.8
296
55.2
0.19
35.3
Huaron
Peru
Proven
6.2
173
34.4
--
--
Probable
3.5
163
18.2
--
--
San Vicente (95%) (2)
Bolivia
Proven
0.9
329
9.8
--
--
Probable
0.5
250
4.3
--
--
Cerro Moro
Argentina
Proven
0.4
272
3.9
5.58
80.4
Probable
0.6
200
3.6
9.31
165.5
Total Silver Segment (3)
45.8
289
425.2
0.52
579.7
Gold Segment
Jacobina
Brazil
Proven
24.0
--
--
1.84
1,420.0
Probable
30.3
--
--
1.79
1,742.3
Shahuindo
Peru
Proven
39.8
8
10.5
0.52
660.4
Probable
44.7
5
7.2
0.28
398.6
El Peñon
Chile
Proven
0.8
208
5.5
5.46
145.4
Probable
4.0
131
16.7
3.99
507.4
Timmins
Canada
Proven
5.4
--
--
2.79
481.4
Probable
4.4
--
--
2.74
386.2
Minera Florida
Chile
Proven
1.2
23
0.9
3.25
128.7
Probable
1.8
22
1.3
3.18
188.0
La Arena (4)
Peru
Proven
8.0
--
--
0.41
103.7
Probable
14.7
--
--
0.29
137.8
Dolores
Mexico
Proven
1.2
16
0.6
0.35
13.3
Probable
--
--
--
--
--
Total Gold Segment (3)
180.1
14
42.7
1.09
6,313.1
Total Gold and Silver Segments (3)
Proven + Probable
225.9
105
468.0
1.00
6,892.8
(1) See table below entitled "Metal price assumptions used to estimate mineral reserves and mineral resources as at June 30, 2024". (2) This information represents the portion of mineral reserves attributable to Pan American based on its ownership interest in the operating entity as indicated. (3) Totals may not add up due to rounding. Total average grades of each metal are with respect to those mines that produce the metal. (4) Pan American has entered into an agreement to sell its interest in La Arena S.A., which owns the La Arena gold mine and the La Arena II copper-gold project; see the news release dated May 1, 2024 for further details.
Pan American Silver Measured and Indicated Mineral Resources as at June 30, 2024 (1,2)
Property
Location
Classification
Tonnes
(millions)
Ag
(g/t)
Contained Ag
(koz)
Au
(g/t)
Contained Au
(koz)
Silver Segment
Navidad
Argentina
Measured
15.4
137
67.8
--
--
Indicated
139.8
126
564.5
--
--
La Colorada Skarn
Mexico
Indicated
265.4
36
308.7
--
--
Escobal
Guatemala
Measured
2.3
251
18.6
0.23
16.7
Indicated
14.2
201
91.6
0.20
93.0
Huaron
Peru
Measured
1.3
196
8.3
--
--
Indicated
1.8
162
9.4
--
--
La Colorada
Mexico
Measured
0.4
231
2.7
0.11
1.2
Indicated
2.1
181
12.2
0.27
18.4
Manantial Espejo
Argentina
Measured
0.3
164
1.7
2.40
24.7
Indicated
1.0
149
4.9
2.79
91.5
Cerro Moro
Argentina
Measured
0.1
226
0.9
5.48
21.4
Indicated
0.5
347
5.5
4.50
70.7
San Vicente (95%) (3)
Bolivia
Measured
0.7
180
4.1
--
--
Indicated
0.3
203
1.8
--
--
Joaquin
Argentina
Measured
0.1
360
1.5
0.28
1.2
Indicated
0.4
351
4.2
0.28
3.4
Total Silver Segment (3)
446.1
77
1,108.4
0.50
342.2
Gold Segment
Jacobina
Brazil
Measured
39.7
--
--
1.70
2,175.1
Indicated
55.1
--
--
1.58
2,796.0
La Arena II (4)
Peru
Measured
152.2
--
--
0.25
1,246.1
Indicated
554.3
--
--
0.23
4,042.7
La Pepa (80.0%) (3)
Chile
Measured
47.1
--
--
0.61
922.8
Indicated
52.3
--
--
0.49
824.3
El Peñon
Chile
Measured
1.6
166
8.3
5.25
262.2
Indicated
3.8
112
13.8
3.44
423.1
Minera Florida
Chile
Measured
1.9
17
1.1
3.26
202.6
Indicated
4.1
19
2.5
3.54
467.6
La Bolsa
Mexico
Measured
10.8
10
3.5
0.70
242.8
Indicated
10.6
8
2.7
0.54
184.3
Lavra Velha
Brazil
Indicated
4.5
--
--
1.96
282.1
Pico Machay
Peru
Measured
4.7
--
--
0.91
137.5
Indicated
5.9
--
--
0.67
127.1
Timmins
Canada
Measured
1.1
--
--
2.48
85.5
Indicated
1.3
--
--
2.76
114.2
Shahuindo
Peru
Measured
8.8
7
2.0
0.38
108.5
Indicated
6.8
6
1.2
0.34
74.2
Vogel
Canada
Indicated
2.2
--
--
1.75
125.0
Gold River
Canada
Indicated
0.7
--
--
5.29
117.4
Whitney (83.27%) (3)
Canada
Measured
--
--
--
--
--
Indicated
0.6
--
--
3.77
77.9
Marlhill
Canada
Indicated
0.4
--
--
4.52
57.4
Dolores
Mexico
Measured
3.0
30
2.9
0.41
39.4
Indicated
0.6
73
1.5
1.40
28.8
La Arena (5)
Peru
Measured
0.9
--
--
0.29
8.7
Indicated
1.4
--
--
0.19
8.9
Total Gold Segment (4)
976.5
24
39.6
0.48
15,182.2
Total Gold and Silver Segments (4)
Measured + Indicated
1,422.6
72
1,148.0
0.48
15,524.3
(1) See table below entitled "Metal price assumptions used to estimate mineral reserves and mineral resources as at June 30, 2024". (2) Mineral resources are reported exclusive of mineral reserves. (3) This information represents the portion of mineral resources attributable to Pan American based on its ownership interest in the operating entity as indicated. (4) Totals may not add up due to rounding. Total average grades of each metal are with respect to those mines that produce the metal. (5) Pan American has entered into an agreement to sell its interest in La Arena S.A., which owns the La Arena gold mine and the La Arena II copper-gold project; see the news release dated May 1, 2024 for further details.
Pan American Inferred Mineral Resources as at June 30, 2024 (1,2)
Property
Location
Classification
Tonnes
(millions)
Ag
(g/t)
Contained Ag
(koz)
Au
(g/t)
Contained Au
(koz)
Silver Segment
Navidad
Argentina
Inferred
45.9
81
119.4
--
--
La Colorada
Mexico
Inferred
12.4
235
93.8
0.19
74.4
La Colorada Skarn
Mexico
Inferred
61.7
30
58.6
--
--
Huaron
Peru
Inferred
5.2
165
27.5
--
--
San Vicente (95%) (3)
Bolivia
Inferred
1.6
213
11.0
--
--
Escobal
Guatemala
Inferred
1.9
180
10.7
0.90
53.7
Cerro Moro
Argentina
Inferred
0.7
168
3.6
6.98
149.8
Manantial Espejo
Argentina
Inferred
0.5
106
1.8
1.49
25.2
Joaquin
Argentina
Inferred
0.2
280
1.4
0.25
1.2
Total Silver Segment (4)
130.0
78
327.8
0.61
304.3
Gold Segment
Jacobina
Brazil
Inferred
57.1
--
--
1.77
3,249.5
Gold River
Canada
Inferred
5.3
--
--
6.06
1,027.4
El Peñon
Chile
Inferred
18.4
48
28.6
1.38
816.4
Arco Sul
Brazil
Inferred
6.2
--
--
3.08
614.2
Minera Florida
Chile
Inferred
5.4
15
2.7
3.03
531.2
Whitney (83.27 %) (3)
Canada
Inferred
4.0
--
--
3.75
477.7
Pico Machay
Peru
Inferred
23.9
--
--
0.58
445.7
La Arena II (5)
Peru
Inferred
66.8
--
--
0.21
445.2
Timmins
Canada
Inferred
3.5
--
--
3.37
382.5
La Pepa (80.0%) (3)
Chile
Inferred
20.0
--
--
0.46
296.1
Lavra Velha
Brazil
Inferred
4.7
--
--
1.56
238.0
La Bolsa
Mexico
Inferred
13.7
8
3.3
0.51
224.6
Vogel
Canada
Inferred
1.5
--
--
3.60
168.8
Shahuindo
Peru
Inferred
17.3
4
2.1
0.21
115.8
Dolores
Mexico
Inferred
0.9
56
1.6
1.65
45.8
La Arena (5)
Peru
Inferred
5.3
--
--
0.23
39.6
Total Gold Segment (4)
254.0
21
38.2
1.12
9,118.4
Total Gold and Silver Segments (4)
Inferred
384.0
61
366.0
1.09
9,422.8
(1) See table below entitled "Metal price assumptions used to estimate mineral reserves and mineral resources as at June 30, 2024". (2) Mineral resources are reported exclusive of mineral reserves. (3) This information represents the portion of mineral resources attributable to Pan American based on its ownership interest in the operating entity as indicated. (4) Totals may not add up due to rounding. Total average grades of each metal are with respect to those mines that produce the metal. (5) Pan American has entered into an agreement to sell its interest in La Arena S.A., which owns the La Arena gold mine and the La Arena II copper-gold project; see the news release dated May 1, 2024 for further details.
Metal price assumptions used to estimate mineral reserves and mineral resources as at June 30, 2024
Mine
Category
Ag US$/oz
Au US$/oz
Cu US$/t
Pb US$/t
Zn US$/t
Escobal
All categories
20.00
1,300
2,204
2,424
La Colorada
Reserves
20.00
1,700
8,000
2,100
2,600
Resources
22.00
1,850
9,000
2,200
2,800
La Colorada Skarn
Resources
22.00
2,200
2,800
Huaron
Reserves
20.00
1,700
8,000
2,100
2,600
Resources
22.00
1,850
9,000
2,200
2,800
San Vicente
All categories
20.00
1,700
8,000
2,100
2,600
Cerro Moro
Reserves
21.00
1,850
Resources
23.00
1,950
Navidad
All categories
12.52
1,100
Manantial Espejo
Resources
22.00
1,700
Joaquin
Resources
22.00
1,700
Jacobina
Reserves
1,700
Resources
1,850
Shahuindo
Reserves
20.00
1,700
Resources
22.00
1,850
El Peñon
Reserves
20.00
1,700
Resources
22.00
1,850
Timmins West
Reserves
21.00
1,850
Resources
23.00
1,950
Bell Creek
Reserves
21.00
1,850
Resources
23.00
1,950
Whitney
Resources
1,950
Minera
Florida
Reserves
21.00
1,850
2,100
2,600
Resources
23.00
1,950
2,200
2,800
La Arena
Reserves
21.00
1,850
Resources
23.00
1,950
La Arena II
All categories
1,500
8,816
Dolores
Reserves
21.00
1,850
Resources
23.00
1,950
La Pepa
Resources
1,650
La Bolsa
All categories
14.00
825
Lavra Velha
Resources
1,650
Pico Machay
All categories
700
Vogel
Inside pit
1,150
Below pit
1,150
Gold River
Resources
1,200
Marlhill
Resources
1,125
Arco Sul
Resources
1,250
General Notes with Respect to Technical Information
All mineral reserves and mineral resources have been estimated in accordance with the CIM Definition Standards on Mineral Resources and Mineral Reserves , adopted by the CIM Council, as amended (the "CIM Standards") and reported in accordance with National Instrument 43-101 – Standards of Disclosure for Mineral Projects ("NI 43-101"). Mineral resources are reported exclusives of mineral reserves.
Pan American does not expect these mineral reserve and mineral resource estimates to be materially affected by metallurgical, environmental, permitting, legal, taxation, socio-economic, political, and marketing or other relevant issues.
The Company has undertaken a verification process with respect to the data disclosed in this news release. The mineral resources and mineral reserves databases comprising drilling and, in some cases, surface and underground sampling, have been compiled at each of the Pan American mine sites by the qualified staff. All the assay data used in the resource evaluation provided by each of the mines has been subjected to the industry standard quality assurance and quality control ("QA/QC") program including the submission of certified standards, blanks, and duplicate samples. The results are reviewed monthly by management. The results of the QA/QC samples submitted for the resource databases demonstrate acceptable accuracy and precision. The Qualified Person is of the opinion that the sample preparation, analytical, and security procedures followed for the samples are sufficient and reliable for the purpose of these mineral resource and mineral reserve estimates. Pan American is not aware of any drilling, sampling, recovery or other factors that could materially affect the accuracy or reliability of the data reported herein.
Quantities and grades of contained metal are shown before metallurgical recoveries.
Technical information contained in this news release with respect to Pan American has been reviewed and approved by Christopher Emerson, FAusIMM., Vice President of Exploration and Geology, and Martin Wafforn, P.Eng., Senior Vice President Technical Services and Process Optimization, who are each Qualified Persons for the purposes of NI 43-101.
Pan American Silver Corp. is authorized by The Association of Professional Engineers and Geoscientists of the Province of British Columbia to engage in Reserved Practice under Permit to Practice number 1001470.
About Pan American
Pan American Silver is a leading producer of silver and gold in the Americas, operating mines in Canada, Mexico, Peru, Brazil, Bolivia, Chile and Argentina. We also own the Escobal mine in Guatemala that is currently not operating, and we hold interests in exploration and development projects. We have been operating in the Americas for three decades, earning an industry-leading reputation for sustainability performance, operational excellence and prudent financial management. We are headquartered in Vancouver, B.C. and our shares trade on the New York Stock Exchange and the Toronto Stock Exchange under the symbol "PAAS".
Cautionary Note Regarding Forward-Looking Statements and Information
Certain of the statements and information in this news release constitute "forward-looking statements" within the meaning of the United States Private Securities Litigation Reform Act of 1995 and "forward-looking information" within the meaning of applicable Canadian provincial securities laws. All statements, other than statements of historical fact, are forward-looking statements or information. Forward-looking statements or information in this news release relate to, among other things: estimated mineral reserve and mineral resource information; estimated mine life and any anticipated changes related thereto; the extent of, and success related to any future exploration or development programs; expectations that metallurgical, environmental, permitting, legal, title, taxation, socio-economic, political, marketing or other issues will not materially affect estimates of mineral reserves and mineral resources; expectations regarding planned drilling in 2024, including that it will be focused on near-mine exploration; expectations regarding mineral reserve replacement; and expectations with respect to future work to be conducted at the La Colorada Skarn project.
These forward-looking statements and information reflect the Company's current views with respect to future events and are necessarily based upon a number of assumptions that, while considered reasonable by the Company, are inherently subject to significant operational, business, economic and regulatory uncertainties and contingencies. These assumptions include: the accuracy of our mineral reserve and mineral resource estimates and the assumptions upon which they are based; ore grades and recoveries are as anticipated; prices for silver, gold, and base metals remaining as estimated; currency exchange rates remaining as estimated; capital, decommissioning and reclamation estimates; prices for energy inputs, labour, materials, supplies and services (including transportation); all necessary permits, licenses and regulatory approvals for our operations are received in a timely manner; and our ability to comply with environmental, health and safety laws. The foregoing list of assumptions is not exhaustive.
The Company cautions the reader that forward-looking statements and information involve known and unknown risks, uncertainties and other factors that may cause actual results and developments to differ materially from those expressed or implied by such forward-looking statements or information contained in this news release and the Company has made assumptions and estimates based on or related to many of these factors. Such factors include, without limitation: fluctuations in silver, gold and base metal prices; fluctuations in prices for energy inputs, labour, materials, supplies and services (including transportation); fluctuations in currency markets (such as the PEN, MXN, ARS, BOB, CLP, BRL, GTQ and CAD versus the USD); operational risks and hazards inherent with the business of mining (including environmental accidents and hazards, industrial accidents, equipment breakdown, unusual or unexpected geological or structural formations, cave-ins, flooding and severe weather); employee relations; relationships with, and claims by, local communities and indigenous populations; our ability to obtain all necessary permits, licenses and regulatory approvals in a timely manner; changes in laws, regulations and government practices in the jurisdictions where we operate, including environmental, export and import laws and regulations; legal restrictions relating to mining; risks relating to expropriation; diminishing quantities or grades of mineral reserves as properties are mined; increased competition in the mining industry for equipment and qualified personnel; and those factors identified under the caption "Risks Related to Pan American's Business" in the Company's most recent form 40-F and Annual Information Form filed with the United States Securities and Exchange Commission (the "SEC") and Canadian provincial securities regulatory authorities, respectively. Although the Company has attempted to identify important factors that could cause actual results to differ materially, there may be other factors that cause results not to be as anticipated, estimated, described or intended. Investors are cautioned against undue reliance on forward-looking statements or information. Forward-looking statements and information are designed to help readers understand management's current views of our near and longer term prospects and may not be appropriate for other purposes. The Company does not intend, nor does it assume any obligation to update or revise forward-looking statements or information, whether as a result of new information, changes in assumptions, future events or otherwise, except to the extent required by applicable law.
Cautionary Note to US Investors Regarding References to Mineral Reserves and Mineral Resources
Unless otherwise indicated, all reserve and resource estimates included in this news release have been prepared in accordance with NI 43-101 and the CIM Standards. NI 43-101 is a rule developed by the Canadian Securities Administrators that establishes standards for all public disclosure an issuer makes of scientific and technical information concerning mineral projects. Canadian standards, including NI 43-101, differ significantly from the mineral property disclosure requirements of the SEC (the "U.S. Rules"), and reserve and resource information included herein may not be comparable to similar information disclosed by U.S. companies. In particular, and without limiting the generality of the foregoing, this news release uses the terms "measured resources," "indicated resources" and "inferred resources" as defined in accordance with NI 43-101 and the CIM Standards. Mineralization described using these terms has a greater amount of uncertainty as to its existence and feasibility than mineralization that has been characterized as reserves. Accordingly, U.S. investors are cautioned not to assume that any measured mineral resources, indicated mineral resources, or inferred mineral resources that the Company reports are or will be economically or legally mineable. Further, "inferred mineral resources" have a greater amount of uncertainty as to their existence and as to whether they can be mined legally or economically. Under Canadian securities laws, estimates of "inferred mineral resources" may not form the basis of feasibility or pre-feasibility studies, except in rare cases. While the above terms under the U.S. Rules are "substantially similar" to the standards under NI 43-101 and CIM Standards, there are differences in the definitions under the U.S. Rules and CIM Standards. Accordingly, there is no assurance any mineral reserves or mineral resources that the Company may report as "proven mineral reserves", "probable mineral reserves", "measured mineral resources", "indicated mineral resources" and "inferred mineral resources" under NI 43-101 would be the same had the Company prepared the reserve or resource estimates under the standards adopted under the U.S. Rules.
Andean Silver (ASX:ASL) published an updated resource estimate for its Chile-based Cerro Bayo silver-gold project on Tuesday (September 10), saying silver equivalent ounces have increased by 80 percent.
The resource now stands at 8.3 million tonnes at 342 grams per tonne silver equivalent, which equates to 91 million silver equivalent ounces. In addition to the 80 percent boost in silver equivalent ounces, that's a 64 percent increase in tonnes compared to the previous estimate, which was published in March of this year.
“The updated Resource establishes Cerro Bayo as an outstanding silver asset with genuine scale and high grades,” said CEO Tim Laneyrie, noting that Andean has nearly quadrupled the asset's resource since acquiring it.
The company said the average depth of the resource is less than 300 metres, also stating that significant mining infrastructure is already established at the site. Cerro Bayo is made up of the previously operating Cerro Bayo and Laguna Verde mine complexes, and both of these are included in Andean's new resource estimate.
Also included are underground resources at Lourdes, Marcela and Cerro Bayo that are within the immediate historic Cerro Bayo mine complex; Raul and Guanaco, the other more regional prospects, are encompassed as well.
Not included are drill results and high-grade silver and gold mineralisation intersected since Andean acquired the project. This data will be added in an updated resource estimate planned for release in early 2025.
“The mineralisation remains completely open and we have a pipeline of greenfields targets to drill. This all points to compelling potential for upgrades and further value creation for our shareholders,” Laneyrie said.
Located in Chile’s Aysen region, Cerro Bayo produced over 100 million silver equivalent ounces from 1995 to June 2017. It occupies the western margin of Deseado Massif, a globally recognised epithermal gold-silver province.
Andean's drilling at the project is ongoing.
Don’t forget to follow us @INN_Australia for real-time news updates!
Securities Disclosure: I, Gabrielle de la Cruz, hold no direct investment interest in any company mentioned in this article.
After a steady year, could silver break out alongside the other precious metals in 2024?
The Investing News Network spoke with analysts, market watchers and insiders to get you the most important trends, forecasts and stocks that you need to in the months ahead.
Chen Lin: Silver's Move to US$50 Will be Quick, How I'm Investing Now
Lobo Tiggre: Shopping for Silver Stocks, Watching "Powerful" Gold Mover
Top 5 Canadian Silver Stocks of 2024
A Sneak Peek At What The Insiders Are Saying
“From a pricing standpoint, silver is historically undervalued relative to gold right now, and offers an attractive investment opportunity. We see a picture of silver fundamentals where supply trends cannot keep up with longer-term demand.”
— Maria Smirnova, Sprott
"On a broad brush perspective, I wouldn't want to be in stocks, I wouldn't want to be in bonds, I wouldn't want to be in real estate. I wouldn't want to be in crypto. So where do we go? Precious metals."
— David Morgan, the Morgan Report
"I still think gold is your answer for wealth insurance. But if you're looking for profit, I actually skew it toward silver, and now might be a very good time"
— Rich Checkan, Asset Strategies International
Who We Are
The Investing News Network is a growing network of authoritative publications delivering independent, unbiased news and education for investors. We deliver knowledgeable, carefully curated coverage of a variety of markets including gold, cannabis, biotech and many others. This means you read nothing but the best from the entire world of investing advice, and never have to waste your valuable time doing hours, days or weeks of research yourself.
At the same time, not a single word of the content we choose for you is paid for by any company or investment advisor: We choose our content based solely on its informational and educational value to you, the investor.
So if you are looking for a way to diversify your portfolio amidst political and financial instability, this is the place to start. Right now.
2023 was a relatively lackluster year for silver, which largely traded between US$22 and US$25 per ounce.
The white metal started 2024 on a similar note, with its price remaining fairly rangebound for the first eight weeks of the year. It dropped to US$22.08 on January 21, marking its quarterly low.
Silver started seeing gains in March on expectations that the US Federal Reserve was getting closer to lowering interest rates. Improving sentiment gave precious metals momentum, causing silver to reach its quarterly high of US$25.62 on March 20; it then continued on to an 11 year high of US$29.26 on April 12.
These gains were reinforced by positive language following the Fed's March meeting, when the central bank said inflation was continuing to progress toward its target of 2 percent. Even though it was unwilling to commit to dates, the Fed suggested it was done with hikes and was expecting to make three cuts to its benchmark rate in 2024.
While gold captured attention as it set price records in March and April, silver has produced better returns for investors. In an April 9 email to the Investing News Network (INN), Peter Krauth, editor of Silver Stock Investor and author of "The Great Silver Bull," commented on the white metal's performance during the quarter.
“Silver also typically lags gold, then catches up and surpasses it. We’re starting to see that happen in spades right now. Since the end of February, gold is up about 15 percent, while silver is up about 22 percent," he said.
Krauth emphasized, "Those are breathtaking gains in just a matter of weeks."
According to Krauth, this rise came alongside decreasing inventories at the COMEX, London Bullion Market Association and the Shanghai Gold Exchange, where stockpiles have dropped 40 percent over the past three years.
“The same has happened to silver exchange-traded funds (ETFs) globally. My view is that large silver consumers are buying long contracts and silver ETFs, then taking delivery," he noted.
"That helps explain why the silver price didn’t rise in the face of ongoing deficits. But these inventories are being drained, and I think there may be 12 to 24 months left before they run out."
Industrial demand for silver increasing
Also helping to draw down inventories is industrial demand for silver. The biggest contributing sectors are related to the energy transition, particularly the production of photovoltaics and electric vehicles.
Krauth pointed to the Silver Institute, a top industry association, which is calling for silver to record a structural deficit for the fourth consecutive year in 2024, with shortfalls to continue for several more years.
In its latest World Silver Survey, the Silver Institute states that in 2024, demand for the white metal is forecast to reach the second highest level on record at 1.22 billion ounces, with industrial demand set to see a 9 percent increase to 710.9 million ounces; that would beat out the record set in 2023 at 654.4. million ounces.
India has been a critical driver of demand, importing 94 million ounces of silver in the first two months of 2024, including 71 million ounces in February alone — that represents nearly an entire month of global mine production.
While the Silver Institute notes that demand for silverware and jewelry in India remains strong, it also says there is growing industrial demand as India sees an increasing focus on infrastructure development.
To support local manufacturing, the Indian Ministry of New and Renewable Energy reimposed its Approved List of Models & Manufacturers for solar modules, effective April 1. With the list in place, certain solar projects in the country will be required to use domestically produced photovoltaics.
This comes as new N-type solar cells, which require greater amounts of silver, enter mass production in 2024.
Silver supply unable to keep up with demand
On the supply side, the Silver Institute is predicting a decline of 1 percent in 2024, with 1 billion ounces being made available. Recycled quantities of silver are expected to remain flat at 178.9 million ounces, while the biggest drop is seen coming from mine production, with an estimated total of 823.5 million ounces in 2024.
This differential suggests a widening deficit of 215.3 million ounces, a year-on-year increase of 17 percent.
Silver is primarily produced as a by-product of gold, lead, zinc and copper, with these mines accounting for 595.2 million ounces in 2023. Meanwhile, primary silver mines produced just 235.2 million ounces.
With a contraction in mine output forecast for 2024 and increasing industrial demand over the next several years, the Silver Institute is projecting more tightness over the next few years.
Krauth sees two standout projects set to add millions of ounces over the next year.
“There are two major primary silver projects that stand out. Endeavour Silver (TSX:EDR,NYSE:EXK) is building its Terronera project in Mexico, which will bring about 7 million silver equivalent ounces per year, starting at the end of this year. Then there’s Aya Gold & Silver (TSX:AYA,OTCQX:AYASF), whose Zgounder mine in Morocco is expanding production from about 1.9 million ounces of silver to 8 million ounces, starting with its commissioning in Q2 this year,” he said.
The Silver Institute also sees supply contributions coming from Newmont’s (TSX:NGT,NYSE:NEM) Penasquito mine, which will return to full production in 2024 following strike action in 2023. Meanwhile, Coeur Mining (NYSE:CDE) is expanding its Rochester mine, and Kinross Gold's (TSX:K,NYSE:KGC) Manh Choh project is coming online.
Even with these additions, the Silver Institute sees steep offsets in silver production, including the loss of 17.9 million ounces out of Peru as Hochschild Mining (LSE:HOC,OTCQX:HCHDF) has placed its Pallancata operation into care and maintenance as it waits for permits for its Royropata deposit.
Investor takeaway
Krauth sees strong upside in silver's industrial applications, although he believes many market participants still see it largely as a precious metal. However, attitudes may be starting to change.
This past January, silver producers penned an open letter to the Canadian government, urging it to include the metal on the country's list of critical minerals. While the government won't make a decision until May, silver companies could see new funding options open up if the metal is added, while permitting could be streamlined.
Krauth thinks such a move would boost silver’s status among investors, and is a point to watch in Q2.
“I, along with the entire sector, will be watching closely to see whether silver makes the list or not. If it does, I think that would be a shot in the arm for silver. The broader investment community would pay more attention to silver’s significant structural supply shortages,” he explained to INN.
Krauth wouldn't be surprised to see a pullback in silver this year, but thinks it is in a sustained bull market. He expects the price to continue to hold at US$28, and probably grow to US$30 in the second half of the year.
As silver sees upward momentum going into the next quarter, it may present opportunities for investors who want an alternative to gold, or are keen to take advantage of the white metal’s increasing role as an industrial metal.
Don’t forget to follow us @INN_Resource for real-time updates!
Securities Disclosure: I, Dean Belder, hold no direct investment interest in any company mentioned in this article.
Editorial Disclosure: The Investing News Network does not guarantee the accuracy or thoroughness of the information reported in the interviews it conducts. The opinions expressed in these interviews do not reflect the opinions of the Investing News Network and do not constitute investment advice. All readers are encouraged to perform their own due diligence.
The silver price saw significant gains through the first half of 2024, hitting levels not seen in over a decade.
After starting the year trading in the US$22 per ounce range, the price of silver saw little change until March, when the white metal began to gain momentum following a US Federal Reserve meeting.
While the Fed left interest rates steady at that time, dovish language provided critical support for silver as investors pushed the price above US$25. Silver continued its upward trend through April and into May, when it climbed above US$32 for the first time since November 2012 and set a year-to-date high of US$32.07 on May 27.
Silver price breaks important US$30 level
A number of factors have been driving the price of silver upward in 2024.
Even though rate cuts from the Fed have yet to materialize, softening interest rates and slowing economic growth have led to greater speculation that at least one reduction will come in the second half of the year.
Silver was initially followed gold higher in the March to May period. However, the gains in silver have outpaced gold nearly two to one in 2024. To date, silver has risen nearly 30 percent, while gold has only gained 15 percent.
The pace of these gains has led to improving sentiment among investors. As of April, managed money positions in silver had climbed to their highest level since May 2022, and exchange-traded product holdings rose to their highest since July 2023, as outlined in the Silver Institute’s 2024 World Silver Survey presentation and report.
In an email to the Investing News Network (INN), Silver Institute President and CEO Michael DiRienzo said that the close link between silver and gold has led some investors to use it as a leverage play to gain exposure to gold.
“In addition, silver’s low unit cost and lower entry level have also made it more attractive to retail investors with a limited investment budget,” DiRienzo explained.
This was a point echoed by IndependentSpeculator.com CEO Lobo Tiggre in an interview with INN that took place on July 9. He suggested that even though silver has acted more like an industrial metal over the last several years, 2024 has seen investors once again looking at it for its value as a precious metal.
“That market dynamic has changed, and it’s moving more strongly with gold again as a monetary metal should … I think it's fantastic news for silver — and long-suffering silver bulls out there,” he said.
Industrial silver demand continues climbing in India, China
Improved sentiment has coincided with heightened industrial demand, particularly in the Indian market. Overall, silver demand is projected to grow by 2 percent in 2024, with the Silver Institute forecasting that industrial demand will increase by 9 percent — photovoltaics alone are expected to see a 20 percent gain.
As mentioned, India in particular has upped its silver purchases in 2024. Its imports came to a record 2,295 metric tons of silver in February, nearly outstripping an entire month of global mine supply. Though purchases have waned as prices have risen, the first four months of the year saw India import more silver than it did for all of 2023.
DiRienzo said that while the primary silver demand in India continues to be from the production of jewelry, the precious metal has also benefited from “firmer electrical & electronics demand, thanks to the continued strength in India’s real estate market and rising investment in local infrastructure construction.”
Additionally, he noted that Indian manufacturing of solar cells received additional support as companies reduced their reliance on Chinese manufacturing and diversified their supply lines for solar panels.
India has been the biggest driver in the photovoltaics category as the country continues building up its domestic solar supply chain through efforts such as its Approved List of Models and Manufacturers, which consists wholly of domestic companies. After a pause due to supply concerns last year, the nation's government reinstated the mandate as of April 1 of this year — as a result, government-funded and subsidized solar projects in India must source their solar photovoltaic modules from one of the companies included on the list.
Even so, China remains the global leader in photovoltaics production. And with new N-Type TopCon panels — which require 50 percent more silver — set to become the industry standard, industrial demand is set to rise even further.
Last year, a flagging Chinese economy not only put base metals under pressure, but dragged on silver as well. According to DiRienzo, fiscal stimulus measures implemented by the Chinese government have provided crucial support.
“Expectations on further fiscal stimulus for the Chinese economy led to a sharp rebound in base metal prices during 2024-to-date, which has benefited silver,” he said.
New silver mine supply won't outweigh deficit
While both retail and industrial demand is growing, it’s not just demand driving prices.
Silver is also facing a severe supply crisis as a deficit that began to emerge in 2021 continues to widen, with the Silver Institute forecasting that the deficit will reach 215 million ounces by the end of 2024.
According to the Silver Institute, Mexico and Argentina had steep output declines in 2023, with production falling by 10.9 million ounces and 4.9 million ounces, respectively. The Silver Institute predicts that global production will fall further in 2024 to 823.5 million ounces due to the closure of several mines in Peru.
While it isn’t expected to eclipse these declines, new silver supply is coming online from various sources this year.
The Silver Institute forecasts an increase from Mexico this year now that Newmont’s (TSX:NGT,NYSE:NEM) Peñasquito mine is back at full operating capacity following a strike in 2023. Additionally, Endeavour Silver (TSX:EDR,NYSE:EXK) announced in April that its Terronera project was more than 50 percent complete and on schedule to begin production at the end of 2024. The mine will add 4 million ounces of silver supply to global markets annually.
The US is also increasing its silver output this year. Hecla Mining Company's (NYSE:HL) Lucky Friday mine in Idaho returned to full production in March, while the expansion at Coeur Mining’s (NYSE:CDE) Rochester silver-gold mine in Nevada entered commercial operation at the end of the first quarter. Once fully ramped up, it will be the largest domestic source of silver in the US, processing 32 million metric tons of ore per year.
Aya Gold and Silver (TSX:AYA,OTCQX:AYASF) provided an update on progress at its Zgounder mine expansion in Morocco on July 9, announcing it had made the first silver pour. The company said it remains on schedule for commercial production to begin in Q4. Once fully ramped up, the expanded mine is expected to produce 6.8 million ounces of silver per year, a significant increase from its 2023 output of 1.97 million ounces.
Despite these new and expanded mining operations bringing significant new silver supply to the market, it’s still a far cry from meeting the more than 200 million ounce deficit.
How high can the silver price rise in 2024?
While gold tends to garner more of the media attention, silver has already been a stronger performer in 2024. Since its move began this year, a variety of experts have suggested the white metal has further to go.
In an interview with INN on July 3, Chris Vermeulen, chief market strategist at TheTechnicalTraders.com, suggested that silver is at a multi-year consolidation. He thinks a run over the next few months to US$36 per ounce is a possibility.
Peter Krauth, editor of Silver Stock Investor, told INN on May 24 that silver might experience a slight pullback over the next couple of months, but would likely establish a new floor at US$30. This came to pass as silver traded in the US$29 range in June before stabilizing above US$30 through the first half of July.
“We still have the gold-to-silver ratio somewhere around 75; it's averaged about 55 or 60 over the last few decades, so just on that basis if gold were to stay put, silver has a lot higher to go,” Krauth said.
“Typically when you get the ratio running down, both metals do well, but silver continues to do even better … so look for this to be a really tremendous run over the next months and years," he added.
While this might not be good news for manufacturers that require silver and consumers who buy their products, it's positive news for existing silver investors and new market participants who are looking for opportunities for a safe-haven investment that doesn’t come with the high entry point of gold.
There are also opportunities in silver stocks, which have been undervalued in recent years — in fact, many silver stocks have already seen significant gains this year. For example, silver producer Endeavour Silver and advanced development-stage companies GR Silver Mining (TSXV:GRSL,OTCQB:GRSLF) and Defiance Silver (TSXV:DEF,OTCQX:DNCVF) have all gained more than 100 percent from the start of the year through July 9.
Don’t forget to follow us @INN_Resource for real-time updates!
Securities Disclosure: I, Dean Belder, hold no direct investment interest in any company mentioned in this article.
Editorial Disclosure: The Investing News Network does not guarantee the accuracy or thoroughness of the information reported in the interviews it conducts. The opinions expressed in these interviews do not reflect the opinions of the Investing News Network and do not constitute investment advice. All readers are encouraged to perform their own due diligence.
Affiliate Disclosure: The Investing News Network may earn commission from qualifying purchases or actions made through the links or advertisements on this page.
Chen Lin: Silver's Move to US$50 Will be Quick, How I'm Investing Now
Speaking to the Investing News Network, Chen Lin of Lin Asset Management shared his outlook for silver, explaining that the white metal could move quickly to the US$50 per ounce level once market participants realize how large the divide between supply and demand really is.
When asked about the most important drivers for silver right now, he pointed to the solar industry, noting that two to three years ago it was consuming 100 million ounces of silver; that amount rose to 200 million ounces last year.
This year, the Silver Institute is projecting a further 40 million ounces of solar demand, but Lin thinks the sector may end up requiring an extra 100 million ounces, bringing its total usage to 300 million ounces for 2024.
"From all the data I get, it's 100 million ... so from 200 million to 300 million," he said. A new report out of Germany has an even higher projection, forecasting that the solar market could consume 400 million ounces of silver this year.
"My point is that once investors see the huge deficit, they truly see the huge deficit in silver, silver will go to US$50 just like that — just in a heartbeat," Lin said, adding that so far most market participants haven't gotten there.
When asked how he's getting exposure to silver, Lin said he's heavily exposed in the future market. However, he doesn't recommend that path for everyone as the leverage involved can be highly risky.
He's also looking at silver miners, which he believes are cheap. "Silver miners are going to have a huge Q2 — gold miners too, but silver in particular," he said, noting that the average silver price will be much higher than it was in Q1.
"If they are not making money at US$20 (silver), at US$30 suddenly there's a huge profit," he said.
Watch the interview above for more from Lin on his outlook for silver and ways to invest.
Don't forget to follow us @INN_Resource for real-time updates!
Securities Disclosure: I, Charlotte McLeod, hold no direct investment interest in any company mentioned in this article.
Editorial Disclosure: The Investing News Network does not guarantee the accuracy or thoroughness of the information reported in the interviews it conducts. The opinions expressed in these interviews do not reflect the opinions of the Investing News Network and do not constitute investment advice. All readers are encouraged to perform their own due diligence.
Lobo Tiggre: Shopping for Silver Stocks, Watching "Powerful" Gold Mover
Lobo Tiggre, CEO of IndependentSpeculator.com, shared his updated thoughts on gold, silver and uranium.
When it comes to gold, he pointed to a "powerful mover" that he thinks could be in play — a change in global portfolio allocations to the yellow metal. Historically the allocation has been 2 percent, but more recently it's been 0.5 percent.
"I think that what we're seeing is that changing. And maybe it doesn't go back to 2 percent, but if it just goes back to 1 percent, that doubles the investment demand for gold from where we are now," he said.
Looking at silver, he said lately it's correlated more closely to copper than to gold; however, that dynamic now seems to be changing. "I think it's fantastic — not just good — I think it's fantastic news for silver ... that it's acting as a monetary metal should," he said at the Rule Symposium, held last week in Boca Raton, Florida.
With that in mind, Tiggre and his team are on the lookout for stocks that meet his criteria. One of those is jurisdiction — while he's seen strong discoveries in places like Mexico, the political risk is too high for him to be interested.
Watch the interview above for more from Tiggre on gold and silver, as well uranium.
You can also click here to view the Investing News Network's Rule Symposium playlist on YouTube. Recorded presentations from the Rule Symposium are available here.
Don't forget to follow us @INN_Resource for real-time updates!
Securities Disclosure: I, Charlotte McLeod, hold no direct investment interest in any company mentioned in this article.
Editorial Disclosure: The Investing News Network does not guarantee the accuracy or thoroughness of the information reported in the interviews it conducts. The opinions expressed in these interviews do not reflect the opinions of the Investing News Network and do not constitute investment advice. All readers are encouraged to perform their own due diligence.
Affiliate Disclosure: The Investing News Network may earn commission from qualifying purchases or actions made through the links or advertisements on this page.
2024 has been positive for silver stocks. A variety of factors pushed the white metal's price higher during the second quarter, allowing it to break the US$30 per ounce mark for the first time since 2012.
According to the Silver Institute, demand for silver is set to outstrip mine supply for the third year in a row, due in part to rising consumption from sectors dependent on the energy transition, including photovoltaics and electric vehicles.
India in particular has seen demand soar after introducing regulations for domestic production for new solar projects; that led the country to import more silver in the first four months of the year than all of 2023.
How has silver's price movement benefited Canadian silver stocks on the TSX and TSXV? The five companies listed below have seen the best performances since the start of the year. Data was gathered using TradingView's stock screener on August 26, 2024, and all companies listed had market caps over C$10 million at that time.
Explorer Defiance Silver is working to advance its district-scale Zacatecas silver project in Zacatecas, Mexico.
The project consists of a 4,300 hectare land package and includes four project areas: San Acacio, Lucito, Panuco and Lagartos. Both San Acacio and Lagartos have seen previous exploration and mining activity.
On January 15, the company announced results from its 2023 drill program at the San Acacio target, reporting well-developed silver and zinc values with elevated gold and copper. This includes a highlighted assay of 223.53 g/t silver over 12.82 meters with an interval of 306.86 g/t silver over 7.79 meters.
Defiance provided an update on April 15 on a surface-sampling campaign at the Lucita target. The results show widespread high-grade polymetallic mineralization, with Defiance highlighting grades of up to 795 g/t silver from Lucita North and 2,350 g/t silver from Lucita South. The company said the results reinforce the district-scale potential at Zacatecas.
Shares of Defiance reached a year-to-date high of C$0.425 on May 15.
GR Silver Mining is a small-cap explorer and developer that is working to advance its Rosario Mining District in Sinaloa, Mexico, to production. The district consists of three core mining areas: Plomosas, San Marcial and La Trinidad.
The company’s primary focus has been the development of Plomosas and neighboring San Marcial, a 9,764 hectare land package that hosts a past-producing silver, gold, lead and zinc underground mine.
In March 2023, the company released an updated resource estimate for Plomosas showing total indicated quantities of 97 million silver equivalent ounces, with additional inferred quantities of 53 million silver equivalent ounces.
Shares of GR Silver saw significant gains in the first quarter alongside a rising silver price and a March 4 news release. In the announcement, GR Silver reported that it had started small bulk sampling and test mining at Plomosas.
In an update on June 27, the company provided results from the sampling program. In the report, GR Silver said it had completed 280 meters of underground development and processed 15,170 metric tons of material. Silver recovery rates from the samples were between 84 and 92 percent. Assays from channel sampling produced high grades, with one sample grading 1,625 grams per metric ton (g/t) silver and 14.1 g/t gold over 2.5 meters.
GR Silver's share price reached a year-to-date high of C$0.23 on June 2.
Gatos Silver is a silver-focused production and exploration company. Its flagship asset is the Cerro Los Gatos mine and district, located south of Chihuahua City, Mexico.
The site consists of 14 predominantly silver, lead and zinc mineralization zones, and is a joint venture with Dowa Metals and Mining, which holds a 30 percent stake in the operation; Gatos owns the remaining 70 percent.
On February 21, the company released its full-year results for 2023, indicating it had produced 9.2 million ounces of silver, marking a decline from the 10.3 million ounces produced in 2022. However, the company said it improved operational efficiencies to offset inflationary pressure, lowering all-in-sustaining costs (AISC) to the lower end of 2023 guidance.
In the release, Gatos also notes that it expects similar production totals for 2024, with guidance of 8.4 million to 9.2 million ounces of silver at an AISC of US$9.50 to US$11.50 per payable ounce. The company said it anticipates that exploration efforts at the South-East Deeps target will further extend the life of the mine.
The most recent news from the project came on July 23, when Gatos reported continued results from the South East Deeps zone extension drilling alongside an update on regional exploration programs. In the announcement, the company provided a highlighted assay of 214 g/t silver over 3.5 meters.
Results from its ongoing drilling at the Portigueño target included a highlight of 49 g/t silver over 1.6 meters, while results from two holes testing the depth of the San Luis target produced a highlighted intercept more than 150 meters below surface of 66 g/t silver over 8.9 meters, which included 111 g/t silver over 2.5 meters.
In an update on August 6, Gatos reported that silver production through the first six months of 2024 was 4.67 million ounces, up from 4.43 million ounces from the same period in 2023. The company also said it remained on track to achieve 2024 production and cost guidance.
Shares of Gatos reached a year-to-date high of C$19.29 on July 15.
Avino Silver and Gold Mines is a precious metals miner with two primary silver assets: the producing Avino silver mine and the neighboring La Preciosa project in Durango, Mexico.
The Avino mine is capable of processing 2,500 MT of ore per day ore, and in 2023 produced 928,643 ounces of silver, 7,335 ounces of gold and 5.3 million pounds of copper. While within the company's guidance, there was a 6 percent decrease in silver production over 2022, when it produced 985,195 ounces in the same time period.
In addition to its Avino mining operation, Avino is working to advance its La Preciosa project toward the production stage. The site covers 1,134 hectares, and according to a February 2023 resource estimate, holds measured and indicated quantities of 98.59 million ounces of silver and 189,190 ounces of gold.
On February 28, the company provided an update for La Preciosa, saying it was preparing for the first phase of production at the Gloria and Abundancia veins. Avino also said it has the equipment needed to commence operations at the site once it receives the necessary environmental permits, which it expects later in 2024.
In its Q2 2024 results released on August 13, Avino reported that it had generated record quarterly revenues of C$14.8 million during the second quarter, an increase of 60 percent over the same quarter in 2023. Additionally, the company said it had produced 543,589 ounces of silver through the first half of the year, a 16 percent increase from the 466,755 ounces of silver in the six months of 2023.
Avino's share price marked a year-to-date high of C$1.51 on May 26.
Endeavour Silver is a silver company with two operating silver-gold mines in Mexico — Guanaceví and Bolañitos — plus an advanced-stage development project and several exploration properties.
Its primary focus for 2024 has been the development of its Terronera project in Jalisco, Mexico, which is under construction. Once complete, the new mine will become the company’s flagship operation. According to a 2023 update to its 2021 feasibility report, Terronera will produce an estimated 4 million ounces of silver per year over a 10 year mine life.
The most recent update from Terronera came on July 24, when the company announced that construction at the site had progressed, with surface construction achieving 77 percent completion. The company said the upper platform was progressing and should be ready for dry commissioning during Q3 2024 and that it was concentrating on the lower platform with final earthworks and concrete pouring also during the third quarter.
In an update on August 19, Endeavour reported that processing at its Guanacevi mine site had resumed following a failure that occurred at the primary ball mill trunnion on August 12. However, the company noted that processing would be less than half of its 1,200 metric ton per day capacity during a ramp up with temporary modifications. Permanent repairs to return to regular capacity are expected to take 16 weeks for fabrication and installation.
The company said that silver production for the year is estimated to decrease by 900,000 to 1.1 million ounces and has recalculated its 2024 guidance to 4.4 to 4.6 million ounces.
Shares of Endeavour reached a year-to-date high of C$6.80 on July 15.
Don’t forget to follow us @INN_Resource for real-time news updates!
Securities Disclosure: I, Dean Belder, hold no direct investment interest in any company mentioned in this article.
First Majestic Silver Corp. (NYSE: AG) (TSX: AG) (FSE: FMV) (the "Company" or "First Majestic") announces that the Toronto Stock Exchange ("TSX") has accepted for filing First Majestic's Notice of Intention to Make a Normal Course Issuer Bid (the "Share Repurchase Program") to be transacted through the facilities of the TSX andor through Canadian alternative trading systems.
Pursuant to the NCIB, First Majestic may, during the 12-month period commencing September 12, 2024, and ending on or before September 11, 2025, purchase up to 10,000,000 of its common shares ("Shares"), being approximately 3.32% of the 301,616,350 issued and outstanding Shares as of September 4, 2024. All purchases under the Share Repurchase Program will be made at prevailing market prices.
First Majestic may purchase up to a daily maximum of 193,454 Shares (being 25% of the average daily trading volume of the Shares for the last six calendar months, which was 773,816 Shares), subject to the TSX rules permitting block purchases. Any purchases under the Share Repurchase Program will depend on future market conditions, and any Shares purchased by the Company will be cancelled. Purchases under the Share Repurchase Program will be made by First Majestic's broker based upon the parameters prescribed by the TSX and by applicable law. First Majestic has not repurchased any of its Shares by way of a normal course issuer bid in the previous 12 months.
First Majestic believes that, from time to time, the market price of its Shares may not fully reflect the underlying value of the Company's business and its future business prospects. The Company believes that at such times the purchase of Shares would be in the best interests of the Company. Such purchases are expected to benefit all shareholders by increasing their proportionate equity interest in the Company.
About First Majestic
First Majestic is a publicly traded mining company focused on silver and gold production in Mexico and the United States. The Company presently owns and operates the San Dimas Silver/Gold Mine, the Santa Elena Silver/Gold Mine, and the La Encantada Silver Mine as well as a portfolio of development and exploration assets, including the Jerritt Canyon Gold project located in northeastern Nevada, U.S.A.
First Majestic is proud to own and operate its own minting facility, First Mint, LLC, and to offer a portion of its silver production for sale to the public. Bars, ingots, coins and medallions are available for purchase online at www.firstmint.com, at some of the lowest premiums available.
This news release contains "forward‐looking information" and "forward-looking statements" under applicable Canadian and United States securities laws (collectively, "forward‐looking statements"). Forward-looking statements in this news release include, but are not limited to, statements with respect to potential purchases of Shares under the Company's NCIB bid and the timing of such purchases. Often, but not always, forward-looking statements can be identified by the use of words such as "plans", "expects", "is expected", "budget", "scheduled", "estimates", "forecasts", "intends", "anticipates", or "believes" or variations (including negative variations) of such words and phrases, or state that certain actions, events or results "may", "could", "would", "might" or "will" be taken, occur or be achieved. Forward-looking statements involve known and unknown risks, uncertainties and other factors which may cause the actual results, performance or achievements of the Company to be materially different from any future results, performance or achievements expressed or implied by the forward-looking statements. Factors that could cause actual results to differ materially from those anticipated in these forward-looking statements are discussed in the section entitled "Description of the Business - Risk Factors" in the Company's most recent Annual Information Form for the year ended December 31, 2023 filed with the Canadian securities regulatory authorities under the Company's SEDAR+ profile at www.sedarplus.ca, and in the Company's Annual Report on Form 40-F for the year ended December 31, 2023 filed with the United States Securities and Exchange Commission on EDGAR at www.sec.gov/edgar.
Although the Company has attempted to identify important factors that could cause actual results to differ materially from those contained in forward-looking statements, there may be other factors that cause results not to be as anticipated, estimated or intended. Accordingly, the reader is cautioned not to place undue reliance on forward-looking statements. Forward-looking statements contained herein are made as of the date of this news release and the Company disclaims, other than as required by law, any obligation to update any forward-looking statements whether as a result of new information, results, future events, circumstances, or if management's estimates or opinions should change, or otherwise.
Brodsky & Smith reminds investors of the following investigations. If you own shares and wish to discuss the investigation, contact Jason Brodsky ( jbrodsky@brodskysmith.com ) or Marc Ackerman ( mackerman@brodskysmith.com ) at 855-576-4847. There is no cost or financial obligation to you.
Under the terms of the agreement, Iteris will be acquired by Almaviva S.p.A. ("Almaviva") for $7.20 per share in cash upon completion of the proposed transaction. The investigation concerns whether the Iteris Board breached its fiduciary duties to shareholders by failing to conduct a fair process, including whether Almaviva is paying fair value to shareholders of the Company.
Under the terms of the Merger Agreement, Forza X1 will be acquired by Twin Vee PowerCats Co. ("Twin Vee") (Nasdaq -VEEE). Each holder of Forza Common Stock (other than Twin Vee) will receive 0.61166627 shares of Twin Vee Common Stock. On closing, holders of Twin Vee and Forza would beneficially own approximately 64% and 36%, respectively, of the outstanding shares of Twin Vee Common Stock. The investigation concerns whether the Forza X1 Board breached its fiduciary duties to shareholders by failing to conduct a fair process, including whether Twin Vee is paying fair value to shareholders of the Company.
Under the terms of the agreement, Titan will be acquired by KE Sdn. Bhd. ("KE"). On the closing of the transaction, Titan Pharmaceuticals stockholders will own only 13% of the combined company. The investigation concerns whether the Titan Pharmaceuticals Board breached its fiduciary duties to shareholders by failing to conduct a fair process, including whether KE is paying fair value to shareholders of the Company.
Under the terms of the agreement, Gatos Silver will be acquired by First Majestic Silver Corp. ("First Majestic") (NYSE -AG) (TSX - AG) (FSE -FMV). Gatos Silver shareholders will receive 2.550 common shares of First Majestic for each common share of Gatos Silver held. The consideration implies a total offer value of US$13.49 per common share of Gatos based on the closing price of First Majestic's common shares on the NYSE on September 4, 2024.
The investigation concerns whether the Gatos Silver Board breached its fiduciary duties to shareholders by failing to conduct a fair process, including whether First Majestic is paying fair value to shareholders of the Company.
Brodsky & Smith is a litigation law firm with extensive expertise representing shareholders throughout the nation in securities and class action lawsuits. The attorneys at Brodsky & Smith have been appointed by numerous courts throughout the country to serve as lead counsel in class actions and have successfully recovered millions of dollars for our clients and shareholders. Attorney advertising. Prior results do not guarantee a similar outcome.
First Majestic Silver (TSX:FR,NYSE:AG) announced plans on Thursday (September 5) to acquire Gatos Silver (TSX:GATO,NYSE:GATO) in a stock-based transaction valued at about US$970 million.
The new entity's anticipated annual production is 30 million to 32 million silver equivalent ounces.
If approved, the deal will see First Majestic absorb Gatos' assets, including its 70 percent interest in the Los Gatos joint venture, which operates the Cerro Los Gatos silver mine in Chihuahua, Mexico.
This mine, along with First Majestic’s existing operations at San Dimas and Santa Elena, will consolidate First Majestic’s portfolio into three major silver-producing districts in Mexico.
Under the terms of the agreement, First Majestic will acquire all outstanding shares of Gatos, while the latter’s shareholders will receive 2.55 common shares of First Majestic for each Gatos share they hold.
This consideration translates to a value of US$13.49 per Gatos share based on the closing price of First Majestic shares on the NYSE on Wednesday (September 4). The transaction represents a 16 percent premium based on the closing prices and 20 day volume-weighted average prices of the two companies' shares.
“Mexico is a country that First Majestic has operated in for over 20 years, and we are extremely excited to deploy our operating expertise within these mining districts to deliver operational synergies and exploration success for our shareholders," Keith Neumeyer, president and CEO of First Majestic, said in the company's press release.
The company aims to use its operational expertise to enhance the development of Cerro Los Gatos and integrate it with its existing assets to improve efficiencies and expand exploration opportunities.
Dale Andres, CEO of Gatos, expressed enthusiasm for the deal with First Majestic as well.
"This transaction also provides our shareholders with the benefits of First Majestic’s enhanced capital markets presence, liquidity and balance sheet, while combining its local Mexican expertise and history of operations with our history of successful performance," he said, highlighting First Majestic’s status as a well-established silver producer.
The transaction is expected to close in early 2025, subject to conditions and to approval from both companies’ shareholders, as well as clearance on both the New York and Toronto stock exchanges.
Don't forget to follow us @INN_Resource for real-time updates!
Securities Disclosure: I, Giann Liguid, hold no direct investment interest in any company mentioned in this article.
Investing News Network websites or approved third-party tools use cookies. Please refer to the cookie policy for collected data, privacy and GDPR compliance. By continuing to browse the site, you agree to our use of cookies.