The Conversation (0)

Jiayin Group Inc. ("Jiayin" or the "Company") (NASDAQ: JFIN), a leading fintech platform in China, today announced its unaudited financial results for the third quarter ended September 30, 2025.
Third Quarter 2025 Operational and Financial Highlights:
_______________________
1 "Loan facilitation volume" refers to the loan facilitation volume facilitated in Chinese Mainland during the period presented.
2 "Repeat borrower contribution" for a given period refers to the percentage of loan facilitation volume in Chinese Mainland attributable to repeat borrowers during that period.
"Repeat borrowers" during a certain period refers to borrowers who have borrowed in such period and have borrowed at least twice since such borrowers' registration on our platform until the end of such period.
3 "90 day+ delinquency ratio" refers to the outstanding principal balance of loans that were 91 to 180 calendar days past due as a percentage of the total outstanding principal balance of loans facilitated through the Company's platform as of a specific date. Loans facilitated outside Chinese Mainland are not included in the calculation.
4 Please see the section entitled "Use of Non-GAAP Financial Measure" below and the table captioned "Unaudited Reconciliations of GAAP and Non-GAAP Results" set forth at the end of this press release.
Mr. Yan Dinggui, the Company's Founder, Director and Chief Executive Officer, commented: "In the third quarter, we anchored our strategic focus on fortifying operational resilience and advancing prudent risk management. Despite the uncertainty in the macro environment, we reached our previously stated guidance of RMB32.2 billion in loan facilitation volume and RMB490.6 million in Non-GAAP income from operation. We have actively engaged with our financial institution partners to adapt to regulatory changes, while advancing our AI technologies and refining operational work flows, collectively elevating the quality and efficiency of our facilitation services. These efforts lay a robust foundation for sustainable growth. Looking ahead, we remain committed to further consolidating our competitive edge in core domains, ensuring the Company stays at the vanguard of fintech innovation while delivering enduring, stakeholder-centric value."
Third Quarter 2025 Financial Results
Net revenue was RMB1,470.2 million (US$206.5 million), representing an increase of 1.8% from the same period of 2024.
Revenue from loan facilitation services was RMB1,220.7 million (US$171.5 million), representing an increase of 10.4% from the same period of 2024. The increase was primarily attributable to higher loan facilitation volume, partially offset by service fee adjustments.
Revenue from releasing of guarantee liabilities was RMB151.8 million (US$21.3 million) compared with RMB251.7 million in the same period of 2024. The year-over-year decrease was primarily due to the decrease in average outstanding loan balances for which the Company provided guarantee services.
Other revenue was RMB97.7 million (US$13.7 million), compared with RMB87.5 million for the same period of 2024. The increase was primarily due to the increase in the contribution from referral fees.
Facilitation and servicing expense was RMB286.5 million (US$40.2 million) compared with RMB419.1 million for the same period of 2024. This was primarily due to decreased expenses related to financial guarantee services.
Allowance for uncollectible receivables, contract assets, loans receivable and others was RMB1.5 million (US$0.2 million), representing a decrease of 87.1% from the same period of 2024, primarily due to decreased allowance for oversea loans as a result of disposal of Nigeria entities during 2024 and growth slowdown of receivables from loan facilitation business.
Sales and marketing expense was RMB544.2 million (US$76.4 million), representing a decrease of 1.1% from the same period of 2024.
General and administrative expense was RMB72.4 million (US$10.2 million), representing an increase of 29.0% from the same period of 2024, primarily driven by an increase in share-based compensation.
Research and development expense was RMB108.7 million (US$15.3 million), representing an increase of 13.3% from the same period of 2024, primarily driven by an increase in expenditures for employee compensation and related benefits.
Income from operation was RMB456.9 million (US$64.2 million), representing an increase of 46.5% from the same period of 2024.
N on-GAAP income from operation was RMB490.6 million (US$68.9 million), compared with RMB326.5 million in the same period of 2024.
Net income was RMB376.5 million (US$52.9 million), representing an increase of 39.7% from the same period of 2024.
Basic and diluted net income per share were both RMB1.83 (US$0.26) compared with RMB1.27 in the third quarter of 2024. Basic and diluted net income per ADS were both RMB7.32 (US$1.04) compared with RMB5.08 in the third quarter of 2024. Each ADS represents four Class A ordinary shares of the Company.
Cash and cash equivalents were RMB124.2 million (US$17.4 million) as of September 30, 2025, compared with RMB316.2 million as of June 30, 2025.
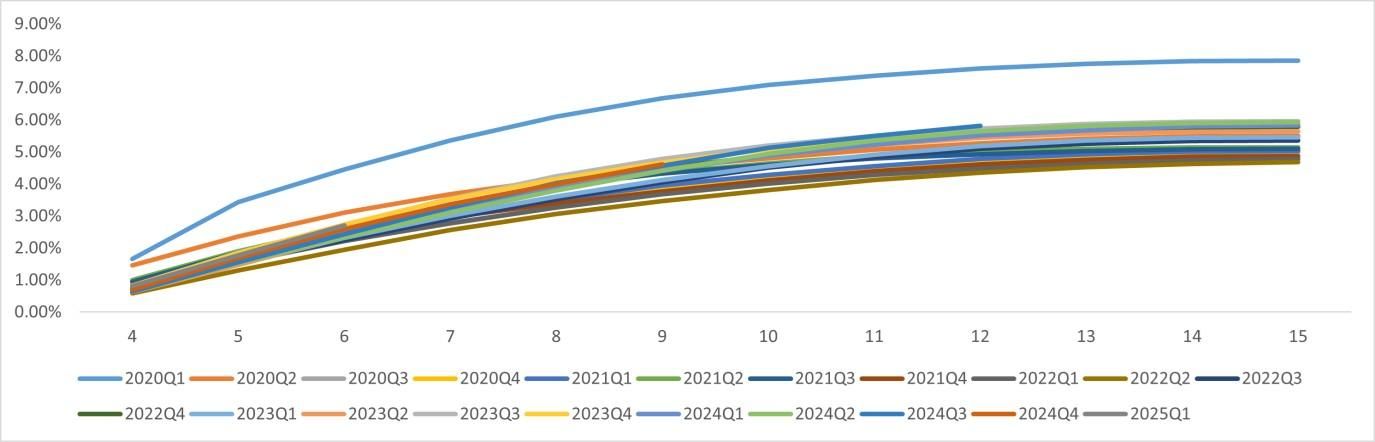
The following chart and table display the historical cumulative M3+ Delinquency Rate by Vintage for loan products facilitated through the Company's platform in Chinese Mainland.
Business Outlook
The Company expects its loan facilitation volume for the full year of 2025 to be in the range of RMB127.8 billion to RMB129.8 billion and its loan facilitation volume for the fourth quarter of 2025 to be in the range of RMB23.0 billion to RMB25.0 billion. The Company expects its non-GAAP income from operation for the full year of 2025 to be in the range of RMB1.99 billion to RMB2.06 billion. This forecast reflects the Company's current and preliminary views on the market and operational conditions, which are subject to change.
Recent Development
Share Repurchase Plan Update
In August 2025, the Board approved an adjustment to the existing share repurchase plan, pursuant to which the aggregate value of ordinary shares authorized for repurchase under the plan through June 12, 2026 shall not exceed US$80 million.
As of November 25, 2025, the Company had repurchased approximately 4.6 million of its ADSs for approximately US$30.4 million.
Conference Call
The Company will conduct a conference call to discuss its financial results on November 25, 2025, at 7:00 AM U.S. Eastern Time (8:00 PM Beijing/Hong Kong Time on the same day).
To join the conference call, all participants must use the following link to complete the online registration process in advance. Upon registering, each participant will receive access details for this event including the dial-in numbers, a PIN number, and an e-mail with detailed instructions to join the conference call.
Participant Online Registration:
https://register-conf.media-server.com/register/BIda039f786aa74135bac411589553e68a
A live and archived webcast of the conference call will be available on the Company's investors relations website at http://ir.jiayintech.cn/ .
About Jiayin Group Inc.
Jiayin Group Inc. is a leading fintech platform in China committed to facilitating effective, transparent, secure and fast connections between underserved individual borrowers and financial institutions. The origin of the business of the Company can be traced back to 2011. The Company operates a highly secure and open platform with a comprehensive risk management system and a proprietary and effective risk assessment model which employs advanced big data analytics and sophisticated algorithms to accurately assess the risk profiles of potential borrowers. For more information, please visit http://ir.jiayintech.cn/ .
Use of Non-GAAP Financial Measure
We use non-GAAP income from operation, which is a non-GAAP financial measure, in evaluating our operating results and for financial and operational decision-making purposes. We believe that the non-GAAP financial measure helps identify underlying trends in our business by excluding the impact of share-based compensation expenses. We believe that non-GAAP financial measure provides useful information about our operating results, enhances the overall understanding of our past performance and future prospects and allows for greater visibility with respect to key metrics used by our management in its financial and operational decision-making.
Non-GAAP income from operation represents income from operation excluding share-based compensation expenses. Such adjustment has no impact on income tax.
Non-GAAP income from operation is not defined under U.S. GAAP and is not presented in accordance with U.S. GAAP. The non-GAAP financial measure has limitations as analytical tool, and when assessing our operating performance, cash flows or our liquidity, investors should not consider it in isolation, or as a substitute for income from operation, net income, cash flows provided by operating activities or other consolidated statements of operation and cash flow data prepared in accordance with U.S. GAAP. The Company encourages investors and others to review our financial information in its entirety and not rely on a single financial measure.
For more information on this non-GAAP financial measure, please see the table captioned "Unaudited Reconciliations of GAAP and Non-GAAP results" set forth at the end of this press release.
Exchange Rate Information
This announcement contains translations of certain RMB amounts into U.S. dollars ("US$") at a specified rates solely for the convenience of the reader. Unless otherwise noted, all translations from RMB to U.S. dollars are made at a rate of RMB7.1190 to US$1.00, the exchange rate set forth in the H.10 statistical release of the Board of Governors of the Federal Reserve System as of September 30, 2025. The Company makes no representation that the RMB or US$ amounts referred could be converted into US$ or RMB, as the case may be, at any particular rate or at all.
Safe Harbor / Forward-Looking Statements
This announcement contains forward-looking statements. These statements are made under the "safe harbor" provisions of the United States Private Securities Litigation Reform Act of 1995. These forward-looking statements can be identified by terminology such as "will," "expects," "anticipates," "future," "intends," "plans," "believes," "estimates" and similar statements. The Company may also make written or oral forward-looking statements in its periodic reports to the SEC, in its annual report to shareholders, in press releases and other written materials and in oral statements made by its officers, directors or employees to third parties. Statements that are not historical facts, including statements about the Company's beliefs and expectations, are forward-looking statements. Forward-looking statements involve inherent risks and uncertainties and are based on current expectations, assumptions, estimates and projections about the Company and the industry. Potential risks and uncertainties include, but are not limited to, those relating to the Company's ability to retain existing investors and borrowers and attract new investors and borrowers in an effective and cost-efficient way, the Company's ability to increase the investment volume and loan facilitation of loans volume facilitated through its marketplace, effectiveness of the Company's credit assessment model and risk management system, PRC laws and regulations relating to the online individual finance industry in China, general economic conditions in China, and the Company's ability to meet the standards necessary to maintain listing of its ADSs on the Nasdaq Stock Market or other stock exchange, including its ability to cure any non-compliance with the continued listing criteria of the Nasdaq Stock Market. All information provided in this press release is as of the date hereof, and the Company undertakes no obligation to update any forward-looking statements to reflect subsequent occurring events or circumstances, or changes in its expectations, except as may be required by law. Although the Company believes that the expectations expressed in these forward-looking statements are reasonable, it cannot assure you that its expectations will turn out to be correct, and investors are cautioned that actual results may differ materially from the anticipated results. Further information regarding risks and uncertainties faced by the Company is included in the Company's filings with the U.S. Securities and Exchange Commission, including its annual report on Form 20-F.
For investor and media inquiries, please contact:
Ms. Emily Lu
Email: ir@jiayinfintech.cn
| Jiayin Group Inc. UNAUDITED CONDENSED CONSOLIDATED BALANCE SHEETS (Amounts in thousands, except for share and per share data) | |||||||||
| As of December 31, | As of September 30, | ||||||||
| 2024 | 2025 | ||||||||
| RMB | RMB | US$ | |||||||
| ASSETS | |||||||||
| Cash and cash equivalents | 540,523 | 124,151 | 17,439 | ||||||
| Restricted cash | 137,332 | 351,652 | 49,396 | ||||||
| Accounts receivable and contract assets, net | 2,991,166 | 4,168,396 | 585,531 | ||||||
| Financial assets receivables, net | 293,483 | 543,348 | 76,324 | ||||||
| Prepaid expenses and other current assets, net | 377,978 | 910,911 | 127,955 | ||||||
| Deferred tax assets, net | 72,405 | 81,389 | 11,433 | ||||||
| Property and equipment, net | 44,397 | 1,338,395 | 188,003 | ||||||
| Right-of-use assets | 52,759 | 37,301 | 5,240 | ||||||
| Long-term investment, net | 162,267 | 318,926 | 44,799 | ||||||
| Other non-current assets | 737,583 | 33,854 | 4,755 | ||||||
| TOTAL ASSETS | 5,409,893 | 7,908,323 | 1,110,875 | ||||||
| LIABILITIES AND EQUITY | |||||||||
| Deferred guarantee income | 229,503 | 448,828 | 63,046 | ||||||
| Contingent guarantee liabilities | 213,644 | 591,329 | 83,063 | ||||||
| Payroll and welfare payable | 144,065 | 152,033 | 21,356 | ||||||
| Tax payables | 687,034 | 1,047,195 | 147,099 | ||||||
| Accrued expenses and other liabilities | 956,356 | 1,329,926 | 186,814 | ||||||
| Lease liabilities | 51,677 | 35,945 | 5,049 | ||||||
| TOTAL LIABILITIES | 2,282,279 | 3,605,256 | 506,427 | ||||||
| TOTAL SHAREHOLDERS' EQUITY | 3,127,614 | 4,303,067 | 604,448 | ||||||
| TOTAL LIABILITIES AND EQUITY | 5,409,893 | 7,908,323 | 1,110,875 | ||||||
| Jiayin Group Inc. UNAUDITED CONDENSED CONSOLIDATED STATEMENTS OF COMPREHENSIVE INCOME (Amounts in thousands, except for share and per share data) | ||||||||||||||||||
| For the Three Months Ended September 30, | For the Nine Months Ended September 30, | |||||||||||||||||
| 2024 | 2025 | 2024 | 2025 | |||||||||||||||
| RMB | RMB | US$ | RMB | RMB | US$ | |||||||||||||
| Net revenue | 1,444,872 | 1,470,210 | 206,519 | 4,396,539 | 5,131,992 | 720,887 | ||||||||||||
| Operating costs and expenses: | ||||||||||||||||||
| Facilitation and servicing | (419,056 | ) | (286,492 | ) | (40,243 | ) | (1,694,188 | ) | (907,587 | ) | (127,488 | ) | ||||||
| Allowance for uncollectible receivables, contract assets, loans receivable and others | (11,638 | ) | (1,503 | ) | (211 | ) | (10,993 | ) | (51,581 | ) | (7,246 | ) | ||||||
| Sales and marketing | (550,289 | ) | (544,236 | ) | (76,448 | ) | (1,396,660 | ) | (1,929,262 | ) | (271,002 | ) | ||||||
| General and administrative | (56,099 | ) | (72,369 | ) | (10,166 | ) | (167,310 | ) | (235,679 | ) | (33,106 | ) | ||||||
| Research and development | (95,925 | ) | (108,676 | ) | (15,266 | ) | (272,014 | ) | (305,200 | ) | (42,871 | ) | ||||||
| Total operating costs and expenses | (1,133,007 | ) | (1,013,276 | ) | (142,334 | ) | (3,541,165 | ) | (3,429,309 | ) | (481,713 | ) | ||||||
| Income from operation | 311,865 | 456,934 | 64,185 | 855,374 | 1,702,683 | 239,174 | ||||||||||||
| Interest income, net | 2,934 | 2,412 | 339 | 9,168 | 7,872 | 1,106 | ||||||||||||
| Other income, net | 8,742 | 6,485 | 911 | 74,966 | 61,667 | 8,662 | ||||||||||||
| Income before income taxes | 323,541 | 465,831 | 65,435 | 939,508 | 1,772,222 | 248,942 | ||||||||||||
| Income tax expense | (53,927 | ) | (89,345 | ) | (12,550 | ) | (158,559 | ) | (337,120 | ) | (47,355 | ) | ||||||
| Net income | 269,614 | 376,486 | 52,885 | 780,949 | 1,435,102 | 201,587 | ||||||||||||
| Less: Net income (loss) attributable to non-controlling interest | 2 | (5 | ) | (1 | ) | (4 | ) | (9 | ) | (1 | ) | |||||||
| Net income attributable to Jiayin Group Inc. | 269,612 | 376,491 | 52,886 | 780,953 | 1,435,111 | 201,588 | ||||||||||||
| Weighted average shares used in calculating net income per share: | ||||||||||||||||||
| - Basic and diluted | 212,672,997 | 205,258,184 | 205,258,184 | 212,380,527 | 209,819,063 | 209,819,063 | ||||||||||||
| Net income per share: | ||||||||||||||||||
| - Basic and diluted | 1.27 | 1.83 | 0.26 | 3.68 | 6.84 | 0.96 | ||||||||||||
| Net income per ADS: | ||||||||||||||||||
| - Basic and diluted | 5.08 | 7.32 | 1.04 | 14.72 | 27.36 | 3.84 | ||||||||||||
| Net income | 269,614 | 376,486 | 52,885 | 780,949 | 1,435,102 | 201,587 | ||||||||||||
| Other comprehensive (loss) income, net of tax of nil: | ||||||||||||||||||
| Foreign currency translation adjustments and fair value change | (7,008 | ) | 1,089 | 153 | (9,891 | ) | 1,871 | 263 | ||||||||||
| Comprehensive income | 262,606 | 377,575 | 53,038 | 771,058 | 1,436,973 | 201,850 | ||||||||||||
| Comprehensive (loss) income attributable to non-controlling interest | (69 | ) | 45 | 6 | (13 | ) | 76 | 11 | ||||||||||
| Total comprehensive income attributable to Jiayin Group Inc. | 262,675 | 377,530 | 53,032 | 771,071 | 1,436,897 | 201,839 | ||||||||||||
| Jiayin Group Inc. UNAUDITED RECONCILIATIONS OF GAAP AND NON-GAAP RESULTS (Amounts in thousands, except for share and per share data) | ||||||||||||||||||
| For the Three Months Ended September 30, | For the Nine Months Ended September 30, | |||||||||||||||||
| 2024 | 2025 | 2024 | 2025 | |||||||||||||||
| RMB | RMB | US$ | RMB | RMB | US$ | |||||||||||||
| Reconciliation of Non-GAAP income from operation to Income from operation | ||||||||||||||||||
| Income from operation: | 311,865 | 456,934 | 64,185 | 855,374 | 1,702,683 | 239,174 | ||||||||||||
| Add: share-based compensation expenses | 14,643 | 33,663 | 4,729 | 49,344 | 132,202 | 18,570 | ||||||||||||
| Non-GAAP income from operation | 326,508 | 490,597 | 68,914 | 904,718 | 1,834,885 | 257,744 | ||||||||||||
A chart accompanying this announcement is available at https://www.globenewswire.com/NewsRoom/AttachmentNg/3ef8e1ef-612c-43eb-8da4-b2d55d53142d

News Provided by GlobeNewswire via QuoteMedia

