- AustraliaNorth AmericaWorld
Investing News NetworkYour trusted source for investing success
- Lithium Outlook
- Oil and Gas Outlook
- Gold Outlook Report
- Uranium Outlook
- Rare Earths Outlook
- All Outlook Reports
- Top Generative AI Stocks
- Top EV Stocks
- Biggest AI Companies
- Biggest Blockchain Stocks
- Biggest Cryptocurrency-mining Stocks
- Biggest Cybersecurity Companies
- Biggest Robotics Companies
- Biggest Social Media Companies
- Biggest Technology ETFs
- Artificial Intellgience ETFs
- Robotics ETFs
- Canadian Cryptocurrency ETFs
- Artificial Intelligence Outlook
- EV Outlook
- Cleantech Outlook
- Crypto Outlook
- Tech Outlook
- All Market Outlook Reports
- Cannabis Weekly Round-Up
- Top Alzheimer's Treatment Stocks
- Top Biotech Stocks
- Top Plant-based Food Stocks
- Biggest Cannabis Stocks
- Biggest Pharma Stocks
- Longevity Stocks to Watch
- Psychedelics Stocks to Watch
- Top Cobalt Stocks
- Small Biotech ETFs to Watch
- Top Life Science ETFs
- Biggest Pharmaceutical ETFs
- Life Science Outlook
- Biotech Outlook
- Cannabis Outlook
- Pharma Outlook
- Psychedelics Outlook
- All Market Outlook Reports
Carbonxt Group Limited – HY24 Results
Carbonxt Group Ltd (ASX:CG1) (“Carbonxt” or “the Company”) has released its Half-year report for the half-year ending 31 December 2023 and provides the following update on the key areas of activity for the period -- all numbers are in A$.
OPERATIONS OVERVIEW
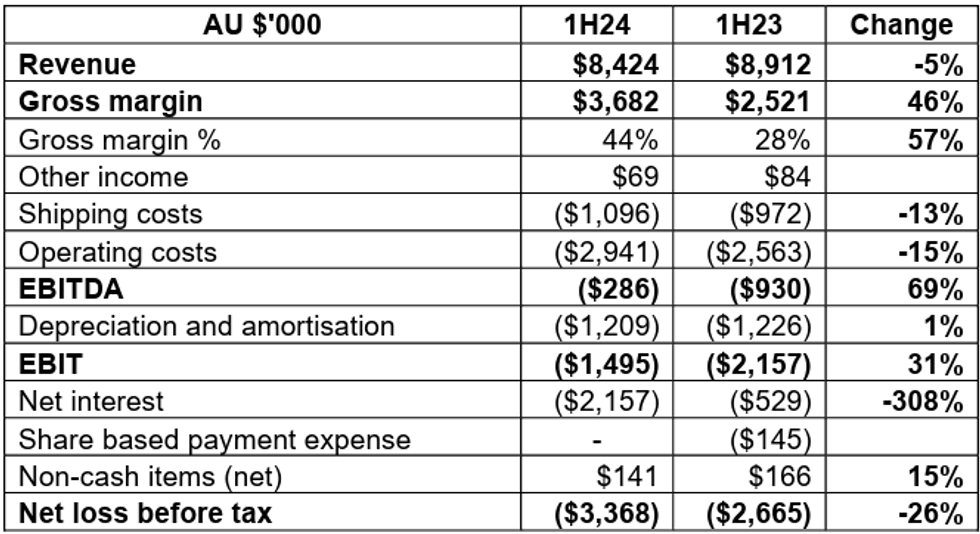
- Half year revenue of $8.4 million, down 5% on HY23, primarily due to a once-off impact on sales to the group’s largest pellet customer following outages at that customer’s facility.
- Operations during the half-year highlighted by great progress on the construction of the Company’s flagship Activated Carbon production facility in Kentucky, jointly owned with Kentucky Carbon Processing, LLC (“KCP”). Commissioning of the facility is now underway with a significant production ramp-up to occur next quarter.
- Pellet sales accounted for 54% of revenue and 37% of sales volume. Carbonxt continues to see strong demand for industrial pellets which is very encouraging given the near-term entry into production at the Kentucky facility.
- Powdered activated carbon (PAC) accounted for 46% of revenue and 63% of sales volume – PAC revenue increased by 31% from HY23.
- HY24 gross margin of 44%, up from 28% in HY23 principally due to positive flow-on effects from the successful rollout of operating cost reduction initiatives, as well as a reduction in manufacturing shifts at Arden Hills. The production performance of the Company’s other major ACP customer continues to decrease and is at a record low manufacturing cost.
- Underlying EBITDA for HY23 was a loss of $286K, compared to HY23 EBITDA loss of $930K, an improvement of 69%.
FINANCIAL OVERVIEW [All results in AUD]
REVENUE
- Total revenue was down 5% from HY23, driven primarily by downtime at our largest customer who had significant equipment issues at their facility in the December quarter.
- Pellet revenue was down 24% from HY23 reflecting the aforementioned reduction in demand from our largest pellet customer.
- PAC revenue was up 31% from HY23 reflecting the impact of material price increases across the customer portfolio and the increase in volume from one existing customer of approximately $1.5 million per annum.
MARGIN
- 1H23 gross margin was 44%, an increase from the 28% recorded in 1H23, reflecting the improvements made to operating costs over the past year.
- As noted earlier, continuous improvement is evident at Arden Hills based on lower fixed plant costs on a per unit basis.
- Several initiatives are also underway at Black Birch to further lower operating costs, including changes to the underlying lease structure. Negotiations on this matter will continue over the next quarter but are expected to lead to noticeable ongoing improvements in profitability.
OPERATING COSTS
- Shipping costs to customers increased in 1H24 to 13% of sales, compared to 1H23 at 11% of sales. The higher shipping costs reflect a customer mix change (lower sales to a major pellet customer who is located close to our Arden Hills plant).
- Operating costs of $2.9m were up 15% on 1H23 primarily reflecting additional one-off expenditure associated with entering into the Kentucky investment.
KENTUCKY PLANT
- During this period, construction has been underway for the new activated carbon plant in eastern Kentucky, USA. The plant will have an initial capacity of 10,000 tons per annum, with the ability to expand to 20,000 tons per annum for a small additional investment.
- Carbonxt has contributed USD $5.5 million to NewCarbon Processing, LLC (“NewCarbon”), alongside its US partner KCP. Carbonxt holds a 35.5% ownership interest in NewCarbon as of 31 December 2023, with options to invest a further USD $4.5m to move to 50% ownership interest.
- Construction progress has been pleasing with the plant now moving into the testing of front- end equipment and processes. The final electrical activities are expected to be undertaken in March with the delivery of the control systems, prior to the commencement of production.
- Near-term sales efforts are well underway with a very positive reception being received by our former industrial pellet customers. The next step for nearly all prospective customers is to provide pellet samples from the facility. This is expected to continue over the next few months.
- The JV project provides Carbonxt with a unique opportunity to benefit from major investments in pollution reduction technologies across the US market.
Click here for the full ASX Release
This article includes content from Carbonxt Group, licensed for the purpose of publishing on Investing News Australia. This article does not constitute financial product advice. It is your responsibility to perform proper due diligence before acting upon any information provided here. Please refer to our full disclaimer here.
Carbonxt Group Investor Kit
- Corporate info
- Insights
- Growth strategies
- Upcoming projects
GET YOUR FREE INVESTOR KIT
Carbonxt Group
Investor Insight
In an increasingly eco-conscious global market, Carbonxt makes a compelling investment case leveraging a current, approximate US$900 million addressable market, driven by a strategic joint venture that presents strong revenue and growth potential. This addressable market is anticipated to grow three to five fold to more than US$2 billion following the introduction of new rules to capture forever chemicals.
Overview
Activated carbon is typically derived from sources such as coconut husks and coal, and is among the most common ways to filter contaminants from both water and air.
Activated carbon is so named because the process by which it's produced oxidizes the carbon, 'activating’ a series of small, low-volume pores that considerably increase its surface area. There are a few different methods for producing the material, including carbonization, gas treatment and chemical treatment. It is also invaluable for a wide range of use cases across multiple industries, including healthcare, chemistry, agriculture, oil & gas and even food preparation.
For large-scale industrial use cases, activated carbon typically comes in one of three forms: powdered, pellet and granular. Depending on how the material is treated post-oxidation, activated carbon can be tailored to a multitude of individual use cases. For large-scale use, material cost can range from US$2,000 per tonne to as high as US$6,000 per tonne, presenting a considerable opportunity in activated carbon.
Carbonxt Group (ASX:CG1) is positioned to take full advantage of that opportunity. An innovative manufacturer of custom activated carbon, Carbonxt has locked in a joint venture with US-based partner Kentucky Carbon Processing, forming the joint venture NewCarbon, and effectively expanding Carbonxt’s addressable market and gross margin.
Much of this growth will be courtesy of a new Kentucky facility focused primarily on water treatment. This facility will leverage two pieces of legislation recently announced in the United States — the Environmental Protection Agency's (EPA’s) Clean Water Act and the Bipartisan Infrastructure Deal. The former aims to reduce pollution caused by polyfluoroalkyl substances (PFAS), while the latter provides a total of $10 billion in funding to help companies reduce PFAS contamination.
PFAS are a set of widely-used chemicals that take an incredibly long time to break down. Found in soil, water, air, fish and humans, multiple studies have linked PFAS to severe health problems, which include birth defects, developmental delays, thyroid disease, high blood pressure and increased risk of several types of cancer.
It’s why the EPA is cracking down hard on these chemicals, with additional regulations being proposed to further protect communities from the serious effects of PFAS. These regulations, which are set to begin enforcement between 2024 and 2028, will require the majority of companies in the water industry to upgrade their filtration systems.
Carbonxt provides products specifically targeting PFAS removal. Through the NewCarbon joint venture, the company intends to convert a waste-to-energy plant into an activated carbon plant, considerably increasing its production capacity and allowing it to directly serve the roughly 50,000 water utilities in the United States, which together account for roughly 50 percent of the granular activated carbon market.
If all goes as planned for Carbonxt, it will fully disrupt that market, unseating the current leader.
Company Highlights
- Carbonxt Group is a manufacturer of patented activated carbon products designed to treat toxic pollutants in both air and water. For example, Carbonxt Group has been awarded a US$159,000 (AU$240,000) research grant by the Florida state government to advance a groundbreaking water remediation study to combat the negative impacts of algae growth on coastal communities.
- Carbonxt currently has an addressable US market of US$290 million with a 5 percent market share. Its joint partnership with Kentucky Carbon Processing has the potential to increase this addressable market to more than $900 million.
- Together, Kentucky Carbon Processing and Carbonxt will form the joint venture company NewCarbon, affording Carbonxt several advantages:
- Increased US-based production capacity to over 20,000 tons per annum with the potential for further expansion.
- Control over input costs, considerably improving base margins.
- High-quality raw materials.
- In the near future, much of Carbonxt's growth will be driven by the United States Environmental Protection Agency's increasing regulation of PFAS.
- There are currently 50,000 water utility companies in the United States, 4,000 of which serve 10,000 or more customers. Collectively, they account for roughly 50 percent of the granular activated carbon market with annual expenditures of over US$300 million.
- Carbonxt is well-positioned to serve these companies, providing activated carbon pellets that offer improved filtration with a lower pressure drop as a replacement for granular activated carbon.
- In addition to a highly experienced leadership team, Carbonxt’s strong revenue and earnings growth potential from NewCarbon make the company an attractive investment prospect.
Core Product
High-performance Activated Carbon
Carbonxt designs specialized activated carbon products for its customers, which consist primarily of industrial sector organizations and power utilities. Available in pellet and powder form, the company's oxidizing, non-brominated activated carbons are non-corrosive and designed to remain efficient throughout their entire lifecycle. Although Carbonxt’s origin and listing is in Australia, its products are manufactured and distributed exclusively within the United States.
Carbonxt is currently focused on developing an activated carbon manufacturing facility in Kentucky, the result of a joint partnership with Kentucky Carbon Processing. Once this facility is operational, water utility companies are expected to form a much larger part of its customer base. The facility is also expected to re-invigorate the company's industrial pellet market sales.
Highlights:
- Strong Market Outlook: Industry demand for powdered and pelletized activated carbon remains strong. Prices have trended considerably upwards over the past year and will likely continue to do so for the foreseeable future.
- Pricing Trends: Carbonxt's primary competitors in the activated carbon market have both announced price increases ranging from 15 to 40 percent. The company's activated carbon products have the potential to offer better filtration at a considerably lower price point.
- Looking Up: Carbonxt has also recently improved its existing carbon manufacturing facilities. This has translated to a more than 20 percent increase in gross margins in the last financial year, with further double digit percentage gains expected in FY24.
- Making a Good First Impression: Carbonxt's high-specification sample products have been well-received by end customers. Management is currently in talks with numerous water utilities to purchase capacity from the company's new facility once it comes online.
- Use Cases: Carbonxt currently manufactures activated carbon products for the following:
- Powdered activated carbons for mercury and flue gas component removal. Customers for this use case include coal-fired power plants, cement plants and industrial boilers & incinerators. Carbonxt manufactures a specialized activated carbon for each type of customer.
- Pelletized activated carbon for the removal of VOCs and hydrogen sulphide from gas streams.
- High-quality pelletized activated carbons designed to remove drinking water contaminants as well as taste and odor compounds.
- Contract Agreements: Carbonxt has secured a $4.3 million purchase order for activated carbon (AC) products from US utility Wisconsin Public Service. The company also secured a four-year contract extension to supply premium PAC products to Reworld, a global leader in sustainable waste solutions. The deal will generate group revenues of approximately $6 million per annum for the duration of the contract.
Management Team
David Mazyck – President, NewCarbon (the Kentucky JV) and Director of Technology
Dr. David Mazyck is a world-leading expert on activated carbon (AC) and its applications including mercury capture. He has developed AC products for major multinational AC manufacturers and has regularly consulted them on technical issues. Mazyck is the former chairman of the Activated Carbon Standards Committee for the American Waterworks Association and has developed products for NASA.
He received his PhD in environmental engineering from Penn State University, where he also earned a PhD minor in fuel science.
Matthew Driscoll - Chairman
Matthew Driscoll has significant experience across several industries, including online technologies, financial services, fintech, cleantech, property and resources. He has more than 30 years’ experience in capital markets and the financial services industry and is an accomplished company director in roles across listed and private companies.
He has significant experience in international business growth, mergers and acquisitions, equity and debt raisings and building strategic alliances. His current directorships include NED Energy Technologies, NED Blina Minerals, NED Eco Systems, and NED Smoke Alarms Holdings.
Warren Murphy - Managing Director
Warren Murphy has led a large number of acquisitions and financings across the energy, resources and infrastructure sectors. This includes the development of over 2,000 MW of Greenfields power stations and the acquisition of over 3,000 MW of generation assets.
He was co-head of the Australian Infrastructure & Project Finance Group and Head of Energy at Babcock & Brown based in the Sydney office and led the development of Babcock & Brown’s energy sector capability in Australia and New Zealand, including the founding of Infigen Energy and its unlisted predecessor, Global Wind Partner, where he served as a director from inception until June 2009.
Murphy was also a director of the ASX-listed Alinta and Sydney Gas, as well as the unlisted Coogee Resources.
Dr. Regina Rodriguez - Senior Executive
Dr. Regina Rodriguez has a PhD from the University of Florida, where she received the prestigious National Science Foundation Graduate Student Fellowship. She was the chairperson of the Activated Carbon Standards Committee for the American Waterworks Association.
Rodriguez holds nine patents. Her leadership has resulted in one-of-a-kind sorbents and systems for power stations and water treatment.
Imtiaz Kathawalla – Independent Director
Imtiaz Kathawalla was a vice-president at NYSE-listed Cabot Corporation, a global specialty chemical company where he had a 27-year career. Kathawalla's most recent position with Cabot Corporation was as general manager of Cabot's purification solutions division. He ran the group's US$300-million global activated carbon business where he oversaw a material increase in EBITDA before managing the sale of the business to a large private equity group.
Nicholas Andrews – Independent Director
Nicholas Andrews has held the role of executive chairman and CEO at Magontec (ASX:MGL), an established business in the global magnesium sector. He is a member of the executive committee and serves on the board of the International Magnesium Association. Prior to his executive career, Andrews held several senior roles in the financial services sector across both investment management and investment banking.Share Purchase Plan to raise up to $2 million
Q2 FY25 Quarterly Activities Report & Appendix 4C
CG1 Achieves 40% ownership & Mechanical Completion of Plant
High-purity Silica: Key Material Powering Tech, Solar and Investment Growth
Silica, or silicon dioxide, is a fundamental component in various industries, serving as a critical material in applications ranging from construction to high-tech sectors.
Its versatility and unique properties make it indispensable in modern manufacturing and technology. However, beyond its industrial significance, silica represents a compelling investment opportunity, particularly in its high-purity form.
As the global economy transitions toward clean energy, advanced electronics, and next-generation communication technologies, the demand for high-purity silica is skyrocketing. Companies that can secure and supply this essential raw material stand to benefit from long-term growth and increasing market valuations.
For investors seeking exposure to key materials that drive innovation and sustainability, understanding the silica market, particularly the role of high-purity silica in industries like semiconductors and solar panels, is crucial.
This article explores the strategic value of silica, current market trends, and how companies are capitalizing on the growing demand for this critical resource.
Introduction to silica and its uses
Silica exists in several forms, with quartz being the most common crystalline variant. High-purity silica, characterized by minimal impurities, is essential in industries that demand exceptional material performance.
Key applications include:
- Glass manufacturing: High-purity silica is a primary raw material in producing various glass types, including those used in optics and electronics.
- Construction: Silica is a vital component in concrete and other building materials, contributing to structural integrity and durability.
- Electronics: In the semiconductor industry, high-purity silica is used to manufacture silicon wafers, which are foundational in electronic devices.
- Renewable energy: Silica is crucial in producing photovoltaic cells for solar panels, playing a significant role in harnessing solar energy.
Market trends and demand drivers
The global demand for high-purity silica is experiencing significant growth, driven by several factors:
- Semiconductors and electronics: The proliferation of electronic devices and advancements in technology have led to increased demand for high-purity silica in semiconductor manufacturing.
- Renewable energy: The shift towards sustainable energy sources has amplified the need for high-purity silica in solar panel production.
- 5G infrastructure: The rollout of 5G technology necessitates high-quality materials, including high-purity silica, to ensure optimal performance of communication systems.
It’s particularly noteworthy that high-purity silica is indispensable in renewable energy technologies, particularly in the production of photovoltaic cells for solar panels. Its properties enable efficient energy conversion, contributing to reduced carbon footprint and supporting global sustainability goals. As the world intensifies efforts to combat climate change, the demand for high-purity silica in renewable energy applications is expected to rise substantially.
While demand for silica continues to grow, meeting the increasing purity requirements poses challenges in securing adequate and secure supply of high-purity silica. This scenario underscores the importance of strategic investments in companies capable of delivering high-purity silica to meet market demands.
Troy Minerals: Positioned to meet demand
Amid the increasing demand for high-purity silica, Troy Minerals (CSE:TROY) is among the junior companies emerging as a key player in the race to supply industries that rely on this critical material.
The company is actively engaged in the exploration and development of silica-rich properties, focused on securing high-purity silica deposits and adhering to sustainable mining practices.
One of the company’s flagship assets is the Table Mountain silica project in BC, Canada. This site has already yielded promising results, with extensive zones of high-purity silica mineralization. Recent analytical data from the project indicate silica purity levels ranging from 95.82 percent to an impressive 99.82 percent, making it suitable for advanced industrial applications, including glass manufacturing, high-tech electronics and solar panel production.
Additionally, the project's location in Canada provides strategic advantages, including a stable regulatory environment and proximity to North American technology and energy markets. These factors contribute to the project's long-term scalability and commercial potential.
Beyond its Canadian operations, Troy Minerals is expanding its global footprint with the Tsagaan Zalaa silica project in Mongolia. The company recently submitted a mining license application for this project, signaling its commitment to securing high-purity silica resources on an international scale. Mongolia’s rich geological landscape, combined with its growing mining sector, offers an attractive opportunity for Troy Minerals to establish a strong presence in the Asian silica supply chain. Given Asia’s rapid industrial growth, particularly in solar panel manufacturing and semiconductor production, this project could position the company as a critical supplier for key industries in the region.
Troy Minerals’ strategic approach is not just about resource acquisition, it is also about responsible and sustainable development. The company is committed to environmentally conscious mining practices, ensuring that its operations align with evolving global regulations and corporate sustainability standards. With governments and industries placing increasing emphasis on ESG factors, Troy Minerals’ dedication to responsible resource management strengthens its appeal to institutional investors and environmentally conscious stakeholders.
Through its high-purity silica assets in strategic locations, Troy Minerals is positioning itself as a vital player in the global supply chain.
Investment case
Investors evaluating silica-focused companies should consider several factors:
- Resource quality: The purity and accessibility of silica deposits are critical determinants of a company's potential.
- Proximity to markets: Close access to key markets can reduce transportation costs and improve supply chain efficiency.
- Regulatory environment: Navigating environmental and mining regulations effectively is essential for sustainable operations.
Investor takeaway
The escalating demand for high-purity silica presents significant opportunities for companies equipped to meet the stringent requirements of modern industries.
Resource companies, like Troy Minerals, that are poised to support critical sectors such as renewable energy and technology manufacturing, offer a strategic avenue for investors seeking to capitalize on this growing market.
As global industries continue to evolve, high-purity silica remains a cornerstone material, reinforcing its status as a backbone of modern industry and a strategic investment opportunity.
CoTec Holdings: Innovating the Future of Resource Extraction
CoTec Holdings (TSXV:CTH,OTCQB:CTHCF) (CoTec) leverages disruptive technologies to undervalued critical mineral assets and waste materials into high-value commodities essential for a low-carbon future. The company offers a unique investment opportunity, characterized by low cost, lower capex, faster cash flow generation, and superior returns through innovation and strategic execution.
CoTec targets sectors crucial to today’s evolving economies like rare earth magnet recycling, green steel production and copper waste processing by advancing four cutting-edge technologies and three strategic assets.
CoTec's medium-term goal of acquiring 10 technologies and 20 to 30 assets. The company’s business model is supported by partnerships, joint ventures (JVs), and a disciplined capital management strategy to unlock value across its portfolio.
CoTec is guided by a highly experienced management team and board of directors with deep expertise in mining, technology and corporate finance.
Company Highlights
- CoTec deploys cutting-edge, low-carbon technologies to marginal assets, reclamation opportunities and recycling initiatives, transforming waste materials into strategic, high-value commodities.
- The company holds stakes in four groundbreaking technologies — HyProMag, Binding Solutions, MagIron and Ceibo. These technologies are designed to unlock significant value across strategically chosen assets. The Lac Jeannine iron project in Quebec, with an after tax NPV of US$59.9 million, stands on its own merits but could see further economic and environmental enhancements through the application of CoTec’s technologies. Similarly, HyProMag USA is pioneering the rollout of HyProMag’s rare earth recycling technology in the United States, delivering low-cost, magnet-to-magnet low-carbon resource recovery.
- CoTec accelerates the transition from discovery to production through proprietary technologies and strategic joint ventures, enabling significantly faster revenue generation compared to traditional mining operations.
- Backed by a management team with extensive expertise in mining, finance and technology, CoTec is uniquely positioned to drive innovation and growth in the critical minerals sector.
- Approximately 74 percent of the company is owned by management and insiders, demonstrating the leadership’s strong commitment to the company’s success.
This CoTec Holdings profile is part of a paid investor education campaign.*
Click here to connect with CoTec Holdings (TSXV:CTH,OTCQB:CTHCF) to receive an Investor Presentation
Troy Minerals Reports Analytical Results from Table Mountain Silica Project, Identifying Broad High-Purity Zones
Troy Minerals Inc. ("Troy" or the "Company") (CSE:TROY)(OTCQB:TROYF)(FSE:VJ3) is pleased to announce that it has received results from a sampling and mapping program on its 100% owned Table Mountain Silica Project, located near Golden, British Columbia, Canada.
Key Highlights
- Three distinct zones of high-purity silica mineralization identified within the Mount Wilson Quartzite Formation.
- 98.86% SiO₂ over a total of 62.11 metres of channel sampling in five channels at the main Table Mountain Zone.
- Outcrop sampling returned 98.18% to 99.74% SiO2 from 45 samples at Table Mountain Zone, 97.83% to 99.49% SiO₂ from 13 samples at South Zone, and 95.82% to 99.82% SiO₂ from 29 samples at Southeast Zone. *
- Very low deleterious elements identified in all samples.
President of Troy Minerals Inc., Yannis Tsitos commented: "These comprehensive maiden assay results validate the potential of Table Mountain as a key high-purity silica asset. Sampling confirmed the exceptional quality and consistency of silica mineralization across the Project. With grades reaching 98 to 99% SiO₂ across multiple zones of extensive outcrop exposure, and sampling ranging from 98.18% to 99.74% SiO₂ at the main Table Mountain Zone, we are rapidly advancing our understanding of this strategic asset. The Project's infrastructure advantages and proximity to existing silica operations further enhance its potential as we work to establish Troy as a significant player in the North American high-purity silica market, positioning the Company for long-term growth."
The sampling program consisted of both systematic grab samples and channel samples, with a total of 110 grab samples (107 outcrop and 3 float) taken within the property area and 70 channel samples collected from 62.11 metres within 74.16 metres of channels.
Figure 1. Index Map
Outcrop Sampling Results
Three main areas returned significant high-purity silica results: the Table Mountain Zone, located at the north end of the Property, the South Zone, and the Southeast Zone.
The most extensively sampled zone was the Table Mountain Zone, which returned an average grade of 98.90% SiO₂ from 45 grab samples (42 outcrop, 3 float), with values ranging from 98.18% to 99.74% SiO₂. Additionally, from these samples the following average values were returned: 0.31% Fe₂O₃, 0.01% CaO, 0.14% Al₂O₃, 0.02% MgO, 0.01% TiO₂, 0.01% P₂O₅, and 14ppm boron. See Figure 2 and Table 1. *
Figure 2. Table Mountain Zone Outcrop Sampling - %SiO2
Table 1. Table Mountain Zone Outcrop Samples
Sample # | Easting (m) | Northing (m) | SiO2 (%) | Al2O3 (%) | CaO (%) | Fe2O3 (%) | MgO (%) | P2O5 (%) | TiO2 (%) | B (ppm) |
299516 | 509114 | 5685249 | 99.41 | 0.11 | 0.02 | 0.39 | 0.01 | <0.01 | <0.01 | 6 |
299517 | 509193 | 5685166 | 98.84 | 0.14 | 0.01 | 0.23 | 0.02 | <0.01 | <0.01 | 8 |
299518 | 509314 | 5685171 | 99.20 | 0.10 | 0.01 | 0.25 | 0.02 | <0.01 | 0.01 | 10 |
299519 | 509350 | 5685151 | 98.26 | 0.12 | 0.01 | 0.35 | 0.01 | <0.01 | 0.01 | 15 |
299520 | 509369 | 5685129 | 99.20 | 0.13 | 0.01 | 0.21 | <0.01 | <0.01 | 0.03 | 16 |
299521 | 509395 | 5685107 | 99.17 | 0.15 | 0.01 | 0.27 | 0.02 | <0.01 | 0.01 | 8 |
299522 | 509418 | 5685094 | 98.78 | 0.23 | 0.02 | 0.26 | 0.01 | <0.01 | 0.01 | 12 |
299523 | 509442 | 5685075 | 98.59 | 0.14 | 0.02 | 0.26 | <0.01 | 0.01 | 0.01 | 12 |
299524 | 509450 | 5685043 | 99.74 | 0.07 | 0.01 | 0.30 | 0.01 | 0.01 | 0.01 | 6 |
299525 | 509471 | 5685019 | 98.58 | 0.04 | 0.01 | 0.36 | 0.01 | 0.01 | 0.01 | 7 |
299526 | 509482 | 5684990 | 99.25 | 0.14 | 0.02 | 0.27 | 0.04 | 0.01 | 0.01 | 7 |
299527 | 509500 | 5684961 | 99.66 | 0.16 | 0.02 | 0.31 | 0.02 | 0.01 | 0.01 | 7 |
299528 | 509515 | 5684938 | 99.21 | 0.14 | 0.01 | 0.32 | 0.02 | 0.01 | 0.01 | 7 |
299529 | 509538 | 5684911 | 99.13 | 0.11 | 0.01 | 0.27 | 0.03 | 0.01 | 0.01 | 21 |
299530 | 509561 | 5684862 | 98.18 | 0.25 | 0.01 | 0.31 | 0.03 | 0.01 | 0.01 | 7 |
299531 | 509598 | 5684823 | 98.93 | 0.27 | 0.02 | 0.36 | 0.03 | 0.01 | 0.01 | 7 |
299532 | 509583 | 5684759 | 98.99 | 0.09 | 0.01 | 0.30 | <0.01 | 0.01 | 0.01 | 7 |
299533 | 509619 | 5684743 | 98.72 | 0.16 | 0.01 | 0.35 | 0.02 | 0.01 | 0.01 | 14 |
299534 | 509641 | 5684726 | 98.18 | 0.30 | 0.01 | 0.33 | 0.04 | 0.01 | 0.02 | 15 |
299535 | 509712 | 5684697 | 99.41 | 0.13 | 0.01 | 0.30 | 0.02 | 0.01 | 0.01 | 7 |
299536 | 509736 | 5684685 | 99.27 | 0.11 | 0.01 | 0.33 | 0.02 | 0.01 | 0.01 | 7 |
299537 | 509764 | 5684670 | 98.58 | 0.13 | 0.02 | 0.36 | 0.03 | 0.01 | 0.02 | 8 |
299548 | 509306 | 5685510 | 99.32 | 0.14 | 0.01 | 0.29 | 0.01 | 0.01 | 0.01 | 18 |
299560 | 509476 | 5685127 | 98.99 | 0.13 | 0.01 | 0.32 | 0.03 | 0.01 | 0.02 | 27 |
299561 | 509472 | 5685107 | 99.01 | 0.05 | 0.01 | 0.32 | 0.01 | 0.01 | <0.01 | 18 |
299562 | 509457 | 5685115 | 98.74 | 0.15 | 0.01 | 0.26 | 0.01 | 0.01 | 0.02 | 28 |
299563 | 509439 | 5685112 | 98.35 | 0.20 | 0.02 | 0.34 | 0.02 | 0.01 | 0.01 | 27 |
299564 | 509459 | 5685092 | 99.20 | 0.09 | 0.01 | 0.32 | <0.01 | 0.01 | 0.01 | 21 |
299565 | 509487 | 5685107 | 99.49 | 0.09 | 0.01 | 0.28 | 0.03 | 0.01 | 0.02 | 28 |
299566 | 509490 | 5685083 | 98.48 | 0.25 | 0.02 | 0.35 | 0.01 | 0.01 | 0.01 | 26 |
299567 | 509503 | 5685071 | 99.03 | 0.11 | 0.02 | 0.34 | 0.02 | 0.01 | <0.01 | 21 |
299568 | 509477 | 5685067 | 99.16 | 0.10 | 0.01 | 0.30 | <0.01 | 0.01 | <0.01 | 18 |
299569 | 509478 | 5685044 | 98.68 | 0.10 | 0.01 | 0.32 | 0.03 | 0.01 | <0.01 | 20 |
299570 | 509506 | 5685041 | 98.46 | 0.43 | 0.02 | 0.32 | 0.06 | 0.01 | 0.01 | 29 |
299571 | 509523 | 5685054 | 98.81 | 0.13 | 0.01 | 0.31 | 0.03 | 0.01 | 0.01 | 22 |
299572 | 509382 | 5685160 | 98.42 | 0.09 | 0.01 | 0.29 | 0.01 | 0.01 | 0.01 | 23 |
299573 | 509397 | 5685160 | 98.92 | 0.11 | 0.01 | 0.36 | <0.01 | 0.01 | <0.01 | 18 |
299574 | 509406 | 5685142 | 99.12 | 0.09 | 0.01 | 0.30 | 0.02 | 0.01 | <0.01 | 17 |
299575 | 509409 | 5685120 | 98.56 | 0.14 | 0.01 | 0.37 | <0.01 | 0.01 | <0.01 | 21 |
299581 | 509357 | 5685172 | 98.84 | 0.08 | 0.02 | 0.32 | <0.01 | 0.01 | 0.01 | 18 |
299582 | 509429 | 5685142 | 98.87 | 0.15 | 0.01 | 0.29 | <0.01 | 0.01 | 0.02 | 8 |
299583 | 509446 | 5685146 | 98.25 | 0.33 | 0.02 | 0.33 | 0.03 | 0.01 | 0.03 | 17 |
299584 | 509455 | 5685145 | 99.49 | 0.11 | 0.02 | 0.27 | <0.01 | 0.01 | 0.01 | 5 |
299585 | 509473 | 5685142 | 98.66 | 0.08 | 0.01 | 0.36 | <0.01 | 0.01 | <0.01 | 6 |
299586 | 509493 | 5685133 | 98.52 | 0.05 | 0.01 | 0.29 | <0.01 | 0.01 | <0.01 | <5 |
Note: 299548, 299584, and 299585 are float samples taken near outcrop.
The South Zone, comprising 13 high-grade quartzite outcrop grab samples averaged 98.80% SiO₂ with values ranging from 97.83% to 99.49% SiO₂. These samples averaged 0.28% Fe₂O₃, 0.13% CaO, 0.13% Al₂O₃, 0.02% MgO, <0.01% TiO₂, 0.02% P₂O₅, and 6ppm boron. See Figure 3 and Table 2. *
Figure 3. South Zone Outcrop Sampling - %SiO2
Table 2. South Zone Outcrop Samples
Sample # | Easting (m) | Northing (m) | SiO2 (%) | Al2O3 (%) | CaO (%) | Fe2O3 (%) | MgO (%) | P2O5 (%) | TiO2 (%) | B (ppm) |
248351 | 511603 | 5682006 | 98.60 | 0.28 | 0.08 | 0.25 | 0.04 | 0.01 | 0.01 | 15 |
248352 | 511563 | 5681948 | 99.45 | 0.15 | 0.02 | 0.22 | 0.02 | 0.01 | <0.01 | 6 |
248353 | 511552 | 5681948 | 99.01 | 0.19 | 0.03 | 0.29 | 0.04 | 0.01 | 0.01 | 9 |
248354 | 511551 | 5681951 | 99.09 | 0.11 | 0.02 | 0.22 | 0.03 | 0.01 | 0.01 | 6 |
248355 | 511530 | 5681940 | 98.74 | 0.09 | 0.02 | 0.23 | <0.01 | 0.01 | <0.01 | 6 |
248356 | 511522 | 5681942 | 98.82 | 0.08 | 0.01 | 0.31 | <0.01 | 0.01 | <0.01 | <5 |
248357 | 511512 | 5681951 | 98.31 | 0.09 | 0.01 | 0.24 | 0.01 | 0.01 | 0.01 | 5 |
248358 | 511485 | 5681948 | 98.14 | 0.13 | 0.28 | 0.32 | 0.03 | 0.01 | 0.01 | 8 |
248359 | 511461 | 5681935 | 99.49 | 0.11 | 0.02 | 0.30 | 0.02 | 0.01 | <0.01 | 10 |
248360 | 511436 | 5681932 | 99.06 | 0.03 | 0.05 | 0.25 | 0.01 | 0.02 | <0.01 | 5 |
248361 | 511444 | 5681918 | 99.42 | 0.07 | 0.01 | 0.29 | 0.02 | 0.01 | <0.01 | 6 |
248362 | 511440 | 5681942 | 97.83 | 0.32 | 0.73 | 0.36 | 0.03 | 0.03 | 0.01 | 8 |
248364 | 511374 | 5682002 | 98.43 | 0.09 | 0.43 | 0.36 | <0.01 | 0.16 | <0.01 | <5 |
The Southeast Zone, comprising 29 high-grade quartzite outcrop grab samples, returned an average of 98.52% SiO₂ with values ranging from 95.82% to 99.82% SiO₂. Average values for other constituents were: 0.35% Fe₂O₃, 0.07% CaO, 0.30% Al₂O₃, 0.06% MgO, 0.02% TiO₂, <0.01% P₂O₅, and 26ppm boron. See Figure 4 and Table 3.*
Figure 4. Southeast Zone Outcrop Sampling - %SiO2
Table 3. Southeast Zone Outcrop Samples - %SiO2
Sample # | Easting (m) | Northing (m) | SiO2 (%) | Al2O3 (%) | CaO (%) | Fe2O3 (%) | MgO (%) | P2O5 (%) | TiO2 (%) | B (ppm) |
248384 | 513642 | 5680350 | 98.22 | 0.37 | 0.21 | 0.41 | 0.14 | 0.02 | 0.03 | 27 |
248385 | 513671 | 5680320 | 95.82 | 0.57 | 0.69 | 0.51 | 0.52 | 0.02 | 0.03 | 30 |
248386 | 513685 | 5680313 | 97.77 | 0.48 | 0.05 | 0.37 | 0.05 | 0.01 | 0.03 | 30 |
248387 | 513708 | 5680285 | 98.90 | 0.36 | 0.02 | 0.35 | 0.04 | <0.01 | 0.03 | 30 |
248388 | 513735 | 5680261 | 98.11 | 0.32 | 0.03 | 0.31 | 0.04 | <0.01 | 0.03 | 35 |
248389 | 513748 | 5680244 | 98.05 | 0.49 | 0.03 | 0.30 | 0.03 | <0.01 | 0.01 | 28 |
248390 | 513654 | 5680223 | 98.91 | 0.13 | 0.01 | 0.27 | 0.04 | <0.01 | 0.01 | 29 |
248391 | 513627 | 5680208 | 98.74 | 0.09 | 0.02 | 0.30 | 0.02 | <0.01 | 0.02 | 27 |
248392 | 513600 | 5680217 | 99.52 | 0.06 | 0.02 | 0.32 | 0.03 | <0.01 | 0.01 | 23 |
248393 | 513564 | 5680220 | 96.98 | 1.04 | 0.05 | 0.33 | 0.07 | 0.03 | 0.07 | 41 |
248394 | 513592 | 5680259 | 98.91 | 0.30 | 0.13 | 0.35 | 0.13 | <0.01 | 0.02 | 31 |
248395 | 513390 | 5680466 | 99.26 | 0.11 | 0.02 | 0.35 | 0.03 | <0.01 | 0.01 | 25 |
248396 | 513367 | 5680495 | 98.81 | 0.12 | 0.07 | 0.34 | 0.04 | <0.01 | 0.01 | 25 |
248397 | 513332 | 5680531 | 99.25 | 0.08 | 0.02 | 0.37 | 0.01 | <0.01 | 0.01 | 26 |
248398 | 513301 | 5680539 | 99.08 | 0.15 | 0.21 | 0.33 | 0.04 | <0.01 | 0.01 | 27 |
248399 | 513283 | 5680559 | 98.76 | 0.07 | 0.09 | 0.36 | 0.02 | <0.01 | 0.01 | 22 |
248400 | 513263 | 5680602 | 98.77 | 0.08 | 0.01 | 0.29 | <0.01 | <0.01 | 0.01 | 24 |
299501 | 513231 | 5680636 | 98.14 | 0.15 | 0.02 | 0.41 | 0.02 | <0.01 | 0.01 | 26 |
299502 | 513188 | 5680660 | 99.05 | 0.20 | 0.02 | 0.27 | <0.01 | <0.01 | 0.01 | 27 |
299503 | 513160 | 5680700 | 99.07 | 0.16 | 0.02 | 0.31 | 0.02 | <0.01 | 0.01 | 27 |
299504 | 513133 | 5680705 | 98.85 | 0.13 | 0.02 | 0.26 | 0.01 | <0.01 | 0.01 | 26 |
299508 | 513834 | 5679986 | 98.68 | 0.15 | 0.03 | 0.26 | 0.02 | <0.01 | 0.01 | 21 |
299509 | 513876 | 5679941 | 98.88 | 0.23 | 0.03 | 0.27 | 0.04 | <0.01 | 0.03 | 34 |
299510 | 513904 | 5679907 | 99.08 | 0.05 | 0.02 | 0.29 | <0.01 | <0.01 | 0.01 | 11 |
299511 | 513968 | 5679864 | 99.82 | 0.15 | 0.02 | 0.27 | 0.02 | <0.01 | 0.01 | 23 |
299512 | 514023 | 5679832 | 99.21 | 0.12 | 0.02 | 0.29 | 0.03 | <0.01 | 0.03 | 10 |
299513 | 514070 | 5679980 | 97.08 | 1.11 | 0.02 | 0.75 | 0.09 | 0.01 | 0.05 | 18 |
299514 | 514081 | 5680011 | 96.66 | 1.27 | 0.02 | 0.43 | 0.05 | 0.01 | 0.07 | 26 |
299515 | 514075 | 5680039 | 98.58 | 0.26 | 0.07 | 0.45 | 0.07 | 0.01 | 0.03 | 14 |
The remainder of samples were either taken near the contacts of the adjacent units or from non-quartzite outcrops of the adjacent Glenogle shale (east contact) and Beaverfoot dolomite (west contact) and were not included in the statistical summary of the quartzite samples taken.
Channel Sampling Results
Channel sampling was conducted at the Table Mountain Zone, with results consistently similar to the outcrop sampling results. Sampling procedure consisted of continuous chip sampling along a 3-centimetre cut channel. Samples were taken continuously over 1-metre intervals perpendicular to the strike orientation of the outcrop, with the sample sequence starting from the southwest end of the channel. Intervals shorter than 20 centimetres were combined with the previous interval. 66 continuous chip channel samples were collected over 62.11 metres within 74.16 metres in five channels, returning a weighted average of 98.86% SiO₂.
Four additional duplicates were taken as QA/QC checks and passed validation. Sample density is sufficient to indicate the accurate representation of the underlying mineralization.
See Figure 5 and Table 4 below.
Figure 5. Channel Sampling Locations - Table Mountain Zone
Table 4. Table Mountain Zone - Channel Sampling
Channel | From (m) | To (m) | Interval (m) | SiO2 (%) | Al2O3 (%) | CaO (%) | Fe2O3 (%) | MgO (%) | P2O5 (%) | TiO2 (%) | B (ppm) |
TM1 | 0.00 | 4.74 | 4.74 | 98.83 | 0.15 | 0.01 | 0.30 | 0.01 | 0.01 | 0.01 | 24 |
TM2 | 0.00 | 5.80 | 5.80 | 98.88 | 0.10 | 0.01 | 0.33 | 0.01 | 0.01 | 0.01 | 10 |
5.80 | 6.30 | 0.50 | Overburden | ||||||||
6.30 | 8.83 | 2.53 | 98.90 | 0.10 | 0.01 | 0.30 | 0.01 | 0.01 | 0.02 | 7 | |
8.83 | 9.38 | 0.55 | Overburden | ||||||||
9.38 | 13.0 | 3.62 | 99.21 | 0.09 | <0.01 | 0.35 | 0.01 | 0.01 | 0.02 | 11 | |
TM3 | 0.00 | 7.60 | 7.60 | 99.03 | 0.11 | <0.01 | 0.32 | 0.01 | 0.01 | 0.02 | 7 |
7.60 | 10.20 | 2.60 | Overburden | ||||||||
10.20 | 11.00 | 0.80 | 99.08 | 0.11 | <0.01 | 0.27 | 0.01 | 0.01 | 0.02 | 6 | |
11.00 | 11.90 | 0.90 | Overburden | ||||||||
11.90 | 18.00 | 6.10 | 98.79 | 0.11 | <0.01 | 0.29 | <0.01 | 0.01 | 0.02 | 10 | |
TM4 | 0.00 | 5.22 | 5.22 | 99.09 | 0.09 | <0.01 | 0.33 | <0.01 | 0.01 | 0.02 | 12 |
TM5 | 0.00 | 3.80 | 3.80 | 98.82 | 0.15 | <0.01 | 0.29 | <0.01 | 0.01 | 0.04 | 15 |
3.80 | 4.50 | 0.70 | Overburden | ||||||||
4.50 | 7.00 | 2.50 | 98.85 | 0.12 | <0.01 | 0.31 | 0.02 | 0.01 | 0.02 | 20 | |
7.00 | 10.20 | 3.20 | Overburden | ||||||||
10.20 | 12.00 | 1.80 | 98.77 | 0.09 | <0.01 | 0.34 | 0.01 | <0.01 | 0.01 | 12 | |
12.00 | 13.00 | 1.00 | Overburden | ||||||||
13.00 | 17.50 | 4.50 | 98.30 | 0.15 | 0.09 | 0.34 | 0.02 | <0.01 | 0.01 | 13 | |
17.50 | 20.10 | 2.60 | Overburden | ||||||||
20.10 | 33.20 | 13.10 | 98.81 | 0.11 | <0.01 | 0.31 | 0.01 | <0.01 | 0.01 | 9 |
Discussion
Sampling results within the zones were consistently high purity, with the northern Table Mountain Zone returning the best and most consistent grades. The favourable grades reflect field observations of a broad zone of white quartzite measuring at least 150 metres wide and a strike length extending from the Trans-Canada Highway to the south and to the north, beyond the northern end of the Property, representing a total strike length of at least 4 kilometres. Although the western cliff face of Table Mountain clearly demarcates the western margin of the Mount Wilson Formation quartzite, the eastern margin is obscured by a deep boulder field originating from the extensive, steep quartzite exposure in this area.
Channels sampling results demonstrated a consistency in grade over a wide area within the Table Mountain Zone.
All samples were submitted to ALS Laboratories in North Vancouver, British Columbia for B-MS82L (boron) and ME-XRF26 (all other elements). Four sample duplicates were taken in the channel sampling sequence, and passed QA/QC.
* Cautionary Note
The reader is cautioned that grab samples are selective by nature and may not represent the true grade or style of mineralization across the property.
About the Table Mountain Project
The Table Mountain Silica Project comprises 2,304 hectares located 4 kilometres east of Golden, B.C., with excellent year-round access and proximity to the Canadian Pacific Railway Golden Rail Yard. The property hosts up to 10 kilometers of regionally mapped strike length of the Mount Wilson Formation, with apparent widths ranging from 300 to 1,400 metres at surface. The project is strategically positioned near both the Moberly Silica Mine and Sinova Quartz silica quarry, which exhibit economic grade silica greater than 99.6% SiO₂ purity.
Qualified Person
Technical information in this news release has been reviewed and approved by Case Lewis, P.Geo., a "Qualified Person" as defined under NI 43-101 Standards of Disclosure for Mineral Projects and a director of the Table Mountain Project vendor.
About Troy Minerals
Troy Minerals is a Canadian based publicly listed mining company focused on building shareholder value through acquisition, exploration, and development of strategically located "critical" mineral assets. Troy is aggressively advancing its projects within the silica (silicon), vanadium, and rare earths industries within regions that exhibit high and growing demand for such commodities, in both North America and Central-East Asia. The Company's primary objective is the near-term prospect of production with a vision of becoming a cash-flowing mining company to ultimately deliver tangible monetary value to shareholders, state, and local communities.
ON BEHALF OF THE BOARD,
Rana Vig | CEO & Director Telephone: 604-218-4766
Email: rana@ranavig.com
Forward-Looking Statements
Statement Regarding Forward-Looking Information: This release includes certain statements that may be deemed "forward-looking statements". All statements in this release, other than statements of historical facts, that address events or developments that Troy Resources Inc. (the "Company") expects to occur, are forward-looking statements. Forward-looking statements are statements that are not historical facts and are generally, but not always, identified by the words "expects", "plans", "anticipates", "believes", "intends", "estimates", "projects", "potential" and similar expressions, or that events or conditions "will", "would", "may", "could" or "should" occur. Although the Company believes the expectations expressed in such forward-looking statements are based on reasonable assumptions, such statements are not guarantees of future performance and actual results may differ materially from those in the forward-looking statements. Factors that could cause the actual results to differ materially from those in forward-looking statements include results of exploration activities may not show quality and quantity necessary for further exploration or future exploitation of minerals deposits, volatility of commodity prices, and continued availability of capital and financing, permitting and other approvals, and general economic, market or business conditions. Investors are cautioned that any such statements are not guarantees of future performance and actual results or developments may differ materially from those projected in the forward-looking statements. Forward-looking statements are based on the beliefs, estimates and opinions of the Company's management on the date the statements are made. Except as required by applicable securities laws, the Company undertakes no obligation to update these forward-looking statements in the event that management's beliefs, estimates or opinions, or other factors, should change.
The Canadian Securities Exchange has not reviewed this press release and does not accept responsibility for the adequacy or accuracy of this news release.
December 2024 Quarterly Activities & Appendix 4C Cashflow
Provaris Energy Ltd (ASX: PV1, Provaris, the Company) is pleased to provide the following summary of the Company’s development activities for the quarter that ended 31 Dember 2024.
HIGHLIGHTS OF THE QUARTER
Term Sheet with Uniper and Norwegian Hydrogen for supply and offtake is a breakthrough validation milestone
- Executed Term Sheet outlines the delivery of 42,500 tonnes per year of green hydrogen to Uniper, transported via Provaris’ H2Neo compressed hydrogen carriers. Deliveries could begin in early 2029 and will extend for a minimum of 10 years, establishing Europe’s first large-scale regional hydrogen marine transport project.
- Provides the basis of negotiating a binding Hydrogen Sale and Purchase Agreement which is targeted for June 2025, and a catalyst to mature discussions with shipyards and owners on shipping.
- Provaris and Norwegian Hydrogen continue to collaborate on the development of the supply of RFNBO compliant hydrogen from the Nordics.
- Ongoing work with Uniper on the optimal shipping schedule and import terminal solutions to ensure flexible and efficient transport.
Positive advancements in European supply chain developments continued in 2024
- Demonstrated compliance with Europe’s Renewable Energy Directive II (RED II) emissions standards for bulk hydrogen shipping using its proprietary H2Neo carrier on a round-trip between Norway and Germany.
- Advanced the conceptual design with Global Energy Storage (GES) of an initial 40,000 tpa compressed hydrogen import project in Rotterdam, including options for hydrogen storage at the terminal and connection to the Hynetwork Netherlands H2 network.
- Continued to qualify and advance a pipeline of supply chain opportunities in the European region suitable for Provaris’ carriers to deliver hydrogen at a superior cost to alternatives such as ammonia.
Commenced innovative CO2 Tank design with Yinson Production AS for bulk storage and shipping
- Commenced collaboration with Yinson on the technical design for an innovative large capacity CO2 tank design for bulk storage and marine transport of liquid CO2, provides a new market to commercialise Provaris tank IP.
- Concept Design phase progressed with the completion of a Basis of Design and Production Concept, including material selection and development of a Structural Design Model.
- Received USD 200,000 payment from Yinson for Technology Service Fees related to the Concept Design, in addition to external project costs being met.
- Yinson has a long track record in the construction of floating production, storage, and offloading vessels, with the strategy and financial backing to support the development of comprehensive carbon capture and sequestration supply chains.
Provaris Managing Director and CEO, Martin Carolan, commented:“The execution of a Term Sheet for hydrogen supply and offtake with Uniper is a breakthrough commercial milestone for Provaris, validating our focus on Europe to be the first regional market for bulk supply and recognising the benefits of our approach and delivered cost advantage in scaling hydrogen supply using compression.
We have seen this milestone catalyse several discussions with stakeholders and industry partners on other supply chain proposals and industry partners and an overall increase in activity going into 2025.
The diversification into the CO2 supply chain is now underway with the support and collaboration of a strong partner in Yinson, a leader in the offshore industry. Progress is being made on a innovate CO2 tank that could be a game- changer for the industry, which is advanced with transport infrastructure but still requires cost and transport efficiency to economically scale-up.”
Click here for the full ASX Release
This article includes content from Provaris Energy, licensed for the purpose of publishing on Investing News Australia. This article does not constitute financial product advice. It is your responsibility to perform proper due diligence before acting upon any information provided here. Please refer to our full disclaimer here.
Energy Technologies Limited 2Q FY2025 Quarterly Activities Report and Appendix 4C
Energy Technologies Limited (ASX: EGY or “the Company”), is pleased to release its Quarterly Activities Report and Appendix 4C Quarterly Cash Flow Report for the period ended December 2024 (“2Q FY2025”).
Key highlights:
- Unaudited sales revenue increased 17.5% over preceding quarter; and
- Subsequent to adoption of revised business plan, Manufactured and Purchased Sales Divisions awarded inaugural cable supply contract.
During 2Q FY2025, EGY:
- Unaudited sales revenue of A$2.61m, representing a 17.5% increase over the quarter ending 30th September 2024 (“1Q FY2025”);
- reported cash receipts of A$2.35m, a A$890k reduction on 1Q FY2025; and
- Sustained an Order Book of c. A$3.0m.
Operationally, the Board’s conviction as to the merits of the revised business plan is being validated with increased tender opportunities, higher margin sales and the initial tender awarded to the Manufactured and Purchased Sales Divisions associated with a significant infrastructure project in NSW (as detailed to the market on 25th November 2024).
While cash receipts for the quarter were 28% lower than 1Q FY2025, the results were consistent with management expectations and as a consequence of the revised business model transition (as to which refer Market Announcement on 31st October 2024 and prior). Moving forward, the Order Book quantum augurs well for a sustainable increase in both revenue and cash receipts.
EGY CEO Nick Cousins commented:“The business continues to rebuild through the re- positioning of its sales mix as highlighted by both the unaudited sales revenue uplift and a consistently high order book”.
Click here for the full ASX Release
This article includes content from Energy Technologies Limited, licensed for the purpose of publishing on Investing News Australia. This article does not constitute financial product advice. It is your responsibility to perform proper due diligence before acting upon any information provided here. Please refer to our full disclaimer here.
Westport Fuel Systems: Advanced, Clean Fuel Systems that Deliver Economic, Environmental Benefits
Westport Fuel Systems (NASDAQ:WPRT,TSX:WPRT) delivers advanced fuel system technologies, focused on heavy-duty and light-duty vehicles, to reduce carbon emissions without compromising engine performance. The company offers innovative solutions that enable internal combustion engines to operate on alternative low-carbon fuels, including natural gas, renewable natural gas (RNG) and hydrogen.
Westport operates in a rapidly growing and changing clean transportation market driven by stringent emission regulations, increasing fuel costs, and rising demand for sustainable mobility solutions.
The HPDI fuel system is engineered for heavy-duty trucks and industrial applications. By injecting high-pressure natural gas or hydrogen directly into the combustion chamber, HPDI delivers diesel-like torque and power with up to 98 percent lower CO₂ emissions when using hydrogen. This technology is critical for long-haul trucking and other high-load applications, where maintaining performance and range is essential. This technology is now owned under the Cespira JV, which generated a revenue of $16.2 million in Q3 2024.
Company Highlights
- Westport is a pioneer in the development and commercialization of alternative fuel delivery systems for natural gas, renewable natural gas (RNG), propane, and hydrogen-powered internal combustion engines (ICEs).
- The company is rooted in both the heavy-duty and light-duty vehicle market, leveraging Westport’s proprietary fuel technologies to deliver reductions in carbon emissions for both commercial and passenger vehicles.
- Westport’s High-Pressure Controls and Systems segment focuses on fuel management solutions for hydrogen and other pressurized alternative fuels.
- The flagship HPDI technology, now part of the company’s Cespira joint venture with Volvo Group, enables heavy-duty trucks to operate on natural gas or hydrogen, thereby substantially lowering CO₂ emissions while delivering diesel-equivalent or better performance.
- Westport’s growth trajectory is enhanced by key collaborations, most notably via the formation of Cespira, a joint venture with Volvo Group aimed at accelerating the global adoption of the HPDI technology.
This Westport Fuel Systems profile is part of a paid investor education campaign.*
Latest News
Carbonxt Group Investor Kit
- Corporate info
- Insights
- Growth strategies
- Upcoming projects
GET YOUR FREE INVESTOR KIT
Latest Press Releases
Related News
TOP STOCKS
Investing News Network websites or approved third-party tools use cookies. Please refer to the cookie policy for collected data, privacy and GDPR compliance. By continuing to browse the site, you agree to our use of cookies.