The Conversation (0)
Broad strength across businesses and geographies results in mid-single digit revenue growth, driven by execution, innovation, and improved underlying fundamentals
Medtronic plc (NYSE:MDT) today announced financial results for its first quarter of fiscal year 2024 (FY24), which ended July 28, 2023 .
Key Highlights
- Revenue of $7.7 billion increased 4.5% as reported and 6.0% organic
- GAAP diluted earnings per share (EPS) of $0.59 decreased 16%; non-GAAP diluted EPS of $1.20 increased 6%
- Company increases FY24 organic revenue growth and EPS guidance
- Commenced U.S. launches of the MiniMed™ 780G system with Guardian™ 4 sensor in Diabetes and the Micra™ AV2 and Micra™ VR2 leadless pacemakers in Cardiovascular
Financial Results
Medtronic reported Q1 worldwide revenue of $7.702 billion , an increase of 4.5% as reported and 6.0% on an organic basis. The company's organic revenue results reflect broad strength across businesses and geographies, driven by execution, innovation, and improved underlying fundamentals. The organic revenue growth comparison excludes:
- Revenue and the associated impact from foreign currency translation reported as Other, stemming from business separations, including Renal Care Solutions and ongoing manufacturing agreements with Cardinal Health from the divestiture of Patient Care, Deep Vein Thrombosis, and Nutritional Insufficiency; and
- The unfavorable impact from foreign currency translation of $43 million on the remaining segments.
As reported, Q1 GAAP net income and diluted EPS were $791 million and $0.59 , respectively, representing decreases of 15% and 16%, respectively. As detailed in the financial schedules included at the end of this release, Q1 non-GAAP net income and non-GAAP diluted EPS were $1.596 billion and $1.20 , respectively, both representing increases of 6%. Included in non-GAAP diluted EPS was an 8 cent unfavorable impact from foreign currency translation, a 2 cent improvement from what was projected from May rates.
"We are pleased with the strong start to our fiscal year. We executed and delivered another quarter of mid-single digit revenue growth. Our solid results were broad-based, with each of our four segments delivering 6% organic revenue growth," said Geoff Martha , Medtronic chairman and chief executive officer. "We also continue to make great strides on our comprehensive transformation designed to ensure durable growth and create value for shareholders."
Cardiovascular Portfolio
The Cardiovascular Portfolio includes the Cardiac Rhythm & Heart Failure (CRHF), Structural Heart & Aortic (SHA), and Coronary & Peripheral Vascular (CPV) divisions. Revenue of $2.850 billion increased 5.5% as reported and 6.2% organic, with a low-double digit increase in SHA, mid-single digit increase in CRHF, and low-single digit increase in CPV, all on an organic basis.
- CRHF results driven by mid-single digit growth in Defibrillation Solutions, Cardiovascular Diagnostics, Cardiac Ablation Solutions, and Cardiac Pacing Therapies, including mid-teens growth in Micra™ transcatheter pacing systems
- SHA drove low-double digit growth in Structural Heart (TAVR) on continued adoption of Evolut™ FX in the U.S. & Japan , low-double digit growth in Aortic on supply recovery, and high-single digit growth in Cardiac Surgery
- CPV results driven by mid-single digit growth in Peripheral Vascular Health, including low-double digit growth in drug-coated balloons (DCB) and ClosureFast™ and VenaSeal™ superficial vein therapy systems
- Commenced U.S. launches of Micra™ AV2 and Micra™ VR2 leadless pacemakers
Neuroscience Portfolio
The Neuroscience Portfolio includes the Cranial & Spinal Technologies (CST), Specialty Therapies, and Neuromodulation divisions. Revenue of $2.219 billion increased 4.9% as reported and 5.6% organic, with mid-single digit organic increases in CST, Specialty Therapies, and Neuromodulation.
- CST delivered high-single digit Spine & Biologics growth, including high-single digit growth in the U.S., on implant and biologic pull-through fueled by strength in the Aible™ ecosystem; double digit growth in Mazor™ robotics and high-single digit growth in StealthStation™ navigation
- Specialty Therapies results driven by high-teens growth in ENT aided by supply improvement, low-single digit growth in Neurovascular, and low-single digit declines in Pelvic Health
- Neuromodulation led by mid-single digit growth in Brain Modulation and Pain Stim, with strength in new implants of Percept™ PC neurostimulators with BrainSense™ technology and Intellis™ spinal cord stimulators with DTM™ SCS therapy
- Received CE Mark approval last week for the company's next-generation Inceptiv™ spinal cord stimulator with closed-loop sensing
Medical Surgical Portfolio
The Medical Surgical Portfolio includes the Surgical & Endoscopy (SE) and the Patient Monitoring & Respiratory Interventions (PMRI) divisions. Endoscopy was formerly called the Gastrointestinal business. Revenue of $2.039 billion increased 5.5% as reported and 6.1% organic, with a high-single digit organic increase in SE and mid-single digit organic increase in PMRI.
- SE results driven by high-single digit growth in Advanced Surgical Technologies and mid-single digit growth in Endoscopy on continued supply improvement
- SE also drove installed base growth of the Hugo™ robotic-assisted surgery systems; activated new sites in Expand URO U.S. pivotal trial, which continues to progress to plan
- PMRI results driven by mid-single digit growth in Patient Monitoring, with double-digit growth in Nellcor™ pulse oximetry monitor sales and Perioperative Complications
- Company continues to target the intended separation of PMRI through a likely spinoff in the first half of fiscal year 2025
Diabetes
Diabetes revenue of $578 million increased 6.8% as reported and 6.3% organic.
- High-teens growth in Non-U.S. Developed Markets accelerated from recent quarters on increased MiniMed™ 780G system adoption, increased CGM attachment rates on the strength of the Guardian™ 4 sensor, and geographic expansion
- U.S. launch of MiniMed™ 780G system off to great start, resulting in low-30's growth in U.S. durable pump sales
- High-single digit U.S. declines resulted from decreases in CGM and consumable sales given installed base attrition versus the prior year; expected to improve with growth in installed base
- Coverage secured for MiniMed 780G™ system with Guardian™ 4 sensor for over 95% of U.S. population, including expanded access for Medicare beneficiaries in July
- Several clinical and real-world datasets studying the MiniMed™ 780G system with proprietary Meal Detection™ technology presented at American Diabetes Association (ADA) Scientific Sessions in June; showed Time in Range outcomes exceed consensus guidelines and reduction of time spent in hyperglycemia in children and adults
Guidance
The company today raised its FY24 revenue growth and EPS guidance.
The company increased its FY24 organic revenue growth guidance to 4.5% versus the prior range of 4.0% to 4.5%. The organic revenue growth guidance excludes the impact of foreign currency and revenue related to certain businesses reported as Other. If foreign currency exchange rates as of the beginning of August hold, FY24 revenue growth on a reported basis would be approximately 2.75%.
The company increased its FY24 diluted non-GAAP EPS guidance from the prior range of $5.00 to $5.10 to the new range of $5.08 to $5.16 , a 7 cent increase at the midpoint, inline with the company's operational EPS outperformance in the first quarter.
"Our revenue outperformance and focus on expense management drove operating margin expansion and mid-single digit adjusted earnings growth this quarter," said Karen Parkhill , Medtronic EVP & chief financial officer. "Given our first quarter performance, including a 7 cent operational beat on the bottom line, and improved fundamentals, we're raising our full year organic revenue growth and EPS guidance."
Video Webcast Information
Medtronic will host a video webcast today, August 22 , at 8:00 a.m. EDT ( 7:00 a.m. CDT ) to provide information about its businesses for the public, investors, analysts, and news media. This webcast can be accessed by clicking on the Events icon at investorrelations.medtronic.com , and this earnings release will be archived at news.medtronic.com . Within 24 hours of the webcast, a replay of the webcast and transcript of the company's prepared remarks will be available by clicking on the Events icon at investorrelations.medtronic.com .
Medtronic plans to report its FY24 second, third, and fourth quarter results on Tuesday, November 21, 2023 ; February 20, 2024 ; and Thursday, May 23, 2024 , respectively. Confirmation and additional details will be provided closer to the specific event.
Financial Schedules
The first quarter financial schedules and non-GAAP reconciliations can be viewed by clicking on the Investor Events link at investorrelations.medtronic.com . To view a printable PDF of the financial schedules and non-GAAP reconciliations, click here . To view the first quarter earnings presentation, click here .
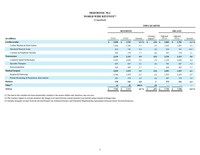
| MEDTRONIC PLC WORLD WIDE REVENUE (1) (Unaudited) | |||||||||||||
| | |||||||||||||
| | FIRST QUARTER | ||||||||||||
| | REPORTED | | | | ORGANIC | ||||||||
| (in millions) | FY24 | | FY23 | | Growth | | Currency | | Adjusted | | Adjusted | | Growth |
| Cardiovascular | $ 2,850 | | $ 2,701 | | 5.5 % | | $ (19) | | $ 2,869 | | $ 2,701 | | 6.2 % |
| Cardiac Rhythm & Heart Failure | 1,446 | | 1,381 | | 4.7 | | (7) | | 1,453 | | 1,381 | | 5.2 |
| Structural Heart & Aortic | 814 | | 741 | | 9.9 | | (5) | | 819 | | 741 | | 10.5 |
| Coronary & Peripheral Vascular | 589 | | 579 | | 1.7 | | (8) | | 597 | | 579 | | 3.1 |
| Neuroscience | 2,219 | | 2,115 | | 4.9 | | (15) | | 2,234 | | 2,115 | | 5.6 |
| Cranial & Spinal Technologies | 1,103 | | 1,043 | | 5.8 | | (7) | | 1,110 | | 1,043 | | 6.4 |
| Specialty Therapies | 695 | | 667 | | 4.2 | | (8) | | 703 | | 667 | | 5.4 |
| Neuromodulation | 420 | | 405 | | 3.7 | | — | | 420 | | 405 | | 3.7 |
| Medical Surgical | 2,039 | | 1,933 | | 5.5 | | (12) | | 2,051 | | 1,933 | | 6.1 |
| Surgical & Endoscopy | 1,546 | | 1,455 | | 6.3 | | (7) | | 1,553 | | 1,455 | | 6.7 |
| Patient Monitoring & Respiratory Interventions | 493 | | 479 | | 2.9 | | (4) | | 497 | | 479 | | 3.8 |
| Diabetes | 578 | | 541 | | 6.8 | | 3 | | 575 | | 541 | | 6.3 |
| Other (3) | 16 | | 81 | | (80.2) | | (3) | | — | | — | | — |
| TOTAL | $ 7,702 | | $ 7,371 | | 4.5 % | | $ (47) | | $ 7,729 | | $ 7,290 | | 6.0 % |
| | |
| (1) | The data in this schedule has been intentionally rounded to the nearest million and, therefore, may not sum. |
| (2) | The currency impact to revenue measures the change in revenue between current and prior year periods using constant exchange rates. |
| (3) | Includes inorganic revenue from the divested Renal Care Solutions business and Transition Manufacturing Agreements from previously divested businesses. |
| MEDTRONIC PLC U.S. (1)(2) REVENUE (Unaudited) | |||||||||||
| | |||||||||||
| | FIRST QUARTER | ||||||||||
| | REPORTED | | ORGANIC | ||||||||
| (in millions) | FY24 | | FY23 | | Growth | | Adjusted | | Adjusted | | Growth |
| Cardiovascular | $ 1,350 | | $ 1,286 | | 5.0 % | | $ 1,350 | | $ 1,286 | | 5.0 % |
| Cardiac Rhythm & Heart Failure | 720 | | 704 | | 2.3 | | 720 | | 704 | | 2.3 |
| Structural Heart & Aortic | 357 | | 312 | | 14.4 | | 357 | | 312 | | 14.4 |
| Coronary & Peripheral Vascular | 273 | | 269 | | 1.5 | | 273 | | 269 | | 1.5 |
| Neuroscience | 1,497 | | 1,419 | | 5.5 | | 1,497 | | 1,419 | | 5.5 |
| Cranial & Spinal Technologies | 821 | | 762 | | 7.7 | | 821 | | 762 | | 7.7 |
| Specialty Therapies | 392 | | 380 | | 3.2 | | 392 | | 380 | | 3.2 |
| Neuromodulation | 284 | | 276 | | 2.9 | | 284 | | 276 | | 2.9 |
| Medical Surgical | 881 | | 831 | | 6.0 | | 881 | | 831 | | 6.0 |
| Surgical & Endoscopy | 619 | | 581 | | 6.5 | | 619 | | 581 | | 6.5 |
| Patient Monitoring & Respiratory Interventions | 262 | | 249 | | 5.2 | | 262 | | 249 | | 5.2 |
| Diabetes | 188 | | 206 | | (8.7) | | 188 | | 206 | | (8.7) |
| Other (3) | 8 | | 25 | | (68.0) | | — | | — | | — |
| TOTAL | $ 3,924 | | $ 3,766 | | 4.2 % | | $ 3,917 | | $ 3,741 | | 4.7 % |
| | |
| (1) | U.S. includes the United States and U.S. territories. |
| (2) | The data in this schedule has been intentionally rounded to the nearest million and, therefore, may not sum. |
| (3) | Includes inorganic revenue from the divested Renal Care Solutions business and Transition Manufacturing Agreements from previously divested businesses. |
| MEDTRONIC PLC WORLD WIDE REVENUE: GEOGRAPHIC (1)(2) (Unaudited) | |||||||||||||
| | |||||||||||||
| | FIRST QUARTER | ||||||||||||
| | REPORTED | | | | ORGANIC | ||||||||
| (in millions) | FY24 | | FY23 | | Growth | | Currency | | Adjusted | | Adjusted | | Growth |
| U.S. | $ 1,350 | | $ 1,286 | | 5.0 % | | $ — | | $ 1,350 | | $ 1,286 | | 5.0 % |
| Non-U.S. Developed | 956 | | 892 | | 7.2 | | 2 | | 954 | | 892 | | 7.0 |
| Emerging Markets | 544 | | 523 | | 4.0 | | (21) | | 565 | | 523 | | 8.0 |
| Cardiovascular | 2,850 | | 2,701 | | 5.5 | | (19) | | 2,869 | | 2,701 | | 6.2 |
| U.S. | 1,497 | | 1,419 | | 5.5 | | — | | 1,497 | | 1,419 | | 5.5 |
| Non-U.S. Developed | 416 | | 407 | | 2.2 | | (4) | | 420 | | 407 | | 3.2 |
| Emerging Markets | 306 | | 290 | | 5.5 | | (11) | | 317 | | 290 | | 9.3 |
| Neuroscience | 2,219 | | 2,115 | | 4.9 | | (15) | | 2,234 | | 2,115 | | 5.6 |
| U.S. | 881 | | 831 | | 6.0 | | — | | 881 | | 831 | | 6.0 |
| Non-U.S. Developed | 772 | | 735 | | 5.0 | | (6) | | 778 | | 735 | | 5.9 |
| Emerging Markets | 386 | | 368 | | 4.9 | | (6) | | 392 | | 368 | | 6.5 |
| Medical Surgical | 2,039 | | 1,933 | | 5.5 | | (12) | | 2,051 | | 1,933 | | 6.1 |
| U.S. | 188 | | 206 | | (8.7) | | — | | 188 | | 206 | | (8.7) |
| Non-U.S. Developed | 315 | | 264 | | 19.3 | | 4 | | 311 | | 264 | | 17.8 |
| Emerging Markets | 75 | | 72 | | 4.2 | | (2) | | 77 | | 72 | | 6.9 |
| Diabetes | 578 | | 541 | | 6.8 | | 3 | | 575 | | 541 | | 6.3 |
| U.S. | 8 | | 25 | | (68.0) | | — | | — | | — | | — |
| Non-U.S. Developed | 5 | | 32 | | (84.4) | | (2) | | — | | — | | — |
| Emerging Markets | 3 | | 24 | | (87.5) | | (1) | | — | | — | | — |
| Other (4) | 16 | | 81 | | (80.2) | | (3) | | — | | — | | — |
| U.S. | 3,924 | | 3,766 | | 4.2 | | — | | 3,917 | | 3,741 | | 4.7 |
| Non-U.S. Developed | 2,463 | | 2,328 | | 5.8 | | (6) | | 2,463 | | 2,297 | | 7.2 |
| Emerging Markets | 1,314 | | 1,276 | | 3.0 | | (41) | | 1,350 | | 1,253 | | 7.7 |
| TOTAL | $ 7,702 | | $ 7,371 | | 4.5 % | | $ (47) | | $ 7,729 | | $ 7,290 | | 6.0 % |
| | |
| (1) | U.S. includes the United States and U.S. territories. Non-U.S. developed markets include Japan, Australia, New Zealand, Korea, Canada, and the countries within Western Europe. Emerging Markets include the countries of the Middle East, Africa, Latin America, Eastern Europe, and the countries of Asia that are not included in the non-U.S. developed markets, as previously defined. |
| (2) | The data in this schedule has been intentionally rounded to the nearest million and, therefore, may not sum. |
| (3) | The currency impact to revenue measures the change in revenue between current and prior year periods using constant exchange rates. |
| (4) | Includes inorganic revenue from the divested Renal Care Solutions business and Transition Manufacturing Agreements from previously divested businesses. |
| MEDTRONIC PLC CONSOLIDATED STATEMENTS OF INCOME (Unaudited) | |||
| | |||
| | Three months ended | ||
| (in millions, except per share data) | July 28, 2023 | | July 29, 2022 |
| Net sales | $ 7,702 | | $ 7,371 |
| Costs and expenses: | | | |
| Cost of products sold, excluding amortization of intangible assets | 2,628 | | 2,516 |
| Research and development expense | 668 | | 692 |
| Selling, general, and administrative expense | 2,613 | | 2,567 |
| Amortization of intangible assets | 429 | | 423 |
| Restructuring charges, net | 54 | | 14 |
| Certain litigation charges | 40 | | — |
| Other operating expense, net | 1 | | 35 |
| Operating profit | 1,268 | | 1,125 |
| Other non-operating income, net | (76) | | (83) |
| Interest expense, net | 148 | | 164 |
| Income before income taxes | 1,196 | | 1,044 |
| Income tax provision | 400 | | 112 |
| Net income | 797 | | 931 |
| Net income attributable to noncontrolling interests | (6) | | (2) |
| Net income attributable to Medtronic | $ 791 | | $ 929 |
| Basic earnings per share | $ 0.59 | | $ 0.70 |
| Diluted earnings per share | $ 0.59 | | $ 0.70 |
| Basic weighted average shares outstanding | 1,330.5 | | 1,329.4 |
| Diluted weighted average shares outstanding | 1,333.8 | | 1,334.5 |
| |
| The data in the schedule above has been intentionally rounded to the nearest million, and therefore, the quarterly amounts may not sum to the fiscal year-to-date amounts. |
| MEDTRONIC PLC GAAP TO NON-GAAP RECONCILIATIONS (1) (Unaudited) | |||||||||||||||||
| | |||||||||||||||||
| | Three months ended July 28, 2023 | ||||||||||||||||
| (in millions, except per share data) | Net | | Cost of | | Gross | | Operating | | Operating | | Income | | Net Income | | Diluted | | Effective |
| GAAP | $ 7,702 | | $ 2,628 | | 65.9 % | | $ 1,268 | | 16.5 % | | $ 1,196 | | $ 791 | | $ 0.59 | | 33.4 % |
| Non-GAAP Adjustments: | | | | | | | | | | | | | | | | | |
| Amortization of intangible assets | — | | — | | — | | 429 | | 5.6 | | 429 | | 364 | | 0.27 | | 15.2 |
| Restructuring and associated costs (2) | — | | (16) | | 0.2 | | 91 | | 1.2 | | 91 | | 76 | | 0.06 | | 16.5 |
| Acquisition and divestiture-related items (3) | — | | (6) | | 0.1 | | 50 | | 0.6 | | 50 | | 46 | | 0.03 | | 6.0 |
| Certain litigation charges | — | | — | | — | | 40 | | 0.5 | | 40 | | 31 | | 0.02 | | 22.5 |
| (Gain)/loss on minority investments (4) | — | | — | | — | | — | | — | | 64 | | 64 | | 0.05 | | — |
| Medical device regulations (5) | — | | (21) | | 0.3 | | 31 | | 0.4 | | 31 | | 25 | | 0.02 | | 22.6 |
| Certain tax adjustments, net (6) | — | | — | | — | | — | | — | | — | | 198 | | 0.15 | | — |
| Non-GAAP | $ 7,702 | | $ 2,586 | | 66.4 % | | $ 1,909 | | 24.8 % | | $ 1,902 | | $ 1,596 | | $ 1.20 | | 15.8 % |
| Currency impact | 47 | | (1) | | 0.2 | | 122 | | 1.4 | | | | | | 0.08 | | |
| Currency Adjusted | $ 7,749 | | $ 2,585 | | 66.6 % | | $ 2,031 | | 26.2 % | | | | | | $ 1.28 | | |
| | | | | | | | | | | | | | | | | | |
| | Three months ended July 29, 2022 | ||||||||||||||||
| (in millions, except per share data) | Net | | Cost of | | Gross | | Operating | | Operating | | Income | | Net Income | | Diluted | | Effective |
| GAAP | $ 7,371 | | $ 2,516 | | 65.9 % | | $ 1,125 | | 15.3 % | | $ 1,044 | | $ 929 | | $ 0.70 | | 10.7 % |
| Non-GAAP Adjustments: | | | | | | | | | | | | | | | | | |
| Amortization of intangible assets | — | | — | | — | | 423 | | 5.7 | | 423 | | 359 | | 0.27 | | 15.4 |
| Restructuring and associated costs (2) | — | | (20) | | 0.3 | | 76 | | 1.0 | | 76 | | 60 | | 0.04 | | 21.1 |
| Acquisition and divestiture-related items (3) | — | | (11) | | 0.1 | | 109 | | 1.5 | | 109 | | 102 | | 0.08 | | 6.4 |
| (Gain)/loss on minority investments (4) | — | | — | | — | | — | | — | | (4) | | (4) | | — | | — |
| Medical device regulations (5) | — | | (18) | | 0.2 | | 32 | | 0.4 | | 32 | | 26 | | 0.02 | | 18.8 |
| Debt redemption premium and other charges (7) | — | | — | | — | | — | | — | | 53 | | 42 | | 0.03 | | 20.8 |
| Certain tax adjustments, net (8) | — | | — | | — | | — | | — | | — | | (13) | | (0.01) | | — |
| Non-GAAP | $ 7,371 | | $ 2,467 | | 66.5 % | | $ 1,765 | | 23.9 % | | $ 1,734 | | $ 1,502 | | $ 1.13 | | 13.3 % |
| | |
| See description of non-GAAP financial measures contained in the press release dated August 22, 2023. | |
| (1) | The data in this schedule has been intentionally rounded to the nearest million or $0.01 for EPS figures, and, therefore, may not sum. |
| (2) | Associated costs include costs incurred as a direct result of the restructuring program, such as salaries for employees supporting the program and consulting expenses. |
| (3) | The charges primarily include business combination costs, changes in fair value of contingent consideration, and charges related to the impending separation of the Patient Monitoring and Respiratory Interventions businesses within our Medical Surgical Portfolio. The prior year included non-cash pre-tax impairments, primarily related to goodwill, as a result of the April 1, 2023 sale of half of the Company's Renal Care Solutions (RCS) business. |
| (4) | We exclude unrealized and realized gains and losses on our minority investments as we do not believe that these components of income or expense have a direct correlation to our ongoing or future business operations. |
| (5) | The charges represent incremental costs of complying with the new European Union (E.U.) medical device regulations for previously registered products and primarily include charges for contractors supporting the project and other direct third-party expenses. We consider these costs to be duplicative of previously incurred costs and/or one-time costs, which are limited to a specific time period. |
| (6) | The charge relates to an income tax reserve adjustment associated with the June 1, 2023 Israeli Central-Lod District Court decision in Medtronic Ventor Technologies Ltd v. Kfar Saba Assessing Office and amortization of previously established deferred tax assets from intercompany intellectual property transactions. |
| (7) | The charges relate to the early redemption of approximately $2.3 billion of debt and were recorded within interest expense, net within the consolidated statements of income. |
| (8) | The net benefit is due to a valuation allowance release associated with certain carryover attributes as a result of the RCS transaction listed above in (3) partially offset by the amortization of previously established deferred tax assets from intercompany intellectual property transactions. |
| MEDTRONIC PLC GAAP TO NON-GAAP RECONCILIATIONS (1) (Unaudited) | |||||||||||||||
| | |||||||||||||||
| | Three months ended July 28, 2023 | ||||||||||||||
| (in millions) | Net Sales | | SG&A | | SG&A | | R&D | | R&D | | Other | | Other | | Other Non- |
| GAAP | $ 7,702 | | $ 2,613 | | 33.9 % | | $ 668 | | 8.7 % | | $ 1 | | — % | | $ (76) |
| Non-GAAP Adjustments: | | | | | | | | | | | | | | | |
| Restructuring and associated costs (2) | — | | (21) | | (0.3) | | — | | — | | 1 | | — | | — |
| Acquisition and divestiture-related items (3) | — | | (16) | | (0.2) | | — | | — | | (27) | | (0.4) | | — |
| Medical device regulations (4) | — | | — | | — | | (10) | | (0.1) | | — | | — | | — |
| (Gain)/loss on minority investments (5) | — | | — | | — | | — | | — | | — | | — | | (64) |
| Non-GAAP | $ 7,702 | | $ 2,575 | | 33.4 % | | $ 658 | | 8.5 % | | $ (26) | | (0.3) % | | $ (141) |
| Currency impact | 47 | | 5 | | (0.1) | | 2 | | — | | (82) | | (1.1) | | 2 |
| Currency Adjusted | $ 7,749 | | $ 2,580 | | 33.3 % | | $ 660 | | 8.5 % | | $ (108) | | (1.4) % | | $ (139) |
| | |
| See description of non-GAAP financial measures contained in the press release dated August 22, 2023. | |
| (1) | The data in this schedule has been intentionally rounded to the nearest million, and, therefore, may not sum. |
| (2) | Associated costs include costs incurred as a direct result of the restructuring program, such as salaries for employees supporting the program and consulting expenses. |
| (3) | The charges primarily include business combination costs, changes in fair value of contingent consideration, and charges related to the impending separation of the Patient Monitoring and Respiratory Interventions businesses within our Medical Surgical Portfolio. |
| (4) | The charges represent estimated incremental costs of complying with the new European Union medical device regulations for previously registered products and primarily include charges for contractors supporting the project and other direct third-party expenses. We consider these costs to be duplicative of previously incurred costs and/or one-time costs, which are limited to a specific time period. |
| (5) | We exclude unrealized and realized gains and losses on our minority investments as we do not believe that these components of income or expense have a direct correlation to our ongoing or future business operations. |
| | |
| MEDTRONIC PLC GAAP TO NON-GAAP RECONCILIATIONS (1) (Unaudited) | |||
| | |||
| | Three months ended | ||
| (in millions) | July 28, 2023 | | July 29, 2022 |
| Net cash provided by operating activities | $ 875 | | $ 1,083 |
| Additions to property, plant, and equipment | (354) | | (426) |
| Free Cash Flow (2) | $ 521 | | $ 657 |
| | |
| See description of non-GAAP financial measures contained in the press release dated August 22, 2023. | |
| (1) | The data in this schedule has been intentionally rounded to the nearest million, and, therefore, may not sum. |
| (2) | Free cash flow represents operating cash flows less property, plant, and equipment additions. |
| MEDTRONIC PLC CONSOLIDATED BALANCE SHEETS (Unaudited)
| ||||
| | ||||
| (in millions) | | July 28, 2023 | | April 28, 2023 |
| ASSETS | | | | |
| Current assets: | | | | |
| Cash and cash equivalents | | $ 1,339 | | $ 1,543 |
| Investments | | 6,537 | | 6,416 |
| Accounts receivable, less allowances and credit losses of $190 and $176, respectively | | 5,806 | | 5,998 |
| Inventories, net | | 5,668 | | 5,293 |
| Other current assets | | 2,518 | | 2,425 |
| Total current assets | | 21,869 | | 21,675 |
| Property, plant, and equipment, net | | 5,665 | | 5,569 |
| Goodwill | | 41,436 | | 41,425 |
| Other intangible assets, net | | 14,434 | | 14,844 |
| Tax assets | | 3,461 | | 3,477 |
| Other assets | | 3,912 | | 3,959 |
| Total assets | | $ 90,776 | | $ 90,948 |
| LIABILITIES AND EQUITY | | | | |
| Current liabilities: | | | | |
| Current debt obligations | | $ 519 | | $ 20 |
| Accounts payable | | 2,239 | | 2,662 |
| Accrued compensation | | 1,695 | | 1,949 |
| Accrued income taxes | | 1,013 | | 840 |
| Other accrued expenses | | 3,581 | | 3,581 |
| Total current liabilities | | 9,047 | | 9,051 |
| Long-term debt | | 24,463 | | 24,344 |
| Accrued compensation and retirement benefits | | 1,092 | | 1,093 |
| Accrued income taxes | | 2,407 | | 2,360 |
| Deferred tax liabilities | | 687 | | 708 |
| Other liabilities | | 1,715 | | 1,727 |
| Total liabilities | | 39,410 | | 39,283 |
| Commitments and contingencies | | | | |
| Shareholders' equity: | | | | |
| Ordinary shares— par value $0.0001, 2.6 billion shares authorized, 1,330,498,304 and | | — | | — |
| Additional paid-in capital | | 24,587 | | 24,590 |
| Retained earnings | | 30,265 | | 30,392 |
| Accumulated other comprehensive loss | | (3,674) | | (3,499) |
| Total shareholders' equity | | 51,178 | | 51,483 |
| Noncontrolling interests | | 188 | | 182 |
| Total equity | | 51,366 | | 51,665 |
| Total liabilities and equity | | $ 90,776 | | $ 90,948 |
| |
| The data in this schedule has been intentionally rounded to the nearest million, and, therefore, may not sum. |
| MEDTRONIC PLC CONSOLIDATED STATEMENTS OF CASH FLOWS (Unaudited) | |||
| | |||
| | Three months ended | ||
| (in millions) | July 28, 2023 | | July 29, 2022 |
| Operating Activities: | | | |
| Net income | $ 797 | | $ 931 |
| Adjustments to reconcile net income to net cash provided by operating activities: | | | |
| Depreciation and amortization | 672 | | 668 |
| Provision for credit losses | 21 | | 15 |
| Deferred income taxes | — | | (18) |
| Stock-based compensation | 73 | | 62 |
| Loss on debt extinguishment | — | | 53 |
| Other, net | 135 | | 121 |
| Change in operating assets and liabilities, net of acquisitions and divestitures: | | | |
| Accounts receivable, net | 164 | | 89 |
| Inventories, net | (410) | | (380) |
| Accounts payable and accrued liabilities | (673) | | (147) |
| Other operating assets and liabilities | 96 | | (311) |
| Net cash provided by operating activities | 875 | | 1,083 |
| Investing Activities: | | | |
| Acquisitions, net of cash acquired | — | | (1,191) |
| Additions to property, plant, and equipment | (354) | | (426) |
| Purchases of investments | (1,916) | | (1,884) |
| Sales and maturities of investments | 1,748 | | 1,886 |
| Other investing activities, net | (17) | | 30 |
| Net cash used in investing activities | (539) | | (1,585) |
| Financing Activities: | | | |
| Change in current debt obligations, net | 500 | | — |
| Proceeds from short-term borrowings (maturities greater than 90 days) | — | | 2,284 |
| Payments on long-term debt | — | | (2,311) |
| Dividends to shareholders | (918) | | (903) |
| Issuance of ordinary shares | 77 | | 43 |
| Repurchase of ordinary shares | (152) | | (336) |
| Other financing activities | (8) | | 273 |
| Net cash used in financing activities | (501) | | (950) |
| Effect of exchange rate changes on cash and cash equivalents | (39) | | (122) |
| Net change in cash and cash equivalents | (204) | | (1,574) |
| Cash and cash equivalents at beginning of period | 1,543 | | 3,714 |
| Cash and cash equivalents at end of period | $ 1,339 | | $ 2,140 |
| Supplemental Cash Flow Information | | | |
| Cash paid for: | | | |
| Income taxes | $ 117 | | $ 260 |
| Interest | 84 | | 68 |
| |
| The data in this schedule has been intentionally rounded to the nearest million, and, therefore, may not sum. |
About Medtronic
Bold thinking. Bolder actions. We are Medtronic. Medtronic plc, headquartered in Dublin, Ireland , is the leading global healthcare technology company that boldly attacks the most challenging health problems facing humanity by searching out and finding solutions. Our Mission — to alleviate pain, restore health, and extend life — unites a global team of 95,000+ passionate people across 150 countries. Our technologies and therapies treat 70 health conditions and include cardiac devices, surgical robotics, insulin pumps, surgical tools, patient monitoring systems, and more. Powered by our diverse knowledge, insatiable curiosity, and desire to help all those who need it, we deliver innovative technologies that transform the lives of two people every second, every hour, every day. Expect more from us as we empower insight-driven care, experiences that put people first, and better outcomes for our world. In everything we do, we are engineering the extraordinary. For more information on Medtronic (NYSE:MDT), visit www.Medtronic.com and follow @Medtronic on Twitter and LinkedIn .
FORWARD LOOKING STATEMENTS
This press release contains forward-looking statements within the meaning of the Private Securities Litigation Reform Act of 1995, which are subject to risks and uncertainties, including risks related to competitive factors, difficulties and delays inherent in the development, manufacturing, marketing and sale of medical products, government regulation and general economic conditions and other risks and uncertainties described in the company's periodic reports on file with the U.S. Securities and Exchange Commission including the most recent Annual Report on Form 10-K of the company, as filed with the U.S. Securities and Exchange Commission. In some cases, you can identify these statements by forward-looking words or expressions, such as "anticipate," "believe," "could," "estimate," "expect," "forecast," "intend," "looking ahead," "may," "plan," "possible," "potential," "project," "should," "going to," "will," and similar words or expressions, the negative or plural of such words or expressions and other comparable terminology. Actual results may differ materially from anticipated results. Medtronic does not undertake to update its forward-looking statements or any of the information contained in this press release, including to reflect future events or circumstances.
NON-GAAP FINANCIAL MEASURES
This press release contains financial measures, including adjusted net income, adjusted diluted EPS, and organic revenue, which are considered "non-GAAP" financial measures under applicable SEC rules and regulations. References to quarterly or annual figures increasing, decreasing or remaining flat are in comparison to fiscal year 2023.
Medtronic management believes that non-GAAP financial measures provide information useful to investors in understanding the company's underlying operational performance and trends and to facilitate comparisons with the performance of other companies in the med tech industry. Non-GAAP net income and diluted EPS exclude the effect of certain charges or gains that contribute to or reduce earnings but that result from transactions or events that management believes may or may not recur with similar materiality or impact to operations in future periods (Non-GAAP Adjustments). Medtronic generally uses non-GAAP financial measures to facilitate management's review of the operational performance of the company and as a basis for strategic planning. Non-GAAP financial measures should be considered supplemental to and not a substitute for financial information prepared in accordance with U.S. generally accepted accounting principles (GAAP), and investors are cautioned that Medtronic may calculate non-GAAP financial measures in a way that is different from other companies. Management strongly encourages investors to review the company's consolidated financial statements and publicly filed reports in their entirety. Reconciliations of the non-GAAP financial measures to the most directly comparable GAAP financial measures are included in the financial schedules accompanying this press release.
Medtronic calculates forward-looking non-GAAP financial measures based on internal forecasts that omit certain amounts that would be included in GAAP financial measures. For instance, forward-looking organic revenue growth guidance excludes the impact of foreign currency fluctuations, as well as significant acquisitions or divestitures. Forward-looking diluted non-GAAP EPS guidance also excludes other potential charges or gains that would be recorded as Non-GAAP Adjustments to earnings during the fiscal year. Medtronic does not attempt to provide reconciliations of forward-looking non-GAAP EPS guidance to projected GAAP EPS guidance because the combined impact and timing of recognition of these potential charges or gains is inherently uncertain and difficult to predict and is unavailable without unreasonable efforts. In addition, the company believes such reconciliations would imply a degree of precision and certainty that could be confusing to investors. Such items could have a substantial impact on GAAP measures of financial performance.
| Contacts : | |
| | |
| Erika Winkels | Ryan Weispfenning |
| Public Relations | Investor Relations |
| +1-763-526-8478 | +1-763-505-4626 |

![]()
![]() View original content to download multimedia: https://www.prnewswire.com/news-releases/medtronic-reports-first-quarter-fiscal-2024-financial-results-301906157.html
View original content to download multimedia: https://www.prnewswire.com/news-releases/medtronic-reports-first-quarter-fiscal-2024-financial-results-301906157.html
SOURCE Medtronic plc