
March 04, 2025
Lahontan Gold Corp. (TSXV:LG,OTCQB:LGCXF) is dedicated to advancing its portfolio of high-quality gold and silver projects in Nevada, a top-tier mining jurisdiction. The company’s flagship Santa Fe Mine — a past-producing operation from 1988 to 1992 — yielded 356,000 ounces of gold and 784,000 ounces of silver. Lahontan is focused on unlocking the mine’s full potential by expanding resources and advancing permitting efforts to fast-track the project toward production.
A recently completed preliminary economic Assessment( PEA) highlights a clear pathway to restarting operations, demonstrating the project’s robust economics. Permitting with the Bureau of Land Management (BLM) is underway, with the company targeting a 2026 construction start.
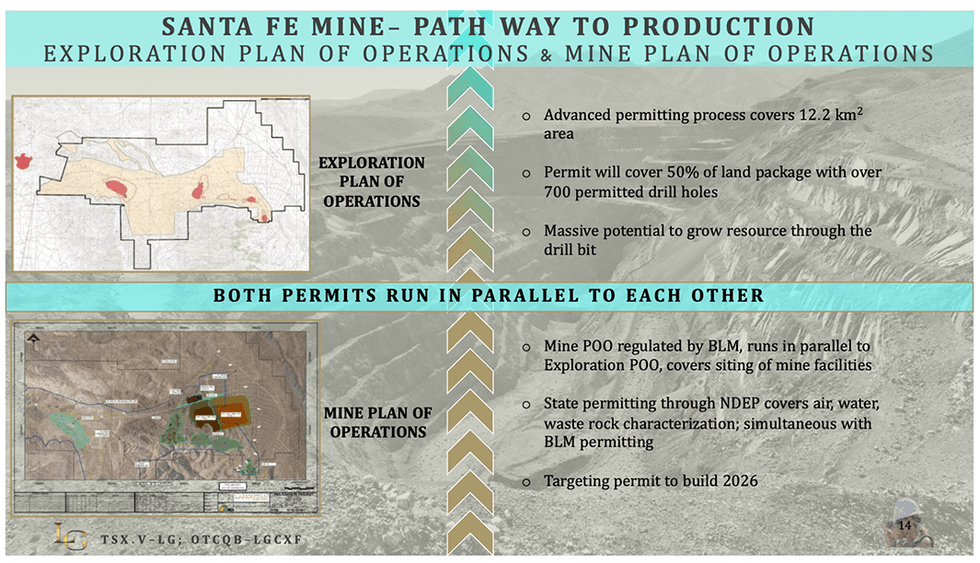
The Santa Fe mine, located in Mineral County, Nevada, spans 26.4 sq km and represents Lahontan Gold’s flagship development project. With an updated mineral resource estimate of 1.95 Moz gold equivalent, the project hosts multiple oxide and sulfide zones that remain open for expansion.
Company Highlights
- Flagship Santa Fe Project: 100 percent owned, past-producing open-pit heap leach mine with a current MRE of 1.95 Moz gold equivalent at a grade of ~0.9 g/t.
- Strategic Nevada Location: Situated in Walker Lane, one of the world’s best mining jurisdictions, with excellent infrastructure, water access, and a mining-friendly regulatory environment.
- Strong Resource Growth Potential: The Santa Fe Mine and its satellite projects, West Santa Fe and Moho, offer exploration upside, with further drilling planned to expand resources.
- Advancing Toward Production: With a positive Preliminary Economic Assessment (PEA) completed in late 2024, Lahontan is aggressively moving toward permitting and development.
- Experienced Leadership: The company is led by an experienced management team with a proven track record in mine development, permitting, and value creation for investors.
This Lahontan Gold profile is part of a paid investor education campaign.*
The Conversation (0)
Sort by
11h
Phillip Magness: Did Trump's Tariffs Just Supercharge a Recession?
Dr. Phillip Magness of the Independent Institute discusses the impact of US President Donald Trump's latest round of tariffs, outlining their potential effects on the economy and stock market.
"This could be the event that supercharges us into a recession — it could be the major trigger," he said.
Don’t forget to follow us @INN_Resource for real-time updates!
Securities Disclosure: I, Charlotte McLeod, hold no direct investment interest in any company mentioned in this article.
Keep reading...Show less
11h
Christopher Aaron: Key Ratio Now in Gold's Favor, Stocks to Grind Lower
Christopher Aaron, founder of iGoldAdvisor and Elite Private Placements, discusses a key signal from the Dow-to-gold ratio, saying a multi-decade trend in favor of stocks has been broken.
This is only the fourth time this situation has played out in the last 125 years.
Don’t forget to follow us @INN_Resource for real-time updates!
Securities Disclosure: I, Charlotte McLeod, hold no direct investment interest in any company mentioned in this article.
Keep reading...Show less
11h
Gold Price Update: Q1 2025 in Review
The price of gold rose to staggering new highs in Q1, gaining nearly 20 percent during the period.
Its strong performance has come on the back of global financial market uncertainty following Donald Trump's inauguration as US president. His administration's sweeping changes have created chaos and benefited gold.
What happened to the gold price in Q1?
Gold began the year at US$2,658.04 per ounce on January 2, and continued to rise throughout the first month of the year, reaching US$2,710.30 during Trump's inauguration on January 20.
Gold price, January 2 to April 7, 2025.
Chart via Trading Economics.
Its upward trajectory accelerated in February. Gold climbed above the US$2,800 mark on February 3, broke through US$2,900 on February 10 and reached a monthly high of US$2,949.90 on February 24.
The metal retracted before the start of March, falling to US$2,856.90 on February 28.
However, March brought more excitement for investors as the price once again started to climb, rising above the US$2,900 mark by March 4. Gold continued to set records during the month, closing above US$3,000 on March 18 and then establishing a new record of over US$3,165 in early April.
Gold had once again dipped below the US$3,000 mark as of April's second week.
Gold and Trump's tariff threats
When Trump won the US election, analysts widely predicted his presidency would be defined by chaos.
Much of his first presidential term saw him challenge standard operating procedures on diplomacy and rhetoric, but he was largely constrained by experienced Washington insiders.
During his second term, Trump has chosen to surround himself with loyalists who agree on policy direction.
Mind Money CEO Julia Khandoshko told the Investing News Network (INN), “The problem is not just their content, but the overall consequences — each one heightens market volatility and creates waves.”
The first quarter brought about destabilization in world financial markets as Trump threatened to impose sweeping 25 percent tariffs on Canada and Mexico, its longtime trade partners. According to the Office of the US Trade Representative, trade between the three countries totaled over US$1.5 trillion in 2022.
Initially Trump was demanding that Canada and Mexico tighten border rules to prevent the flow of migrants and fentanyl into the US. However, he also suggested that the tariff threat stemmed from trade deficits.
The first of Trump's threats came on February 1, when his administration applied tariffs to imports from Canada and Mexico; he walked them back two days later, saying he would delay them until March. When the March deadline arrived, the US once again imposed tariffs on Canada and Mexico, but then retracted them, suggesting they would be added on April 2, when the US was also planning broader reciprocal tariffs against all countries.
In comments to INN, David Barrett, CEO of EBC Financial Group UK, suggested that the Trump administration's tariff threats have had an impact on physical holders of gold.
“There has been a huge spike in the movement of physical gold from around the world into US depositories. This seems to have been driven by the global political stress and potential tariff impacts. The amounts involved have caused disruption in the real demand and promoted new buyers as well," he said.
These movements created significant price differences between the London and New York markets, as UK buyers worried about a shortage of physical gold, while US banks sought to exploit the price gap.
Geopolitical conflicts creating tension
With Russia-Ukraine tensions remaining high and a Middle East conflict that seems poised to boil over, gold investors have responded by seeking the relative safety of physical and liquid assets.
“Broader global political tension, the Middle East conflicts and the Ukraine invasion all add uncertainty, and none of these should be ignored. All those inputs are real and do not look like they will abate anytime soon,” said Barrett.
Both major conflicts in Eastern Europe and the Middle East show no signs of easing.
A ceasefire negotiated between Israel and Hamas earlier this year has collapsed since the beginning of March.
This has led to a serious escalation, with Israel attacking more targets in Gaza and the US increasing its strikes against Iran-backed Houthi rebels in Yemen. The US has also begun more troop and equipment movements into the region, and some analysts believe it is preparing for direct action against Iran. This sentiment was reinforced when Trump stated, “If they don’t make a deal, there will be bombing,” during a call with NBC News on March 30.
The three year war between Russia and Ukraine continues with no end in sight. While it seems that both sides have accepted a ceasefire, the final terms and how it will be implemented remain uncertain.
In recent weeks, Russia has intensified its attacks on Ukraine, targeting critical infrastructure and civilian areas. This has drawn Trump's ire, and he threatened oil and gas tariffs on Russia during his NBC interview.
Gold's foundational drivers still present
Central banks have been a major gold price driver over the past few years, and data published by the World Gold Council on March 4 indicates that they remained active during the first month of the year.
In January, they added more than 18 metric tons of gold to their reserves.
Uzbekistan's central bank led the way with 8 metric tons, while the People’s Bank of China contributed 5 metric tons, increasing its official total to 2,285 metric tons. The National Bank of Kazakhstan added 4 metric tons.
Barrett explained that central bank purchases have been crucial to gold's increases over the past decade.
“Since late 2015, gold has risen from approximately US$1,000 to the present record highs above US$3,000, and central banks have bought up 10,000 metric tons, depending on who you ask. This demand removes supply from the market; they are the ultimate buy-and-hold participants — this has been the real driver for gold,” he said.
For her part, Khandoshko does not view central bank purchasing as significant in the current environment.
“The more important factor here is their monetary policies. Despite attempts to maintain a conservative stance, it is evident that the cycle of interest rate cuts is already underway,” she said.
Lower interest rates have long been correlated with increased gold buying from investors.
In another report, the World Gold Council states that physically backed gold exchange-traded funds (ETFs) saw US$9.4 billion in inflows during February, the strongest since March 2022.
February also marked the third consecutive positive month of "strong global inflows."
Overall, assets under management for these ETFs rose by 4.1 percent to US$306 billion, with collective holdings increasing by 3.1 percent to 3,353 metric tons, the highest month-end level since July 2023.
Gold price outlook for 2025
Among the factors that could provide fresh tailwinds for gold is a new pilot program from the National Financial Regulatory Administration of China. It allows 10 insurance companies to invest in gold.
“Given the recent price rise, the global backdrop and the huge Chinese population, this may develop into a strong driver,” Barrett said. The program permits the designated insurance companies to allocate up to 1 percent of their assets to bullion, which could translate into US$27.4 billion in new gold investments.
Barrett emphasized the importance of monitoring the main drivers in the gold market.
“Clarity on the Trump administration's tariff policy, even its overall economic plan, may alleviate some physical demand as well as those concerned about the need for a hedge,” he said.
Although he noted that conflicts in Ukraine and the Middle East are unlikely to change due to their complexity, he suggested that relief from ceasefires or a reduction in violence could help diminish investor anxiety.
Khandoshko mentioned that as long as geopolitical turmoil, economic instability and currency devaluation persist, the gold price will continue to benefit as these elements are driving its momentum.
“This surge over the US$3,000 mark is just the beginning," she said.
"The yellow metal will continue to increase in price, setting new records. What we are witnessing is not a temporary spike, but a lasting shift in the market. With this breakthrough, a significant pullback seems unlikely. Corrections and volatility may occur, but the market has entered a new era, one that is here to stay."
Don't forget to follow us @INN_Resource for real-time updates!
Securities Disclosure: I, Dean Belder, hold no direct investment interest in any company mentioned in this article.
Editorial Disclosure: The Investing News Network does not guarantee the accuracy or thoroughness of the information reported in the interviews it conducts. The opinions expressed in these interviews do not reflect the opinions of the Investing News Network and do not constitute investment advice. All readers are encouraged to perform their own due diligence.
Keep reading...Show less
11h
Top 7 ASX Gold ETFs in 2025
The price of gold is setting record highs in 2025 as Trump’s global tariff war sparks fresh uncertainty into the markets.
For many investors, gold is a tool for diversification. The precious metal is known for its ability to act as a safe haven and hence operates as a protective option when building a balanced portfolio.
Gold exchange-traded funds (ETFs) give investors a relatively easy way to get exposure to physical gold without having to worry about the extra hassle of buying and storing the metal — not to mention insuring it. Gold ETFs can also track a basket of gold-focused stocks, allowing investors to spread risk instead of betting on individual companies.
Below the Investing News Network has listed the five ASX gold ETFs and exchange-traded products (ETPs) that provide exposure to physical gold, and the two ASX gold ETFs that offer exposure to gold companies. These exchange-traded products are listed by assets under management, and data was retrieved from each company’s website on April 2, 2025.
1. Global X Physical Gold (ASX:GOLD)
Total assets under management: AU$4.48 billion
Unit price: AU$45.91
Previously known as ETFS Physical Gold, Global X Physical Gold is an ETP that promises a "low-cost and secure way to access physical gold via the stock exchange," while avoiding the struggle of storage.
The entity is backed by gold held in a London vault by JPMorgan Chase (NYSE:JPM). Investors can redeem shares for physical gold, not just the cash equivalent; however, this comes with a fee of AU$1,000 per redemption. Global X's website suggests that for smaller orders, a more cost-effective option is selling units on the secondary market.
This ETP has a management fee of 0.4 percent.
2. Perth Mint Gold Structured Product (ASX:PMGOLD)
Total assets under management: AU$1.3 billion
Unit price: AU$49.35
Owned by the Western Australian government, Perth Mint Gold Structured Product is an ETP that tracks the international price of gold in Australian dollars. Investments are backed by gold bullion stored in the Perth Mint. Perth Mint Gold is the only gold product on the ASX that maintains a government guarantee for holdings.
This ETF has a management fee of just 0.15 percent, making it the lowest-cost physical gold ETF on the ASX.
3. BetaShares Gold Bullion ETF (ASX:QAU)
Total assets under management: AU$944.74 million
Unit price: AU$25.61
The BetaShares Gold Bullion ETF tracks the price of physical gold. It is backed by gold bullion stored by JPMorgan Chase in London. Although the ETF is based on physical gold, you do not own physical gold by owning the ETF. Rather, when you sell shares of your ETF, you receive the cash equivalent of the gold.
This ETF has a management fee of 0.59 percent.
4. VanEck Gold Miners ETF (ASX:GDX)
Total assets under management: AU$14.85 million
Unit price: AU$45.96
The VanEck Gold Miners ETF provides investors with exposure to the largest global gold producers and royalty companies involved in the precious metals space. Its top holdings include Newmont (TSX:NGT,NYSE:NEM), Agnico Eagle Mines (TSX:AEM,NYSE:AEM) and Barrick Gold (TSX:ABX,NYSE:GOLD).
This ETF also offers exposure to Australian gold miners, with just over 11 percent of its holdings allocated to Australian gold operators, including Northern Star Resources (ASX:NST,OTC Pink:NESRF).
GDX provides a yearly dividend, with its most recent paid out at AU$0.4025 per share on December 23, 2024. The ETF has a management fee of 0.5 percent.
5. iShares Physical Gold ETF (ASX:GLDN)
Total assets under management: AU$243.43 million
Unit price: AU$39.78
Established in October 2023, iShares Physical Gold ETF was designed to provide investors with exposure to the spot price of gold without the need for physical storage of personal gold holdings.
Like many gold-based ETFs, this product is considered high risk and is intended for investors who are looking to maintain their investment for more than five years. Since its inception, GLDN has benefitted from the relative strength in the gold market and has provided investors with an 18 percent return.
iShares Physical Gold ETF's management fees are among the lowest on this list at 0.18 percent.
6. Betashares Global Gold Miners ETF (ASX:MNRS)
Total assets under management: AU$97.25 million
Unit price: AU$8.18
The Betashares Global Gold Miners ETF allows Australian investors to add a diverse range of global companies in the gold mining space to their portfolio by focusing on the biggest ex-Australia precious metals companies.
Its top holdings include Newmont, Barrick, Agnico Eagle and royalty company Wheaton Precious Metals (TSX:WPM,NYSE:WPM).
This ETF has a management fee of 0.57 percent.
7. VanEck Gold Bullion ETF (ASX:NUGG)
Total assets under management: AU$126.04 million
Unit price: AU$49.62
Established in December 2022, the VanEck Gold Bullion ETF allows investors exposure to the gold market without the need to purchase physical gold. It is backed by physical gold bullion bars sourced from Australian gold producers.
This ETF has a management fee of 0.25 percent and since its inception has returned 27.5 percent.
Don't forget to follow us @INN_Australia for real-time news updates!
Securities Disclosure: I, Dean Belder, hold no direct investment interest in any company mentioned in this article.
Keep reading...Show less
12h
Top 10 Central Bank Gold Reserves
Global central banks own about 17 percent of all the gold ever mined, with reserves topping 37,755 metric tons (MT) at the end of 2024. They acquired the vast majority after becoming net buyers of the metal in 2010.
Central banks purchase gold for a number of reasons: to mitigate risk, to hedge against inflation and to promote economic stability. Increased concerns over another global financial crisis have as expected led central banks once again to build up their gold reserves.
In a mid-2024 survey, the World Gold Council (WGC) said that 81 percent of the central bankers it polled expect global gold reserves to increase over the next 12 months. The precious metal’s “long-term store of value” as a guiding factor in gold purchases was cited by 42 percent of respondents.
Central banks added 1,044.6 MT of gold to their vaults in 2024, the third year in a row that gold purchases in this segment surpassed the 1,000 MT mark. In the fourth quarter of 2024 alone, central banks picked up another record 332.9 MT of gold, reported the WGC.
Yearly central bank gold purchases since 2019.
Chart via the WGC.
Twenty-nine percent of the WGC's survey respondents indicated plans to grow their gold reserves, up 5 percent from the previous year. Three percent reported their institution is planning to decrease its gold holdings, which was unchanged from the previous year.
The WGC believes that central bank gold purchases will continue to be a major driver of gold demand in 2025.
Which central banks hold the most gold?
Read on to find out the 10 top countries by central bank gold holdings, as per data from the WGC, including recent Q4 2024 and full-year 2024 reports.
1. United States
Gold reserves: 8,133.46 MT
When it comes to the largest gold depository in the world, the American central bank is number one with 8,133.46 MT.
A large percentage of US gold is held in “deep storage” in Denver, Fort Knox and West Point. As the US Treasury explains, deep storage is “that portion of the US Government-owned gold bullion reserve which the Mint secures in sealed vaults that are examined annually by the Treasury Department’s Office of the Inspector General and consists primarily of gold bars.”
The rest of US-owned reserves are held as working stock, which the country's mint uses as raw material to mint congressionally authorized coins.
2. Germany
Gold reserves: 3,351.53 MT
The Bundesbank, Germany’s central bank, currently owns 3,351.53 MT of gold. Like many of the central banks on this list, the German national bank stores over half of its stock in foreign locations in New York, London and France.
The Bundesbank’s foreign gold reserves came into question in 2012, when the German Federal Court of Auditors, the Bundesrechnungshof, was openly critical of the Bundesbank’s gold auditing.
In response, the German bank issued a public statement defending the security of foreign banks. Privately, the Bundesbank then began the arduous process of repatriating its gold stock back to German soil. By 2016, more than 583 MT of gold had been transferred back to Germany.
Nearly half of Germany’s gold holdings are stored in Frankfurt, while more than a third are in New York, an eighth of its holdings are in London, and a miniscule amount are held in in Paris.
The economic upheaval and geopolitical volatility brought about by US President Donald Trump's tariff wars and adversarial posturing toward Europe led Germany to consider further repatriating its gold, reported The Telegraph in April 2025. About 1,200 metric tons of Germany's gold holdings are stored in the vaults of the New York Federal Reserve in Manhattan.
3. Italy
Gold reserves: 2,451.84 MT
Banca d’Italia, the national bank of Italy, began amassing its gold in 1893, when three separate financial institutions merged into one. From there, its 78 MT slowly grew into the 2,451.84 MT the country now owns.
Like Germany, Italy stores parts of its reserves offshore. In total, 141.2 MT are located in the UK, 149.3 are in Switzerland and 1,061 are kept in the US Federal Reserve. Italy houses 1,100 MT of gold domestically.
4. France
Gold reserves: 2,437 MT
The Banque de France has 2,437 MT of gold reserves, all of which it keeps on hand. The precious metal is stored in the bank’s secure underground vault, dubbed La Souterraine, which is located 27 meters below street level.
La Souterraine’s gold vaults are one of the four designated gold depositories of the International Monetary Fund.
According to Investopedia, the collapse of the Bretton Woods gold standard system was in part due to former French President Charles de Gaulle, who “called the U.S. bluff and began actually trading dollars in for gold from the Fort Knox reserves.” At the time, US President Richard Nixon “was forced to take the U.S. off the gold standard, ending the dollar's automatic convertibility into gold.”
5. Russia
Gold reserves: 2,332.74 MT*
The Bank of Russia is the official central bank of the Russian Federation and owns 2,332.74 MT of gold. Like France, Russia’s central bank has opted to store all its physical gold domestically. The Bank of Russia stores two-thirds of its gold reserves in a bank building in Moscow, and the remaining one-third in Saint Petersburg.
The majority of the yellow metal is in the form of large, variable-weight standard gold bars weighing between 10 and 14 kilograms. There are also smaller bars on site weighing as much as 1 kilogram each.
Russia, which is the second largest gold producer by country, has been a steady purchaser of the precious metal since roughly 2007, with sales ramping up significantly between 2015 and 2020. However, Russia’s refineries were banned from selling gold bullion into the London market following the country’s invasion of Ukraine. Sanctions by the west also include a freeze on about half of Russia’s gold reserves.
In early 2022, Russia tied its currency, the ruble, to the yellow metal. "The plan was to shift the currency away from a pegged value and into the gold standard itself so the ruble would become a credible gold substitute at a fixed rate," according to Robert Huish, an Associate Professor in International Development Studies at Dalhousie University.
*This figure does not reflect year-end 2024, including the at least 3.1 MT purchased in 2024, per the WGC, which is awaiting further data to update the 2024 total.
6. China
Gold reserves: 2,279.56 MT
The central bank for Mainland China is the People’s Bank of China (PBoC), located in Beijing. According to the WGC, the national financial institute stores 2,279.56 MT of gold, most which has been purchased since 2000. In 2001, the PBoC had 400 MT of gold in reserve, but in just a little more than two decades that total has climbed by 459 percent.
The PBoC issues the Panda gold coin, which was first created in 1982. The Panda coin is now one of the top five bullion coins issued by a central bank. It is among the ranks of the American Eagle, Canadian Maple Leaf, South African Krugerrand and Australian Gold Nugget.
The PBoC was one of the top gold buyers out the world's central banks for 2024, purchasing another 44 MT of gold during the year. April 2024 marked the 18th consecutive month of gold buying for China's central bank, which paused its purchases afterward until picking them up again in November.
7. Switzerland
Gold reserves: 1,039.94 MT
Holding the seventh largest central bank gold reserves is the Swiss National Bank. Its 1,039.94 MT of gold are owned by the state of Switzerland, but the central bank manages and maintains the reserve.
After years of opaqueness regarding the country’s golden treasure trove, the Swiss Gold Initiative, or Save our Swiss Gold campaign, was launched in 2011.
The publicity culminated in a national referendum in 2014, asking citizens to vote on three proposals. The first was a mandate for all reserve gold to be held physically in Switzerland. The other two dealt with the central bank’s ability to sell its gold reserves, along with a decree that 20 percent of the Swiss bank’s assets be held in gold.
The referendum was unsuccessful, but did prompt the bank to be more transparent. In a 2013 release, the central bank reported that 70 percent of its gold reserve was held domestically, 20 percent was located at the Bank of England and 10 percent was stored with the Bank of Canada.
8. India
Gold reserves: 876.18 MT
The Reserve Bank of India is another central bank that has fervently acted to increase its holdings in recent years. It began adding to its gold assets in 2017; however, the majority of its purchases have taken place in the past four years.
Strikingly, after India's central bank purchased 16 MT of gold in 2023, the institution scooped up another 72 MT of the precious metal in 2024.
While more than half of its gold is held overseas in safe custody with the Bank of England and the Bank of International Settlements, about a third of its gold is held domestically. In June 2024, India repatriated 100 MT of gold from the United Kingdom. This was the first time since 1991 that the Reserve Bank of India moved its overseas gold holdings back home.
9. Japan
Gold reserves: 845.97 MT
Public information about the Bank of Japan’s gold reserves is hard to come by. In 2000, the island nation was holding approximately 753 MT of the yellow metal. By 2004, the Bank of Japan’s gold store had grown to 765.2 MT, and remained at that level until March 2021, when the country purchased 80.76 MT of gold.
10. Netherlands
Gold reserves: 612.45 MT
Rounding out this list of the top central bank gold reserves is the Dutch National Bank (DNB), the central bank of the Netherlands. Like Switzerland, the Dutch central bank stores as much as 38 percent of its gold in Canada’s national reserve. Another 31 percent, in the form of 15,000 gold bars, is held in a domestic vault, while the remaining 31 percent is located in New York’s Federal Reserve bank.
In a report, the DNB describes gold as the supreme safe-haven asset. “Central banks such as DNB have therefore traditionally had a lot of gold in stock. After all, gold is the ultimate nest egg: the trust anchor for the financial system,” it reads. “If the entire system collapses, the gold supply provides collateral to start over. Gold gives confidence in the strength of the central bank’s balance sheet. That gives a safe feeling.”
*11. International Monetary Fund
Gold reserves: 2,814.1 MT
The gold reserve held by the International Monetary Fund is the third largest in terms of size. The large gold reserve was amassed primarily during the founding of the international organization in 1944.
In that inaugural year, it was decided that “25 percent of initial quota subscriptions and subsequent quota increases were to be paid in gold.”
Since 1944, the International Monetary Fund has added gold through the repayment of debts owed by member countries. Nations can also exchange gold for another member country’s currency.
This is an updated version of an article first published by the Investing News Network in 2020.
Don’t forget to follow us @INN_Resource for real-time updates!
Securities Disclosure: I, Melissa Pistilli, hold no direct investment interest in any company mentioned in this article.
Keep reading...Show less
15h
Sun Summit Files NI 43-101 Technical Report for the Inaugural Mineral Resource Estimate on the Buck Project, Central B.C.
Sun Summit Minerals Corp. (TSXV: SMN) (OTCQB: SMREF) ("Sun Summit" or the "Company") is pleased to announce that it has filed an independent technical report (the "Technical Report") with a mineral resource estimate (MRE) as described more fully in the Technical Report and the Company's news release dated February 26, 2025.
The Technical Report titled "2025 Mineral Resource Estimate for the Buck Main Deposit NI 43-101 Technical Report", dated April 2, 2025 (effective date of January 28, 2025), has been prepared by Moose Mountain Technical Services, and is available on the Company's Website (https://sunsummitminerals.com/investors/presentations-downloads/) and on SEDAR+ (www.sedarplus.ca) under Sun Summit's issuer profile.
Highlights:
- Inferred Mineral Resources at Buck Main are estimated to include 820,400 oz AuEq1 (775,500 oz gold and 8,435,000 oz silver) at a grade of 0.489 g/t AuEq1 (0.462 g/t Au, 5.0 g/t Ag) contained within 52.2 Mt.
- Indicated Mineral Resources at Buck Main are estimated to include 19,100 gold equivalent ounces1 (oz AuEq) (18,300 oz gold and 158,000 oz silver) at a grade of 0.519 g/t gold equivalent1 (g/t AuEq) (0.496 g/t Au, 4.3 g/t Ag) contained within 1.15 million tonnes (Mt).
- The near-surface Mineral Resource at Buck Main is constrained within an optimized open-pit shell using a 0.25 g/t AuEq cutoff, ensuring reasonable prospects for economic extraction.
- Additional upside at Buck Main as the deposit remains open for expansion in most directions and at depth.
- Effective discovery with average drill costs of CAD $18 per ounce of AuEq included in the MRE.
Notes:
1. Gold Equivalent (AuEq) grade is based on AuEq = Au + 0.0053*Ag (see notes to Table 1 below)
The Buck MRE is centered on the Buck Main deposit, 12 km south of Houston, BC. The road accessible deposit comprises a broad, 800 metre striking zone of intermediate-sulfidation epithermal-related gold-silver mineralization hosted in intermediate to felsic volcanics and intrusions. The MRE is based on 42,440 metres of drilling in 161 holes, of which 34,386 metres in 98 holes were completed by Sun Summit between 2020 and 2023 (Figures 1 and 2, Table 3).
Buck Main Mineral Resource Estimate
Table 1. Summary of Indicated and Inferred Mineral Resources for the Buck Main deposit
Class | AuEq Cutoff | In Situ Tonnage and Grade | AuEq Metal | Au Metal | Ag Metal | ||||
Tonnage | AuEq | Au | Ag | NSR | |||||
(gpt) | (ktonnes) | (gpt) | (gpt) | (gpt) | ($CDN) | (kOz) | (kOz) | (kOz) | |
Indicated | 0.25 | 1,148 | 0.519 | 0.496 | 4.3 | 40.40 | 19.1 | 18.3 | 158 |
Inferred | 0.25 | 52,224 | 0.489 | 0.462 | 5.0 | 38.04 | 820.4 | 775.5 | 8,435 |
Notes to the 2025 Resource Table:
- Resources are reported using the 2014 CIM Definition Standards and were estimated using the 2019 CIM Best Practices Guidelines, as required National Instrument 43-101 - Standards of Disclosure for Mineral Projects ("NI 43-101")
- The base case Mineral Resource has been confined by "reasonable prospects of eventual economic extraction" shape using the following assumptions:
- Metal prices of US$2250/oz Gold, US$26/oz Silver
- Metallurgical recovery of 79% Gold and 38% Silver
- Payable metal of 95% Silver, 99% Gold in dore
- Forex of 0.72 $US:$CDN
- Offsite costs (transport, smelter treatment and refining) of CDN$8.50/oz Gold and CDN$0.25/oz Silver.
- Processing Costs of CDN$12/tonne milled and General & Administrative (G&A) costs of CDN$ 2.50/ tonne milled
- Mining cost of CDN$2.56 / tonne for mineralized material and CDN$2.50/tonne for waste
- 45-degree pit slopes
- The 120% price case pit shell is used for the confining shape
- The resulting net smelter return (NSR) for the purpose of the AuEq calculation = Au*CDN$98.60/g*79% recovery rate + Ag*CDN$1.08/g*38% recovery rate
- The resulting AuEq = Au + 0.0053*Ag
- Numbers may not add due to rounding
- Mineral resources are not mineral reserves and do not have demonstrated economic viability. There is no certainty that all or any part of the estimated mineral resources will be converted into mineral reserves.
The Mineral Resources for the Buck Main deposit have been estimated using a 0.25 g/t AuEq cutoff determined using assumptions listed in the footnotes of Table 1. These assumptions satisfy the requirements of reasonable prospects for eventual economic extraction. Table 2 shows cutoff sensitivities at different grades.
Table 2. Buck Main deposit cutoff sensitivities
Class | AuEq Cutoff (gpt) | In Situ Tonnage and Grade | AuEq Metal (kOz) | Au Metal (kOz) | Ag Metal (kOz) | ||||
Tonnage (ktonnes) | AuEq (gpt) | Au (gpt) | Ag (gpt) | NSR ($CDN) | |||||
Indicated | 0.2 | 1,604 | 0.435 | 0.414 | 3.9 | 33.85 | 22.4 | 21.3 | 203 |
0.25 | 1,148 | 0.519 | 0.496 | 4.3 | 40.40 | 19.1 | 18.3 | 158 | |
0.3 | 852 | 0.605 | 0.580 | 4.6 | 47.09 | 16.6 | 15.9 | 126 | |
0.35 | 645 | 0.695 | 0.669 | 5.0 | 54.12 | 14.4 | 13.9 | 103 | |
0.4 | 494 | 0.793 | 0.765 | 5.4 | 61.76 | 12.6 | 12.1 | 85 | |
0.5 | 317 | 0.989 | 0.957 | 6.0 | 76.99 | 10.1 | 9.8 | 61 | |
1 | 91 | 1.783 | 1.743 | 7.5 | 138.87 | 5.2 | 5.1 | 22 | |
Inferred | 0.2 | 70,847 | 0.419 | 0.394 | 4.7 | 32.60 | 953.5 | 897.2 | 10,617 |
0.25 | 52,224 | 0.489 | 0.462 | 5.0 | 38.04 | 820.4 | 775.5 | 8,435 | |
0.3 | 39,248 | 0.560 | 0.532 | 5.3 | 43.60 | 706.5 | 670.9 | 6,721 | |
0.35 | 30,088 | 0.632 | 0.602 | 5.6 | 49.21 | 611.3 | 582.5 | 5,419 | |
0.4 | 23,644 | 0.703 | 0.671 | 5.9 | 54.71 | 534.0 | 510.3 | 4,477 | |
0.5 | 15,697 | 0.833 | 0.800 | 6.3 | 64.87 | 420.4 | 403.6 | 3,171 | |
1 | 3,126 | 1.485 | 1.440 | 8.5 | 115.64 | 149.2 | 144.7 | 857 |
Table 3. Drill data used in the Mineral Resources Estimate
Year | Total Number of DHs | Total Depth (m) | Length Assayed (m) | Total % Assayed (m) | Number of DHs within Domains | Assayed Within Modelled Domains (m) | % Assayed within the Domains |
Total | 161 | 42,440 | 39,737 | 94% | 123 | 27,034 | 99% |
Figure 1: Buck Main Drilling and Resource Pit Outline
To view an enhanced version of this graphic, please visit:
https://images.newsfilecorp.com/files/6142/247455_b4b1af61746b7add_001full.jpg
Figure 2: Buck Main 3D View of Resource Constraining Pit showing AuEq blocks above 0.2 g/t
To view an enhanced version of this graphic, please visit:
https://images.newsfilecorp.com/files/6142/247455_b4b1af61746b7add_002full.jpg
Discovery Metrics
Sun Summit has efficiently delineated the Buck Main deposit with a total drilling cost of approximately CAD$18 per AuEq ounce included in the MRE. Since 2020, the Company has completed 98 drill holes at Buck Main, totaling over 36,400 meters. The MRE was informed by assay results from 123 drill holes and 27,034 metres of assayed intervals. The Company incurred CAD $15 million in drilling expenditures since 2020.
The low discovery cost reflects the efficiency of Sun Summit's exploration strategy, which included systematic targeting using advanced geological modeling, geophysical surveys, and geochemical analysis. This exploration success underscores the strong potential for further resource growth, as the deposit remains open in multiple directions.
Next Steps
- Additional metallurgical testing will be initiated to optimize metal recoveries and evaluate potential byproduct elements, ensuring the economic viability of future mining operations.
- Further drilling designed to investigate the extents of the Buck Main deposit is recommended. Areas open to the north, west, and east will be targeted in future drill programs.
National Instrument 43-101 Disclosure
The Buck Main MRE was prepared by Sue Bird, M.Sc., P.Eng., V.P. of Resources and Engineering at Moose Mountain Technical Services, an independent Qualified Person as defined by NI 43-101. Darcy Baker, P.Geo, President of Equity Exploration Consultants Ltd, assisted in the preparation of the report and is the Qualified Person responsible for certain sections of the report. Sue Bird has reviewed and approved the technical information about the MRE in this news release.
Mineral resources that are not mineral reserves do not have demonstrated economic viability; however, a reasonable prospect of eventual economic extraction pit has been used to confine the Mineral Resource Estimate using parameters detailed in the table notes.
The QP for the Mineral Resource Estimate is not aware of any environmental, permitting, legal, title, taxation, socio-economic, marketing, political, or other relevant factors that could materially affect the potential development of Mineral Resource Estimate. Factors that may affect the estimates include: metal price assumptions, changes in interpretations of mineralization geometry and continuity of mineralization zones, changes to kriging assumptions, metallurgical recovery assumptions, operating cost assumptions, confidence in the modifying factors, including assumptions that surface rights to allow mining infrastructure to be constructed will be forthcoming, delays or other issues in reaching agreements with local or regulatory authorities and stakeholders, and changes in land tenure requirements or in permitting requirement.
This news release has been reviewed and approved by Sun Summit's Vice President Exploration, Ken MacDonald, P. Geo., a "Qualified Person" as defined in National Instrument 43-101 Standards of Disclosure for Mineral Projects of the Canadian Securities Administrators.
Upcoming Events
Sun Summit is pleased to announce its participation in two regional BC events. The Company will display drill core from the 2024 JD exploration program and drill core from the Buck Main zone from April 8-9 at the KEG 2025 Conference and Trade Show (https://www.keg.bc.ca/conference/default.htm), and, again at the Minerals North Conference (https://mineralsnorth.ca/) in Prince George, BC, from April 30 to May 2.
Community Engagement
Sun Summit is engaging with First Nations on whose territory our projects are located and is discussing their interests and identifying contract and work opportunities, as well as opportunities to support community initiatives. The Company looks forward to continuing to work with local and regional First Nations with ongoing exploration.
About the Buck Project
The Buck Project is situated in a historic mining district near Houston, B.C., with excellent nearby infrastructure that allows for year-round, road-accessible exploration.
The project is host to the Buck Main intermediate-sulfidation epithermal-related gold-silver-zinc system. Most of the mineralization drilled to date at Buck Main consists of long, continuous zones of disseminated and breccia-hosted, bulk tonnage-style gold-silver-zinc. Vein-hosted, high-grade mineralization has also been intersected near the center of Buck Main.
Exploration at the Buck Project is focused on investigating the lateral and vertical extent of gold-silver-zinc mineralization at the Buck Main system, and to define additional drill targets across the entire land package through systematic exploration programs.
About Sun Summit
Sun Summit (TSX-V: SMN; OTCQB: SMREF) is a mineral exploration company focused on expansion and discovery of district scale gold and copper assets in British Columbia. The Company's diverse portfolio includes the JD Project in the Toodoggone region of north-central B.C., and the Buck Project in central B.C.
Further details are available at www.sunsummitminerals.com.
Link to Figures
On behalf of the board of directors
Niel Marotta
Chief Executive Officer & Director
info@sunsummitminerals.com
For further information, contact:
Matthew Benedetto, Simone Capital
mbenedetto@simonecapital.ca
Tel. 416-817-1226
Forward-Looking Information
Statements contained in this news release that are not historical facts may be forward-looking statements, which involve risks, uncertainties and other factors that could cause actual results to differ materially from those expressed or implied by such forward-looking statements. In addition, the forward-looking statements require management to make assumptions and are subject to inherent risks and uncertainties. There is significant risk that the forward-looking statements will not prove to be accurate, that the management's assumptions may not be correct and that actual results may differ materially from such forward-looking statements. Accordingly, readers should not place undue reliance on the forward-looking statements. Generally forward-looking statements can be identified by the use of terminology such as "anticipate", "will", "expect", "may", "continue", "could", "estimate", "forecast", "plan", "potential" and similar expressions. Forward-looking statements contained in this press release may include, but are not limited to, estimates of mineral resources, potential mineralization, exploration plans, and engagement with First Nations communities. These forward-looking statements are based on a number of assumptions which may prove to be incorrect which, without limiting the generality of the following, include: risks inherent in exploration activities; the impact of exploration competition; unexpected geological or hydrological conditions; changes in government regulations and policies, including trade laws and policies; failure to obtain necessary permits and approvals from government authorities; volatility and sensitivity to market prices; volatility and sensitivity to capital market fluctuations; the ability to raise funds through private or public equity financings; environmental and safety risks including increased regulatory burdens; weather and other natural phenomena; and other exploration, development, operating, financial market and regulatory risks. The forward-looking statements contained in this press release are made as of the date hereof or the dates specifically referenced in this press release, where applicable. Except as required by applicable securities laws and regulation, Sun Summit disclaims any intention or obligation to update or revise any forward-looking statement, whether as a result of new information, future events or otherwise, except as required by applicable securities laws. All forward-looking statements contained in this press release are expressly qualified by this cautionary statement.
Neither the TSX Venture Exchange nor its Regulation Services Provider (as that term is defined in the policies of the TSX Venture Exchange) accepts responsibility for the adequacy or accuracy of this release.
Keep reading...Show less
Latest News
Latest Press Releases
Related News
TOP STOCKS
American Battery4.030.24
Aion Therapeutic0.10-0.01
Cybin Corp2.140.00
Investing News Network websites or approved third-party tools use cookies. Please refer to the cookie policy for collected data, privacy and GDPR compliance. By continuing to browse the site, you agree to our use of cookies.