The Conversation (0)

Coelacanth Energy (TSXV:CEI) is a junior oil and natural gas exploration and development company exploring the prolific Montney region in northeastern British Columbia, Canada. Coelacanth is strategically positioned to harness the potential of one of the most resource-rich natural gas basins in North America with a substantial landholding of approximately 150 net sections in the Two Rivers area of Montney.
The company is in the process of deploying $ 80 million to facilitate the smooth transition from exploration to production. Coelacanth’s financial health is further evidenced by its $64.4 million in working capital as of Q2 2024.
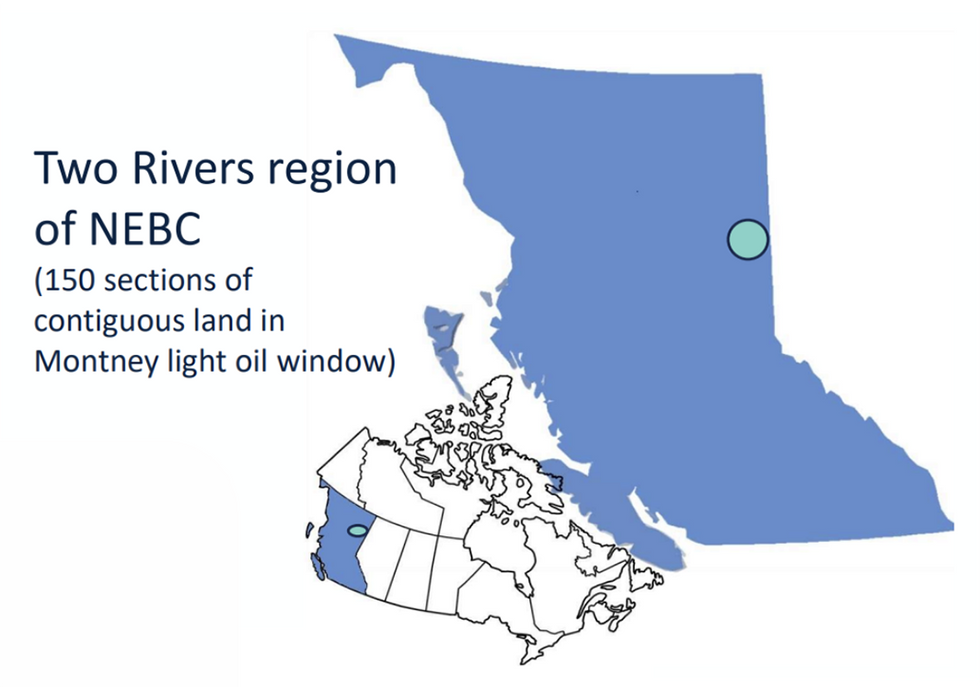
Coelacanth’s landholdings are strategically located in the Two Rivers area of Montney, giving it access to a highly productive portion of the basin. Unlike many junior exploration companies, Coelacanth is drill-ready, positioning it favorably among its peers. By securing significant infrastructure and landholdings, Coelacanth ensures its ability to tap into the natural gas and oil resources that lie beneath its properties, a key advantage in the competitive Montney region.
This Coelacanth Energy profile is part of a paid investor education campaign.*
Click here to connect with Coelacanth Energy (TSXV:CEI) to receive an Investor Presentation