The Conversation (0)

Red Mountain Mining Limited (“RMX” or the “Company”) is pleased to advise that it has received gold results for 91 rock grab samples collected during September from the Company’s 100%-owned Flicka Lake prospect in Ontario, Canada. The rock chip sampling was carried out in parallel with a soil sampling program. Approximately 400 locations were visited within the Flicka Lake claims and 91 rock grab samples and 283 soil samples were collected and submitted for multielement geochemical analysis, including gold by Flame Assay and a base metal suite by four acid digest with ICP-OES finish. Soil results assay results are expected before the end of November.
HIGHLIGHTS
As outlined in RMX’s ASX announcement of 30 October 2024, the rock and soil sampling program was designed to test ten target zones defined using available geological and geophysical data for the Flicka Lake tenement. Zones sampled included the Flicka Zone, previously identified and sampled by Troon Ventures in the early 2000s.
High gold grades for the Flicka Zone confirmed by rock chip sample results
The gold values returned for the 91 rock chip samples are shown on Figure 1 and Figure 2 and listed on Table 1. The best results were obtained from Vein #2 and Vein #3 of the Flicka Zone, with peak values of:
The RMX rock chip results are consistent with historical rock chip and channel sampling results reported by Troon Ventures for the Flicka Zone (Figure 2) that range up to 16.88ppm (16.88 g/t Au) for Vein #1, 12.96ppm (12.96 g/t Au) for Vein #2 and 20.067ppm (20.067 g/t Au) for Vein #3 (refer to RMX ASX Announcement 30 October 2024).
The gold results to date from the Flicka Zone veins are comparable to the recorded grade of the Golden Patricia Mine (refer to Figure 4), a steeply dipping narrow quartz vein system averaging only 40cm in width that is located approximately 25km NE of the Flicka Lake project area. Between 1987 and 1997, Golden Patricia produced 0.62Moz of gold from 1.22Mt of ore averaging 14.4ppm (14.4 g/t Au)1.
An additional pyritic vein sample, located ~800m WSW of the Flicka Zone along the strike of and striking approximately parallel to the main Flicka Zone shear (Figure 1) returned a value of 0.514ppm (0.514 g/t Au), which highlights the potential for the high-grade mineralisation sampled at the Flicka Zone to persist along the shear system.
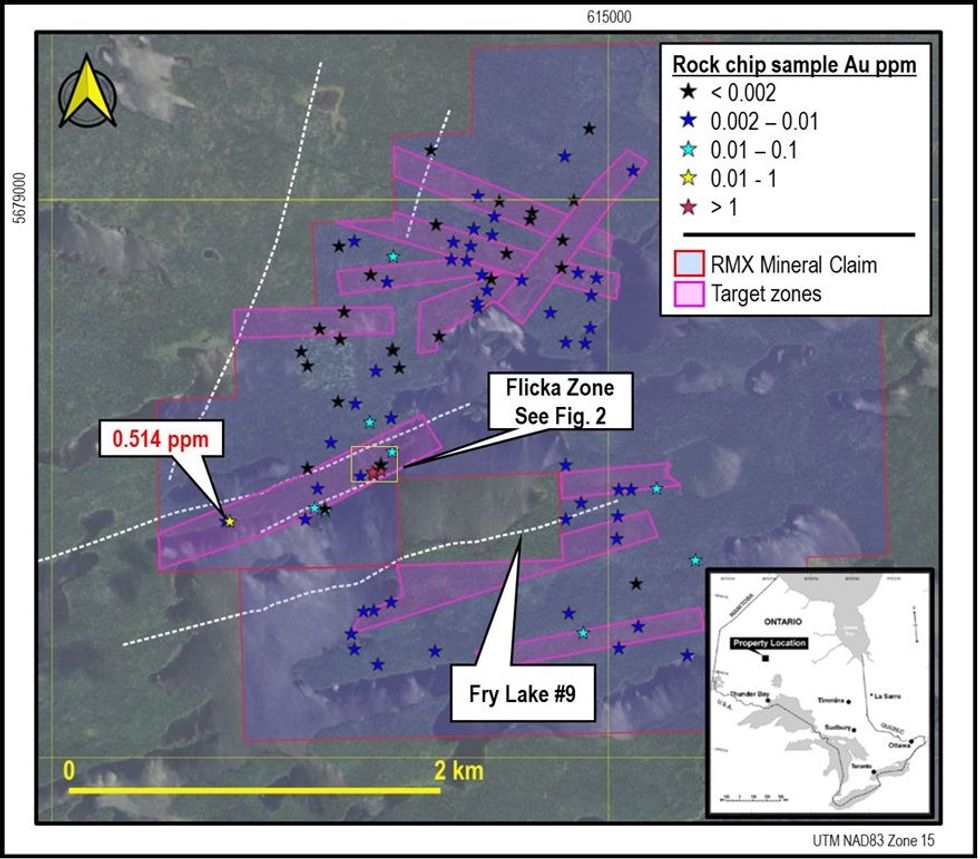 Figure 1: RMX rock chip gold results for the Flicka Lake project. Values of > 0.5ppm (0.5 g/t Au) outside of the Flicka Zone are shown. For detail of sampling at the Flicka Zone refer to Figure 2. The white dashed lines are faults and shear zones mapped by Troon Ventures in 2003. Note the relationship between the Flicka Lake and Fry Lake #9 gold mineral occurrences and the NNE- trending shear zones. Fry Lake #9 lies outside of the RMX mineral claims area.
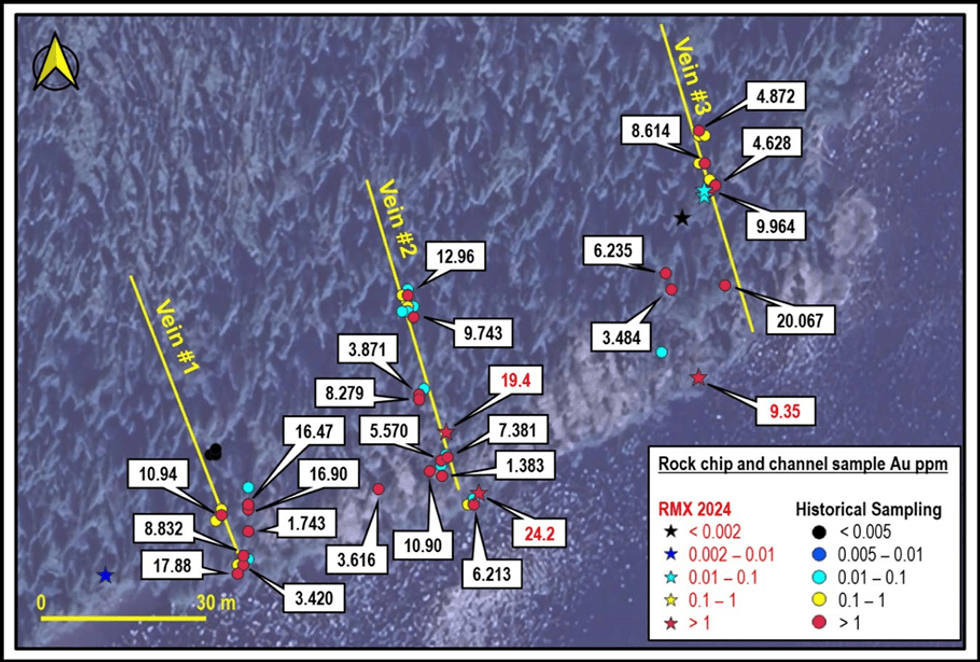 Figure 2: RMX rock chip and Troon Ventures historical rock chip and channel gold results for the Flicka Zone. Values of > 1ppm (1 g/t Au) are shown. The location of three mineralised quartz veins as mapped by Troon Ventures are also shown. Note that the mapped location of these veins and of some historical samples may have a GPS error of up to 10m – most significantly, the 9.35ppm (9.35 g/t Au) RMX sample is interpreted to be from Vein #3.
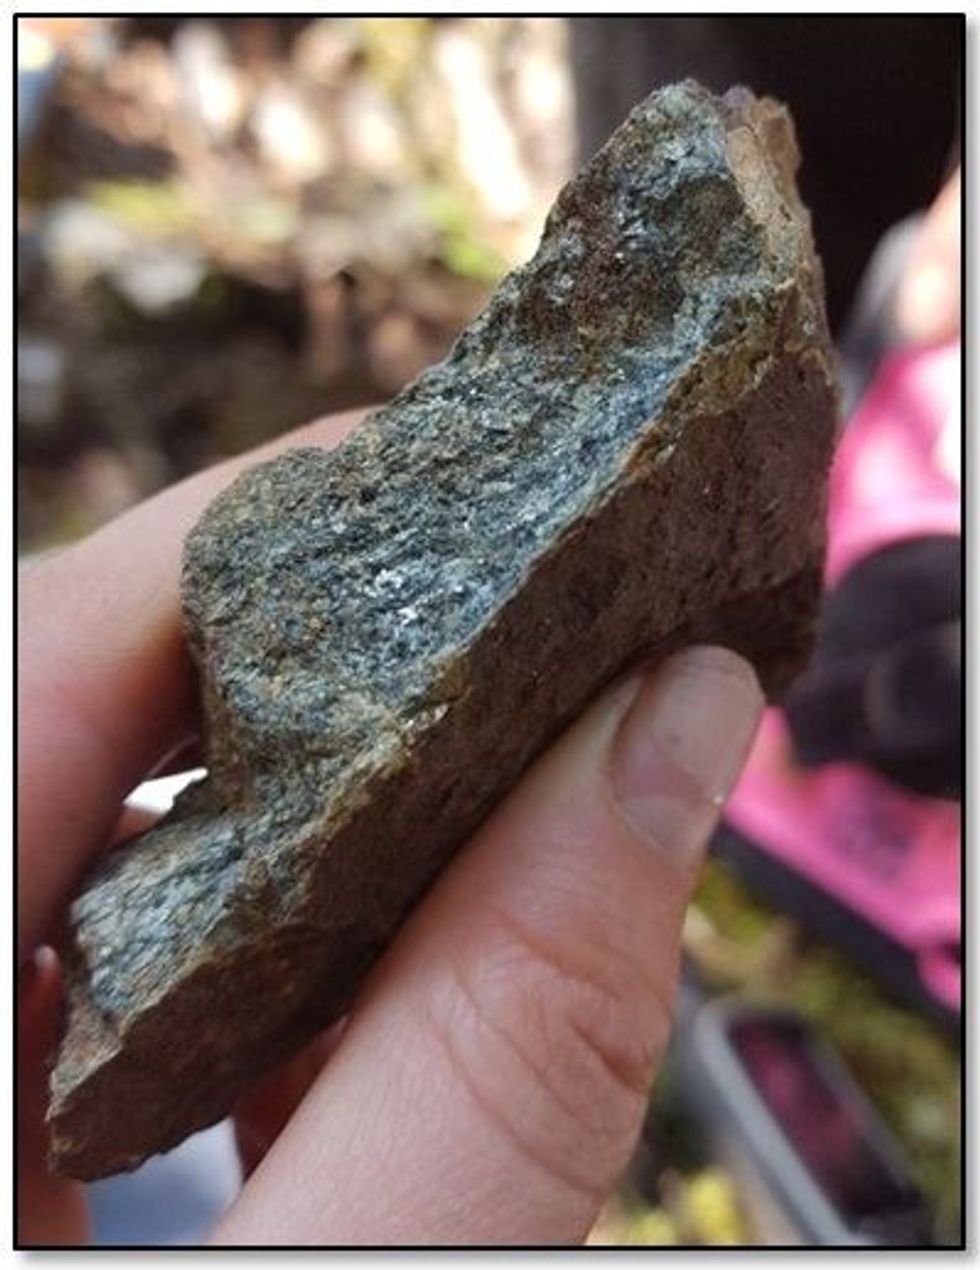 Figure 3: Photo of the mineralised sample 1292094 from Vein #2 at the Flicka Zone, which assayed at 19.4ppm (19.4 g/t Au)
Next steps
Following receipt of soil geochemistry and full base metal rock chip sample results, expected during November, RMX will evaluate the full dataset to prioritise targets within the Flicka Lake claims for further surface sampling, where justified and drill testing during the 2025 Canadian field season.
Click here for the full ASX Release
This article includes content from Red Mountain Mining, licensed for the purpose of publishing on Investing News Australia. This article does not constitute financial product advice. It is your responsibility to perform proper due diligence before acting upon any information provided here. Please refer to our full disclaimer here.