Thermo Fisher Scientific Inc. (NYSE: TMO), the world leader in serving science, today reported its financial results for the first quarter ended March 30, 2024.
First Quarter 2024 Highlights
Improving Air Purification Market Trends
Applied UV, Inc. (NasdaqCM: AUVI) ("Applied UV" or the "Company"), a pathogen elimination technology company that applies the power of narrow-range ultraviolet light ("UVC") for surface areas and catalytic bioconversion technology for air purification to destroy pathogens safely, thoroughly, and automatically, announced its financial results for the first quarter 2022.
The Company is also providing key operational metrics on results of operations for the three-month period ended March 31, 2022.
Recent Business Highlights
Strategic Positioning and Market Strategy
John F. Andrews, Applied UV's Chief Executive Officer commented, "The First Quarter 2022 was another quarter where we completed a strategic asset acquisition that strengthened our MunnWorks hospitality business that expands the Company's capabilities in the hospitality sector. Our resumption of global tradeshows and conferences coupled with our targeted marketing efforts in our air and surface pathogen elimination platform is beginning to bear fruit as we expect to announce a contract with a market leading cannabis company. Our ongoing efforts in identifying ways to further leverage the portfolio of assets that we believe will enable us to address the growing global demand for solutions that safely and effectively stop the spread of contagious airborne diseases and are easy to implement. Our key wins with our Washington State Dealer, DA Internationals, who was awarded a contract to provide a complete suite of solutions to non-public schools throughout the state of Washington further validates both our strategy as well as provides yet another referenceable installation, validating our air purification technology efficacy, effectiveness, and ease of use."
Financial Results
Segments
The Company has three reportable segments: the design, manufacture, assembly and distribution of disinfecting systems for use in healthcare, hospitality, and commercial municipal and residential markets (Disinfection segment); the manufacture of fine mirrors specifically for the Hospitality industry (hospitality segment); and the Corporate Segment, which includes expenses primarily related to corporate governance, such as board fees, legal expenses, audit fees, executive management, and listing costs.
Net Sales
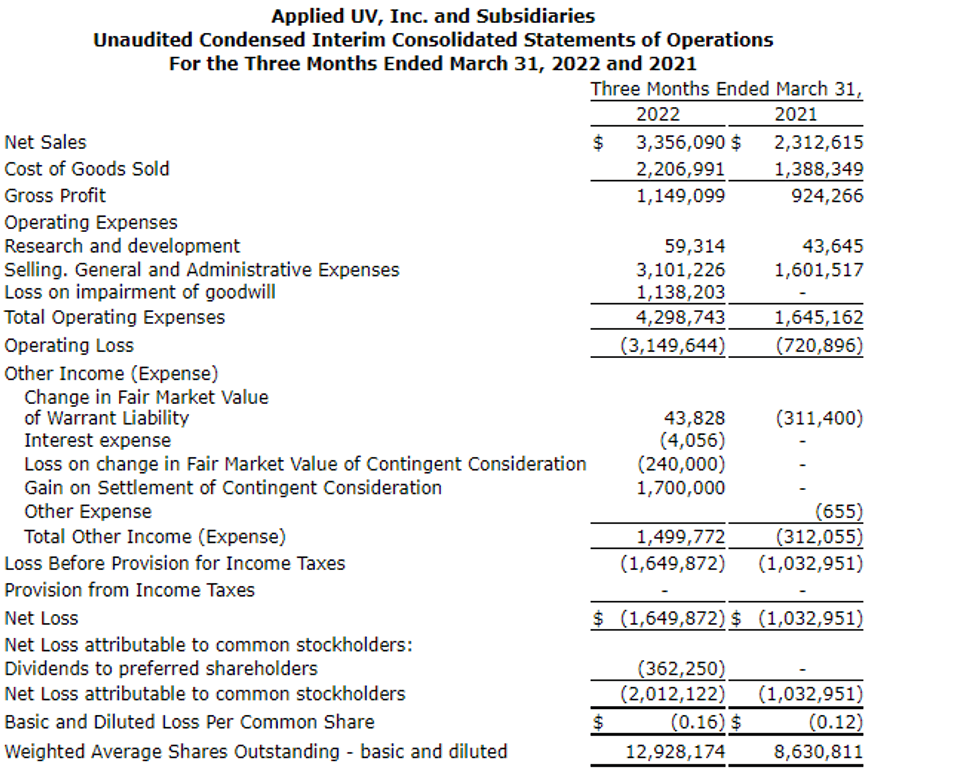
Net sales of $3,356,090 represented an increase of $1,043,475, or 45.1% for the three months ended March 31, 2022, as compared to net sales of $2,312,615 for the three months ended March 31, 2021. This increase was primarily attributable to the Disinfection segment, which increased $1,202,076, largely as a result of the strategic acquisitions of KES and Scientific Air in Q3 and Q4 of 2021, respectively. The Hospitality segment decreased ($158,601) primarily due to supply chain disruptions, with multiple order fulfilments delayed into Q2 of 2022.
Gross Profit
Gross profit increased $224,833, or 24.3%, for the three months ended March 31, 2022, as compared to the three months ended March 31, 2021, driven primarily by volume growth from the Disinfection segment. However, gross profit as a percentage of sales decreased approximately (5.8%) from 40.0% in Q1 of 2021 to 34.2% in Q1 of 2022, driven primarily by customer mix in the Disinfection segment and by lower sales, an increase in factory overhead absorption, and higher logistical costs in the Hospitality segment. As the Company continues to integrate their strategic acquisitions, the focus will be on realizing cost synergies from the consolidation and streamlining of the manufacturing and distribution operations.
Operating Expenses
Selling, General, and Administrative - S,G&A costs for the three months ended March 31, 2022, increased to $3,101,226 as compared to $1,601,517 for the three months ended March 31, 2021. This increase of approximately $1.4 million was driven primarily by the expansion of the Disinfection segment with the additional acquisitions of KES and SciAir. Payroll costs increased $0.3 million year over year as headcount increased from 31 at March 31, 2021 to 89 at March 31, 2022. Consulting, accounting, and legal costs increased $0.3 million, and amortization expense, mostly related to the intangible assets associated with the acquisitions, increased $0.3 million. Additional increases were due to advertising and marketing $0.2 million, and bad debt expense of $0.1 million. We anticipate efficiency gains in the coming year as we fully integrate our acquisitions and leverage synergies where practical.
Loss on Impairment of Goodwill - During the quarter ended March 31, 2022, the Company determined that a triggering event had occurred as a result of a settlement agreement with Scientific Air ("Old SAM Partners") - see explanation of Other Income/Expense below. A quantitative impairment test on the goodwill determined that the fair value was below the carrying value and as a result the Company recorded a full goodwill impairment charge of $1,138,203 on the Condensed Consolidated Statements of Operations during the three months ended March 31, 2022.
Other Income/Expense
The Company recorded income on the change in fair value of warrant liability in the amount of $43,828 for the three months ended March 31, 2022, as compared to a loss of ($311,400) on the change in fair value for the three months ended March 31, 2021.
On March 31, 2022, there was a settlement of a dispute between the Company and Scientific Air ("Old SAM Partners") regarding certain representations and warranties in the purchase agreement which resulted in a settlement and mutual release agreement where Old Sam Partners agreed to relinquish such Partner's right, title, and interest in the previously issued 400,000 shares that were part of the original asset acquisition transaction. During the three months ended March 31, 2022, the company recorded a loss on change in fair market value of contingent consideration of $240,000 and, as a result of the settlement agreement, the company recorded a gain on settlement of contingent consideration of $1,700,000.
Net Loss
The Company recorded a net loss of $1,649,872 for the three months ended March 31, 2022, compared to a net loss of $1,032,951 for the three months ended March 31, 2021. The increase of $616,921 in the net loss was mainly due to the increase is SG&A costs incurred in support of the expansion of the Disinfection segment.
The Company had approximately $7.1 million of unrestricted cash available on its consolidated balance sheet as of March 31, 2022.
Conference Call/Webcast Information
Applied UV's management team will host an investor conference call and live webcast on May 24, 2022, at 9:00 am ET. Investors can access the live webcast via a link on Applied UV's web site at https://www.webcaster4.com/Webcast/Page/2626/45615. For those planning to participate on the call, please dial +1-877-545-0320 (for domestic calls), or +1-973-528-0002 (for international calls), passcode 867374. A replay of the conference call will be available online on the Applied UV web site, and a dial-in replay will be available for one week following the call at +1-877-481-4010 (for domestic calls) or +1-919-882-2331 (for international calls), replay passcode 45615.
About Applied UV
Applied UV is focused on the development and acquisition of technology that address infection control in the healthcare, hospitality, commercial and municipal markets. The Company has two wholly owned subsidiaries - SteriLumen, Inc. ("SteriLumen") and Munn Works, LLC ("Munn Works"). SteriLumen's connected platform for Data Driven Disinfection(TM) applies the power of ultraviolet light (UVC) to destroy pathogens safely, thoroughly, and automatically, addressing the challenge of healthcare-acquired infections ("HAIs"). Targeted for use in facilities that have high customer turnover such as hospitals, hotels, commercial facilities, and other public spaces, the Company's Lumicide(TM) platform uses UVC LEDs in several patented designs for infection control in and around high-traffic areas, including sinks and restrooms, killing bacteria, viruses, and other pathogens residing on hard surfaces within devices' proximity. The Company's patented in-drain disinfection device, Lumicide Drain, is the only product on the market that addresses this critical pathogen intensive location. SteriLumen's Airocide(TM) air purification devices are research backed, clinically proven and developed for NASA with assistance from the University of Wisconsin. Airocide(TM) is listed as an FDA Class II Medical device, utilizes a proprietary photo-catalytic (PCO) bioconversion technology that draws air into a reaction chamber that converts damaging molds, microorganisms, dangerous airborne pathogens, destructive VOCs, allergens, odors and biological gasses into harmless water vapor and green carbon dioxide without producing ozone or other harmful byproducts. Airocide(TM) applications include healthcare, hospitality, grocery chains, wine making facilities, commercial real estate, schools, dental offices, post-harvest, grocery, cannabis facilities and homes.
For more information about Applied UV, Inc., and its subsidiaries, please visit the following websites: https://www.applieduvinc.com/;
Forward-Looking Statements
The information contained herein may contain "forward-looking statements." Forward-looking statements reflect the current view about future events. When used in this press release, the words "anticipate," "believe," "estimate," "expect," "future," "intend," "plan," or the negative of these terms and similar expressions, as they relate to us or our management, identify forward-looking statements. Such statements include, but are not limited to, statements contained in this press release relating to the view of management of Applied UV concerning its business strategy, future operating results and liquidity and capital resources outlook. Forward-looking statements are based on the Company's current expectations and assumptions regarding its business, the economy and other future conditions. Because forward-looking statements relate to the future, they are subject to inherent uncertainties, risks and changes in circumstances that are difficult to predict. The Company's actual results may differ materially from those contemplated by the forward-looking statements. They are neither statements of historical fact nor guarantees of assurance of future performance. We caution you therefore against relying on any of these forward-looking statements. Factors or events that could cause the Company's actual results to differ may emerge from time to time, and it is not possible for the Company to predict all of them. The Company cannot guarantee future results, levels of activity, performance, or achievements. Except as required by applicable law, including the securities laws of the United States, the Company does not intend to update any of the forward-looking statements to conform these statements to actual results.
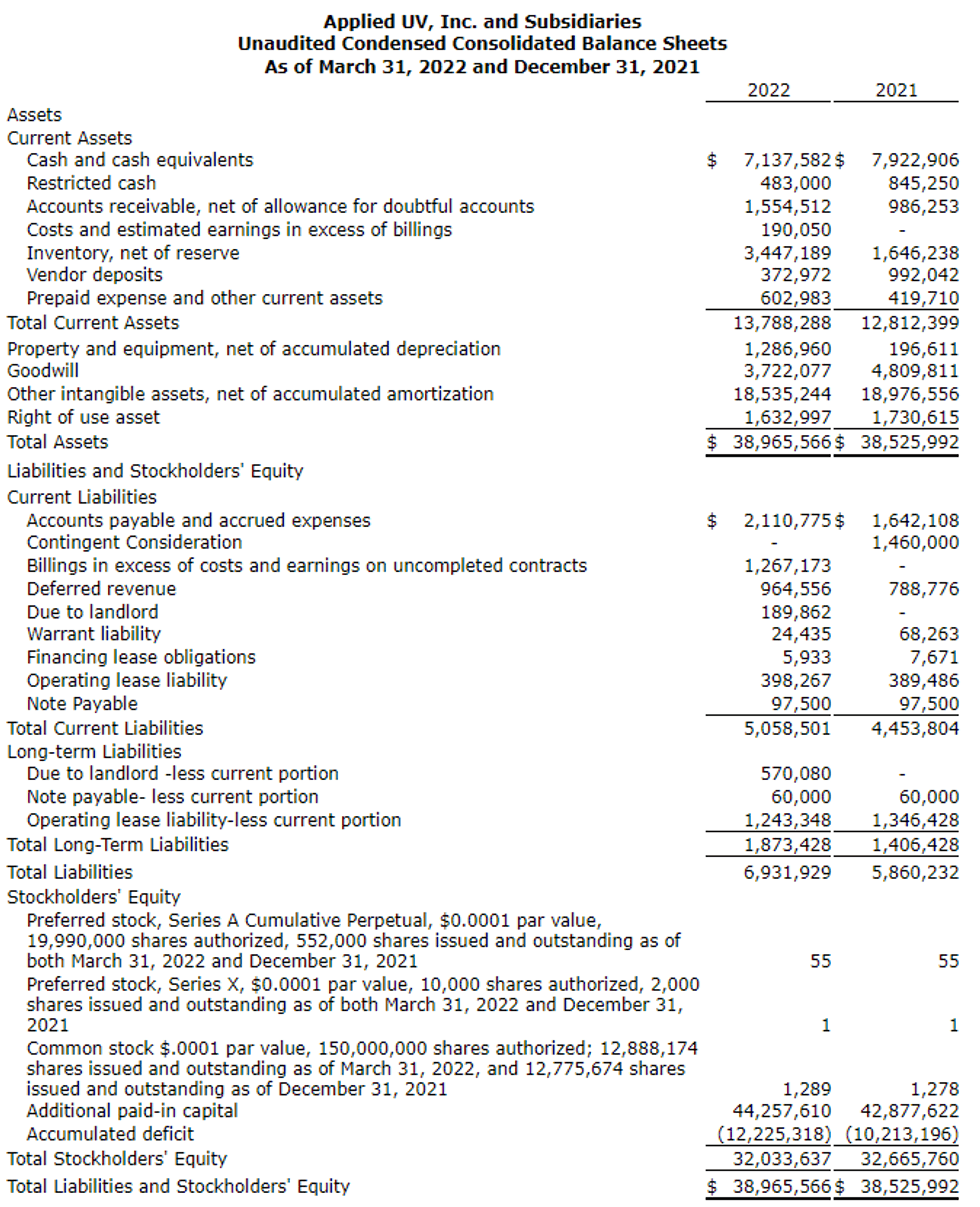
Click here to connect with Applied UV, Inc. (NasdaqCM: AUVI) to receive an Investor Presentation
Thermo Fisher Scientific Inc. (NYSE: TMO), the world leader in serving science, today reported its financial results for the first quarter ended March 30, 2024.
First Quarter 2024 Highlights
"We are very pleased to deliver another quarter of strong financial results," said Marc N. Casper, chairman, president and chief executive officer of Thermo Fisher Scientific. "We had a great start to the year, driven by our proven growth strategy and the impact of our PPI Business System."
Casper added, "Our team continues to enable the success of our customers while demonstrating incredibly strong commercial execution and operational discipline. This positions us to deliver differentiated performance in 2024, as we continue to create value for all of our stakeholders and build an even brighter future for our company."
First Quarter 2024
Revenue for the quarter declined 3% to $10.34 billion in 2024, versus $10.71 billion in 2023. Organic revenue was 4% lower and Core organic revenue growth declined 3%.
GAAP Earnings Results
GAAP diluted EPS in the first quarter of 2024 increased 4% to $3.46, versus $3.32 in the same quarter last year. GAAP operating income for the first quarter of 2024 grew to $1.66 billion, compared with $1.56 billion in the year-ago quarter. GAAP operating margin increased to 16.1%, compared with 14.6% in the first quarter of 2023.
Non-GAAP Earnings Results
Adjusted EPS in the first quarter of 2024 increased 2% to $5.11, versus $5.03 in the first quarter of 2023. Adjusted operating income for the first quarter of 2024 was $2.28 billion, compared with $2.33 billion in the year-ago quarter. Adjusted operating margin increased to 22.0%, compared with 21.8% in the first quarter of 2023.
Annual Guidance for 2024
Thermo Fisher is raising its full year revenue and adjusted EPS guidance to reflect stronger operational performance. The company is raising its revenue guidance to a new range of $42.3 to $43.3 billion versus its previous guidance of $42.1 to $43.3 billion. The company is raising its adjusted EPS guidance to a new range of $21.14 to $22.02 versus its previous guidance of $20.95 to $22.00.
Use of Non-GAAP Financial Measures
Adjusted EPS, adjusted net income, adjusted operating income, adjusted operating margin, free cash flow, organic revenue growth and Core organic revenue growth are non-GAAP measures that exclude certain items detailed after the tables that accompany this press release, under the heading "Supplemental Information Regarding Non-GAAP Financial Measures." The reconciliations of GAAP to non-GAAP financial measures are provided in the tables that accompany this press release.
Note on Presentation
Certain amounts and percentages reported within this press release are presented and calculated based on underlying unrounded amounts. As a result, the sum of components may not equal corresponding totals due to rounding.
Conference Call
Thermo Fisher Scientific will hold its earnings conference call today, April 24, at 8:30 a.m. Eastern Daylight Time. During the call, the company will discuss its financial performance, as well as future expectations. To listen, call (833) 470-1428 within the U.S. or (404) 975-4839 outside the U.S. The access code is 105588. You may also listen to the call live on the "Investors" section of our website, www.thermofisher.com . The earnings press release and related information can also be found in that section of our website under the heading "Financials". A replay of the call will be available under "News, Events & Presentations" through Wednesday, May 8, 2024.
About Thermo Fisher Scientific
Thermo Fisher Scientific Inc. is the world leader in serving science, with annual revenue over $40 billion. Our Mission is to enable our customers to make the world healthier, cleaner and safer. Whether our customers are accelerating life sciences research, solving complex analytical challenges, increasing productivity in their laboratories, improving patient health through diagnostics or the development and manufacture of life-changing therapies, we are here to support them. Our global team delivers an unrivaled combination of innovative technologies, purchasing convenience and pharmaceutical services through our industry-leading brands, including Thermo Scientific, Applied Biosystems, Invitrogen, Fisher Scientific, Unity Lab Services, Patheon and PPD. For more information, please visit www.thermofisher.com .
Safe Harbor Statement
The following constitutes a "Safe Harbor" statement under the Private Securities Litigation Reform Act of 1995: This press release contains forward-looking statements that involve a number of risks and uncertainties. Important factors that could cause actual results to differ materially from those indicated by forward-looking statements include risks and uncertainties relating to: the COVID-19 pandemic; the need to develop new products and adapt to significant technological change; implementation of strategies for improving growth; general economic conditions and related uncertainties; dependence on customers' capital spending policies and government funding policies; the effect of economic and political conditions and exchange rate fluctuations on international operations; use and protection of intellectual property; the effect of changes in governmental regulations; any natural disaster, public health crisis or other catastrophic event; and the effect of laws and regulations governing government contracts, as well as the possibility that expected benefits related to recent or pending acquisitions, including our pending acquisition of Olink, may not materialize as expected. Additional important factors that could cause actual results to differ materially from those indicated by such forward-looking statements are set forth in our most recent annual report on Form 10-K, which is on file with the SEC and available in the "Investors" section of our website under the heading "SEC Filings." While we may elect to update forward-looking statements at some point in the future, we specifically disclaim any obligation to do so, even if estimates change and, therefore, you should not rely on these forward-looking statements as representing our views as of any date subsequent to today.
Additional Information and Where to Find It
This communication is for informational purposes only and is neither an offer to purchase nor a solicitation of an offer to sell any common shares or American Depositary Shares of Olink or any other securities, nor is it a substitute for the tender offer materials that Thermo Fisher or Orion Acquisition AB (the "Buyer") has filed with the SEC. The terms and conditions of the tender offer are published in, and the offer to purchase common shares and American Depositary Shares of Olink is made only pursuant to, the offer document and related offer materials prepared by Thermo Fisher and the Buyer and is filed with the SEC in a tender offer statement on Schedule TO. In addition, Olink has filed a solicitation/recommendation statement on Schedule 14D-9 with the SEC with respect to the tender offer.
THE TENDER OFFER MATERIALS (INCLUDING AN OFFER TO PURCHASE, AN ADS LETTER OF TRANSMITTAL, ACCEPTANCE FORM FOR SHARES AND CERTAIN OTHER TENDER OFFER DOCUMENTS) AND THE SOLICITATION/RECOMMENDATION STATEMENT ON SCHEDULE 14D-9, AS THEY MAY BE AMENDED FROM TIME TO TIME, CONTAIN IMPORTANT INFORMATION. INVESTORS AND SHAREHOLDERS OF OLINK ARE URGED TO READ THESE DOCUMENTS CAREFULLY BECAUSE THEY, AND NOT THIS DOCUMENT, GOVERN THE TERMS AND CONDITIONS OF THE TENDER OFFER, AND BECAUSE THEY CONTAIN IMPORTANT INFORMATION THAT SUCH PERSONS SHOULD CONSIDER BEFORE MAKING ANY DECISION REGARDING TENDERING THEIR COMMON SHARES AND AMERICAN DEPOSITARY SHARES.
The tender offer materials, including the offer to purchase, the related ADS letter of transmittal and acceptance form for shares and certain other tender offer documents, and the solicitation/recommendation statement and other documents filed with the SEC by Thermo Fisher or Olink, may be obtained free of charge at the SEC's website at www.sec.gov , at Olink's website https://investors.olink.com/investor-relations , at Thermo Fisher's website at www.thermofisher.com or by contacting Thermo Fisher's investor relations department at 781-622-1111.
Condensed Consolidated Statements of Income (unaudited) | ||||||||||||||
Three months ended | ||||||||||||||
March 30, | % of | April 1, | % of | |||||||||||
(Dollars in millions except per share amounts) | 2024 | Revenues | 2023 | Revenues | ||||||||||
Revenues | $ | 10,345 | $ | 10,710 | ||||||||||
Costs and operating expenses: | ||||||||||||||
Cost of revenues (a) | 6,040 | 58.4 | % | 6,437 | 60.1 | % | ||||||||
Selling, general and administrative expenses (b) | 1,731 | 16.7 | % | 1,646 | 15.4 | % | ||||||||
Amortization of acquisition-related intangible assets | 551 | 5.3 | % | 606 | 5.7 | % | ||||||||
Research and development expenses | 331 | 3.2 | % | 346 | 3.2 | % | ||||||||
Restructuring and other costs (c) | 29 | 0.3 | % | 112 | 1.0 | % | ||||||||
Total costs and operating expenses | 8,682 | 83.9 | % | 9,147 | 85.4 | % | ||||||||
Operating income | 1,663 | 16.1 | % | 1,563 | 14.6 | % | ||||||||
Interest income | 279 | 146 | ||||||||||||
Interest expense | (363 | ) | (300 | ) | ||||||||||
Other income/(expense) (d) | 10 | (46 | ) | |||||||||||
Income before income taxes | 1,589 | 1,363 | ||||||||||||
Provision for income taxes (e) | (281 | ) | (46 | ) | ||||||||||
Equity in earnings/(losses) of unconsolidated entities | 23 | (25 | ) | |||||||||||
Net income | 1,331 | 1,292 | ||||||||||||
Less: net income/(losses) attributable to noncontrolling interests and redeemable noncontrolling interest | 4 | 3 | ||||||||||||
Net income attributable to Thermo Fisher Scientific Inc. | $ | 1,328 | 12.8 | % | $ | 1,289 | 12.0 | % | ||||||
Earnings per share attributable to Thermo Fisher Scientific Inc.: | ||||||||||||||
Basic | $ | 3.47 | $ | 3.34 | ||||||||||
Diluted | $ | 3.46 | $ | 3.32 | ||||||||||
Weighted average shares: | ||||||||||||||
Basic | 382 | 386 | ||||||||||||
Diluted | 384 | 388 | ||||||||||||
Reconciliation of adjusted operating income and adjusted operating margin | ||||||||||||||
GAAP operating income | $ | 1,663 | 16.1 | % | $ | 1,563 | 14.6 | % | ||||||
Cost of revenues adjustments (a) | 15 | 0.1 | % | 41 | 0.4 | % | ||||||||
Selling, general and administrative expenses adjustments (b) | 19 | 0.2 | % | 8 | 0.1 | % | ||||||||
Restructuring and other costs (c) | 29 | 0.3 | % | 112 | 1.0 | % | ||||||||
Amortization of acquisition-related intangible assets | 551 | 5.3 | % | 606 | 5.7 | % | ||||||||
Adjusted operating income (non-GAAP measure) | $ | 2,278 | 22.0 | % | $ | 2,330 | 21.8 | % | ||||||
Reconciliation of adjusted net income | ||||||||||||||
GAAP net income attributable to Thermo Fisher Scientific Inc. | $ | 1,328 | $ | 1,289 | ||||||||||
Cost of revenues adjustments (a) | 15 | 41 | ||||||||||||
Selling, general and administrative expenses adjustments (b) | 19 | 8 | ||||||||||||
Restructuring and other costs (c) | 29 | 112 | ||||||||||||
Amortization of acquisition-related intangible assets | 551 | 606 | ||||||||||||
Other income/expense adjustments (d) | (11 | ) | 46 | |||||||||||
Provision for income taxes adjustments (e) | 50 | (171 | ) | |||||||||||
Equity in earnings/losses of unconsolidated entities | (23 | ) | 25 | |||||||||||
Adjusted net income (non-GAAP measure) | $ | 1,959 | $ | 1,956 | ||||||||||
Reconciliation of adjusted earnings per share | ||||||||||||||
GAAP diluted EPS attributable to Thermo Fisher Scientific Inc. | $ | 3.46 | $ | 3.32 | ||||||||||
Cost of revenues adjustments (a) | 0.04 | 0.10 | ||||||||||||
Selling, general and administrative expenses adjustments (b) | 0.05 | 0.02 | ||||||||||||
Restructuring and other costs (c) | 0.08 | 0.29 | ||||||||||||
Amortization of acquisition-related intangible assets | 1.44 | 1.56 | ||||||||||||
Other income/expense adjustments (d) | (0.03 | ) | 0.12 | |||||||||||
Provision for income taxes adjustments (e) | 0.13 | (0.44 | ) | |||||||||||
Equity in earnings/losses of unconsolidated entities | (0.06 | ) | 0.06 | |||||||||||
Adjusted EPS (non-GAAP measure) | $ | 5.11 | $ | 5.03 | ||||||||||
Reconciliation of free cash flow | ||||||||||||||
GAAP net cash provided by operating activities | $ | 1,251 | $ | 729 | ||||||||||
Purchases of property, plant and equipment | (347 | ) | (458 | ) | ||||||||||
Proceeds from sale of property, plant and equipment | 4 | 6 | ||||||||||||
Free cash flow (non-GAAP measure) | $ | 908 | $ | 277 |
Business Segment Information | Three months ended | |||||||||||||
March 30, | % of | April 1, | % of | |||||||||||
(Dollars in millions) | 2024 | Revenues | 2023 | Revenues | ||||||||||
Revenues | ||||||||||||||
Life Sciences Solutions | $ | 2,285 | 22.1 | % | $ | 2,612 | 24.4 | % | ||||||
Analytical Instruments | 1,687 | 16.3 | % | 1,723 | 16.1 | % | ||||||||
Specialty Diagnostics | 1,109 | 10.7 | % | 1,108 | 10.3 | % | ||||||||
Laboratory Products and Biopharma Services | 5,723 | 55.3 | % | 5,763 | 53.8 | % | ||||||||
Eliminations | (460 | ) | -4.4 | % | (496 | ) | -4.6 | % | ||||||
Consolidated revenues | $ | 10,345 | 100.0 | % | $ | 10,710 | 100.0 | % | ||||||
Segment income and segment income margin | ||||||||||||||
Life Sciences Solutions | $ | 840 | 36.8 | % | $ | 836 | 32.0 | % | ||||||
Analytical Instruments | 400 | 23.7 | % | 421 | 24.4 | % | ||||||||
Specialty Diagnostics | 294 | 26.5 | % | 280 | 25.3 | % | ||||||||
Laboratory Products and Biopharma Services | 744 | 13.0 | % | 793 | 13.8 | % | ||||||||
Subtotal reportable segments | 2,278 | 22.0 | % | 2,330 | 21.8 | % | ||||||||
Cost of revenues adjustments (a) | (15 | ) | -0.1 | % | (41 | ) | -0.4 | % | ||||||
Selling, general and administrative expenses adjustments (b) | (19 | ) | -0.2 | % | (8 | ) | -0.1 | % | ||||||
Restructuring and other costs (c) | (29 | ) | -0.3 | % | (112 | ) | -1.0 | % | ||||||
Amortization of acquisition-related intangible assets | (551 | ) | -5.3 | % | (606 | ) | -5.7 | % | ||||||
Consolidated GAAP operating income | $ | 1,663 | 16.1 | % | $ | 1,563 | 14.6 | % | ||||||
(a) Adjusted results in 2024 and 2023 exclude charges for inventory write-downs associated with large-scale abandonment of product lines. Adjusted results in 2023 exclude $10 of charges for the sale of inventory revalued at the date of acquisition. | ||||||||||||||
(b) Adjusted results in 2024 and 2023 exclude certain third-party expenses, principally transaction/integration costs related to recent acquisitions, and charges/credits for changes in estimates of contingent acquisition consideration. | ||||||||||||||
(c) Adjusted results in 2024 and 2023 exclude restructuring and other costs consisting principally of severance, impairments of long-lived assets, abandoned facility, and other expenses of headcount reductions and real estate consolidations. Adjusted results in 2023 also exclude $18 of net charges for pre-acquisition litigation and other matters. | ||||||||||||||
(d) Adjusted results in 2024 and 2023 exclude net gains/losses on investments. | ||||||||||||||
(e) Adjusted results in 2024 and 2023 exclude incremental tax impacts for the reconciling items between GAAP and adjusted net income, incremental tax impacts as a result of tax rate/law changes, and the tax impacts from audit settlements. | ||||||||||||||
Note: | ||||||||||||||
Consolidated depreciation expense is $285 and $253 in 2024 and 2023, respectively. |
Organic and Core organic revenue growth | Three months ended | ||
March 30, 2024 | |||
Revenue growth | -3% | ||
Acquisitions | 0% | ||
Currency translation | 0% | ||
Organic revenue growth (non-GAAP measure) | -4% | ||
COVID-19 testing revenue | -1% | ||
Core organic revenue growth (non-GAAP measure) | -3% | ||
Note: | |||
For more information related to non-GAAP financial measures, refer to the section titled "Supplemental Information Regarding Non-GAAP Financial Measures" of this release. |
Condensed Consolidated Balance Sheets (unaudited) | ||||||
March 30, | December 31, | |||||
(In millions) | 2024 | 2023 | ||||
Assets | ||||||
Current assets: | ||||||
Cash and cash equivalents | $ | 5,499 | $ | 8,077 | ||
Short-term investments | 1,751 | 3 | ||||
Accounts receivable, net | 7,931 | 8,221 | ||||
Inventories | 5,133 | 5,088 | ||||
Other current assets | 3,326 | 3,200 | ||||
Total current assets | 23,640 | 24,589 | ||||
Property, plant and equipment, net | 9,324 | 9,448 | ||||
Acquisition-related intangible assets, net | 16,048 | 16,670 | ||||
Other assets | 4,241 | 3,999 | ||||
Goodwill | 43,843 | 44,020 | ||||
Total assets | $ | 97,095 | $ | 98,726 | ||
Liabilities, redeemable noncontrolling interest and equity | ||||||
Current liabilities: | ||||||
Short-term obligations and current maturities of long-term obligations | $ | 4,451 | $ | 3,609 | ||
Other current liabilities | 9,486 | 10,403 | ||||
Total current liabilities | 13,937 | 14,012 | ||||
Other long-term liabilities | 6,378 | 6,564 | ||||
Long-term obligations | 31,157 | 31,308 | ||||
Redeemable noncontrolling interest | 119 | 118 | ||||
Total equity | 45,504 | 46,724 | ||||
Total liabilities, redeemable noncontrolling interest and equity | $ | 97,095 | $ | 98,726 |
Condensed Consolidated Statements of Cash Flows (unaudited) | ||||||||
Three months ended | ||||||||
March 30, | April 1, | |||||||
(In millions) | 2024 | 2023 | ||||||
Operating activities | ||||||||
Net income | $ | 1,331 | $ | 1,292 | ||||
Adjustments to reconcile net income to net cash provided by operating activities: | ||||||||
Depreciation and amortization | 837 | 859 | ||||||
Change in deferred income taxes | (253 | ) | (146 | ) | ||||
Other non-cash expenses, net | 123 | 257 | ||||||
Changes in assets and liabilities, excluding the effects of acquisitions | (787 | ) | (1,533 | ) | ||||
Net cash provided by operating activities | 1,251 | 729 | ||||||
Investing activities | ||||||||
Purchases of property, plant and equipment | (347 | ) | (458 | ) | ||||
Proceeds from sale of property, plant and equipment | 4 | 6 | ||||||
Proceeds from cross-currency interest rate swap interest settlements | 64 | 2 | ||||||
Acquisitions, net of cash acquired | — | (2,704 | ) | |||||
Purchases of investments | (1,758 | ) | (2 | ) | ||||
Other investing activities, net | 7 | 14 | ||||||
Net cash used in investing activities | (2,030 | ) | (3,142 | ) | ||||
Financing activities | ||||||||
Net proceeds from issuance of debt | 1,205 | — | ||||||
Net proceeds from issuance of commercial paper | — | 1,027 | ||||||
Repayment of commercial paper | — | (523 | ) | |||||
Purchases of company common stock | (3,000 | ) | (3,000 | ) | ||||
Dividends paid | (135 | ) | (117 | ) | ||||
Other financing activities, net | 110 | 20 | ||||||
Net cash used in financing activities | (1,821 | ) | (2,593 | ) | ||||
Exchange rate effect on cash | 22 | (31 | ) | |||||
Decrease in cash, cash equivalents and restricted cash | (2,578 | ) | (5,037 | ) | ||||
Cash, cash equivalents and restricted cash at beginning of period | 8,097 | 8,537 | ||||||
Cash, cash equivalents and restricted cash at end of period | $ | 5,519 | $ | 3,500 | ||||
Free cash flow (non-GAAP measure) | $ | 908 | $ | 277 | ||||
Note: | ||||||||
For more information related to non-GAAP financial measures, refer to the section titled "Supplemental Information Regarding Non-GAAP Financial Measures" of this release. | ||||||||
Supplemental Information Regarding Non-GAAP Financial Measures
In addition to the financial measures prepared in accordance with generally accepted accounting principles (GAAP), we use certain non-GAAP financial measures such as organic revenue growth, which is reported revenue growth, excluding the impacts of acquisitions/divestitures and the effects of currency translation. We also report Core organic revenue growth, which is reported revenue growth, excluding the impacts of COVID-19 testing revenue, and excluding the impacts of acquisitions/divestitures and the effects of currency translation. We report these measures because Thermo Fisher management believes that in order to understand the company's short-term and long-term financial trends, investors may wish to consider the impact of acquisitions/divestitures, foreign currency translation and/or COVID-19 testing on revenues. Thermo Fisher management uses these measures to forecast and evaluate the operational performance of the company as well as to compare revenues of current periods to prior periods.
We report adjusted operating income, adjusted operating margin, adjusted net income, and adjusted EPS. We believe that the use of these non-GAAP financial measures, in addition to GAAP financial measures, helps investors to gain a better understanding of our core operating results and future prospects, consistent with how management measures and forecasts the company's core operating performance, especially when comparing such results to previous periods, forecasts, and to the performance of our competitors. Such measures are also used by management in their financial and operating decision-making and for compensation purposes. To calculate these measures we exclude, as applicable:
We report free cash flow, which is operating cash flow excluding net capital expenditures, to provide a view of the continuing operations' ability to generate cash for use in acquisitions and other investing and financing activities. The company also uses this measure as an indication of the strength of the company. Free cash flow is not a measure of cash available for discretionary expenditures since we have certain non-discretionary obligations such as debt service that are not deducted from the measure.
Thermo Fisher Scientific does not provide GAAP financial measures on a forward-looking basis because we are unable to predict with reasonable certainty and without unreasonable effort items such as the timing and amount of future restructuring actions and acquisition-related charges as well as gains or losses from sales of real estate and businesses, the early retirement of debt and the outcome of legal proceedings. The timing and amount of these items are uncertain and could be material to Thermo Fisher Scientific's results computed in accordance with GAAP.
The non-GAAP financial measures of Thermo Fisher Scientific's results of operations and cash flows included in this press release are not meant to be considered superior to or a substitute for Thermo Fisher Scientific's results of operations prepared in accordance with GAAP. Reconciliations of such non-GAAP financial measures to the most directly comparable GAAP financial measures are set forth in the tables above.
View source version on businesswire.com: https://www.businesswire.com/news/home/20240423741228/en/
Media Contact Information:
Sandy Pound
Thermo Fisher Scientific
Phone: 781-622-1223
E-mail: sandy.pound@thermofisher.com
Investor Contact Information:
Rafael Tejada
Thermo Fisher Scientific
Phone: 781-622-1356
E-mail: rafael.tejada@thermofisher.com
News Provided by Business Wire via QuoteMedia
Cardiex Limited (ASX:CDX) (Cardiex, the Company) has released its Quarterly Cash Flow Report.
Click here for the full ASX Release
This article includes content from CardieX Limited, licensed for the purpose of publishing on Investing News Australia. This article does not constitute financial product advice. It is your responsibility to perform proper due diligence before acting upon any information provided here. Please refer to our full disclaimer here.
Highlights:
On behalf of management and the Board, I am pleased to provide shareholders with an update on recent activities.
As we move towards the end of fiscal year 2024 we also move closer towards a number of significant and material milestones for the Company. Headlining this update is record Company revenue and other income of over $11m underpinned by continuing strong performance in our Clinical Trial Services Group - a revenue trend we expect to continue into FY 2025.
Click here for the full ASX Release
This article includes content from CardieX Limited, licensed for the purpose of publishing on Investing News Australia. This article does not constitute financial product advice. It is your responsibility to perform proper due diligence before acting upon any information provided here. Please refer to our full disclaimer here.
Cardiex Limited (ASX:CDX) leverages its proprietary SphygmoCor® technology to develop and market vascular biomarker technologies and digital solutions focused on the world’s largest health disorders. SphygmoCor®, the company's groundbreaking technology, has set the benchmark for noninvasive measurement of central aortic pressures and related arterial health characteristics, collectively referred to as vascular biomarkers.
The unique physiologic insights from the company’s devices provide clinically relevant information that helps guide treatment decisions and offer profound benefits for all members of the healthcare community:
For Healthcare Providers: Enable physicians to make more informed treatment decisions based on clinically relevant vascular health data.
For Patients: Give patients the tools to make better decisions about their own health.
For Pharmaceutical Companies: Generate reliable, real-world, clinically relevant data to accelerate drug development and commercialization.
Cardiex’s goal is to establish a holistic ecosystem that promotes cardiovascular well-being and empowers users to proactively manage their health as an integral part of individuals' health routines, contributing to a paradigm shift in preventive cardiovascular care.
The company’s first-mover advantage and exclusive technology FDA-cleared for noninvasive measurement of central pulse pressures and vascular biomarkers across all adult demographics grant it a distinctive market position. CDX recently secured AU$14 million in funding, which is enough to steer the company towards profitability.
This Cardiex profile is part of a paid investor education campaign.*
Click here to connect with Cardiex Limited (ASX:CDX) to receive an Investor Presentation
According to a new survey from Medtronic and Morning Consult, nearly two-thirds of U.S. adults say they'd opt for a shorter, healthier life than a longer one with health issues
Americans overwhelmingly say that when they think about longevity, it's more than just living longer - it's about living their healthiest, best lives. While most want to live to 90-well past the average U.S. life expectancy of 77.5 years-nearly two-thirds (66%) would choose a shorter, healthier life over a longer one with health issues. These findings, from a survey conducted by global healthcare technology leader Medtronic with Morning Consult, highlight a gap between U.S. adults' desire to live healthier years and the opportunity for more people to improve their quality of life through healthcare technology
With almost limitless health-related information at our fingertips and new healthcare innovations emerging daily, the American dream of extending both our lifespan and quality of life seems possible. However, only 39% of U.S. adults say they are taking preventative health measures such as screenings and regular medical check-ups, and less than a third (29%) are discussing longevity with their doctor. Only about half are focused on eating healthy (53%) and exercising (51%), despite diet and physical inactivity being leading contributors to chronic disease. And while 80% of Americans believe healthcare technology can help them live longer and healthier, only 18% are taking advantage of it.
"Health conditions can impact anyone at any age, so it's critical that we expand treatment options while also continuing to focus on prevention, so people can prioritize what's most important to them," said Dr. Laura Mauri, chief scientific, medical and regulatory officer at Medtronic. "The role of technology in helping people live longer and better lives is accelerating. It's enabling more personalized treatments, quicker recoveries and earlier diagnosis. What's more, every day researchers are discovering new technologies that continue to improve longevity and quality of life."
Perhaps the greatest power of technology is the range of options - and hope - it can give people regardless of their current health status. Already, healthcare technology is helping catch cancer before it progresses, treat pain with less oral medication and reduce the burden from chronic diseases.
"In my 19 years as a diabetic, I feel more supported by my diabetes technology than I ever have before," said Cameron Moore, who uses a Medtronic insulin pump with meal detection technology. "It means I worry less about complications so I can focus on the here and now of life with my family and enjoy each day to the fullest."
There are steps people can take today to take charge of their health and live their best life. Follow the acronym T.E.C.H.:
For more information on how Medtronic is advancing healthcare through technology and helping people live longer and healthier, visit Medtronic.com.
About the Consumer Perceptions of Longevity Survey
The survey was conducted by decision intelligence company Morning Consult among a nationally representative sample of 2,200 adults in the U.S. from February 15-20, 2024, with an unweighted margin of error of +/- 2 percentage points.
About Medtronic
Bold thinking. Bolder actions. We are Medtronic. Medtronic plc, headquartered in Dublin, Ireland, is the leading global healthcare technology company that boldly attacks the most challenging health problems facing humanity by searching out and finding solutions. Our Mission - to alleviate pain, restore health, and extend life - unites a global team of 95,000+ passionate people across more than 150 countries. Our technologies and therapies treat 70 health conditions and include cardiac devices, surgical robotics, insulin pumps, surgical tools, patient monitoring systems, and more. Powered by our diverse knowledge, insatiable curiosity, and desire to help all those who need it, we deliver innovative technologies that transform the lives of two people every second, every hour, every day. Expect more from us as we empower insight-driven care, experiences that put people first, and better outcomes for our world. In everything we do, we are engineering the extraordinary. For more information on Medtronic (NYSE:MDT), visit www.Medtronic.com and follow Medtronic on LinkedIn.
Any forward-looking statements are subject to risks and uncertainties such as those described in Medtronic's periodic reports on file with the Securities and Exchange Commission. Actual results may differ materially from anticipated results.
Contacts:
Erika Winkels
Public Relations
+1-763-526-8472
Ryan Weispfenning
Investor Relations
+1-763-505-4626
View additional multimedia and more ESG storytelling from Medtronic on 3blmedia.com.
Contact Info:
Spokesperson: Medtronic
Website: https://www.3blmedia.com/profiles/medtronic
Email: info@3blmedia.com
SOURCE: Medtronic
News Provided by ACCESSWIRE via QuoteMedia
According to a new survey from Medtronic and Morning Consult, nearly two-thirds of U.S. adults say they'd opt for a shorter, healthier life than a longer one with health issues
Americans overwhelmingly say that when they think about longevity, it's more than just living longer—it's about living their healthiest, best lives. While most want to live to 90—well past the average U.S. life expectancy of 77.5 years—nearly two-thirds (66%) would choose a shorter, healthier life over a longer one with health issues. These findings, from a survey conducted by global healthcare technology leader Medtronic with Morning Consult, highlight a gap between U.S. adults' desire to live healthier years and the opportunity for more people to improve their quality of life through healthcare technology.
With almost limitless health-related information at our fingertips and new healthcare innovations emerging daily, the American dream of extending both our lifespan and quality of life seems possible. However, only 39% of U.S. adults say they are taking preventative health measures such as screenings and regular medical check-ups, and less than a third (29%) are discussing longevity with their doctor. Only about half are focused on eating healthy (53%) and exercising (51%), despite diet and physical inactivity being leading contributors to chronic disease. And while 80% of Americans believe healthcare technology can help them live longer and healthier, only 18% are taking advantage of it.
"Health conditions can impact anyone at any age, so it's critical that we expand treatment options while also continuing to focus on prevention, so people can prioritize what's most important to them," said Dr. Laura Mauri , chief scientific, medical and regulatory officer at Medtronic. "The role of technology in helping people live longer and better lives is accelerating. It's enabling more personalized treatments, quicker recoveries and earlier diagnosis. What's more, every day researchers are discovering new technologies that continue to improve longevity and quality of life."
Perhaps the greatest power of technology is the range of options—and hope—it can give people regardless of their current health status. Already, healthcare technology is helping catch cancer before it progresses, treat pain with less oral medication and reduce the burden from chronic diseases.
"In my 19 years as a diabetic, I feel more supported by my diabetes technology than I ever have before," said Cameron Moore , who uses a Medtronic insulin pump with meal detection technology. "It means I worry less about complications so I can focus on the here and now of life with my family and enjoy each day to the fullest."
There are steps people can take today to take charge of their health and live their best life. Follow the acronym T.E.C.H.:
For more information on how Medtronic is advancing healthcare through technology and helping people live longer and healthier, visit Medtronic.com.
About the Consumer Perceptions of Longevity Survey
The survey was conducted by decision intelligence company Morning Consult among a nationally representative sample of 2,200 adults in the U.S. from February 15-20, 2024 , with an unweighted margin of error of +/- 2 percentage points.
About Medtronic
Bold thinking. Bolder actions. We are Medtronic. Medtronic plc, headquartered in Dublin, Ireland , is the leading global healthcare technology company that boldly attacks the most challenging health problems facing humanity by searching out and finding solutions. Our Mission — to alleviate pain, restore health, and extend life — unites a global team of 95,000+ passionate people across more than 150 countries. Our technologies and therapies treat 70 health conditions and include cardiac devices, surgical robotics, insulin pumps, surgical tools, patient monitoring systems, and more. Powered by our diverse knowledge, insatiable curiosity, and desire to help all those who need it, we deliver innovative technologies that transform the lives of two people every second, every hour, every day. Expect more from us as we empower insight-driven care, experiences that put people first, and better outcomes for our world. In everything we do, we are engineering the extraordinary. For more information on Medtronic (NYSE:MDT), visit www.Medtronic.com and follow Medtronic on LinkedIn .
Any forward-looking statements are subject to risks and uncertainties such as those described in Medtronic's periodic reports on file with the Securities and Exchange Commission. Actual results may differ materially from anticipated results.
Contacts: | ||
Erika Winkels | Ryan Weispfenning | |
Public Relations | Investor Relations | |
+1-763-526-8472 | +1-763-505-4626 |
View original content to download multimedia: https://www.prnewswire.com/news-releases/americans-favor-quality-over-quantity-in-pursuit-of-longevity-302118841.html
SOURCE Medtronic plc
View original content to download multimedia: http://www.newswire.ca/en/releases/archive/April2024/17/c6028.html
News Provided by Canada Newswire via QuoteMedia
Investing News Network websites or approved third-party tools use cookies. Please refer to the cookie policy for collected data, privacy and GDPR compliance. By continuing to browse the site, you agree to our use of cookies.Â