Tisdale Clean Energy Corp. has announced a name change to Terra Clean Energy Corp.
Shares will begin trading under the new name and with a new CUSIP number on October 3, 2024.
Tisdale Clean Energy (CSE:TCEC) focuses on uranium exploration and development by exploring the South Falcon East uranium project that spans over 12,000 hectares in the Athabasca Basin in Saskatchewan, Canada, and is home to the Fraser Lakes B uranium and thorium deposits.
In October 2022, Tisdale entered into an agreement with Skyharbour Resources (TSXV:SYH,OTCQX:SYHBF, FWB:SC1P) to acquire up to 75 percent interest in the South Falcon East project.
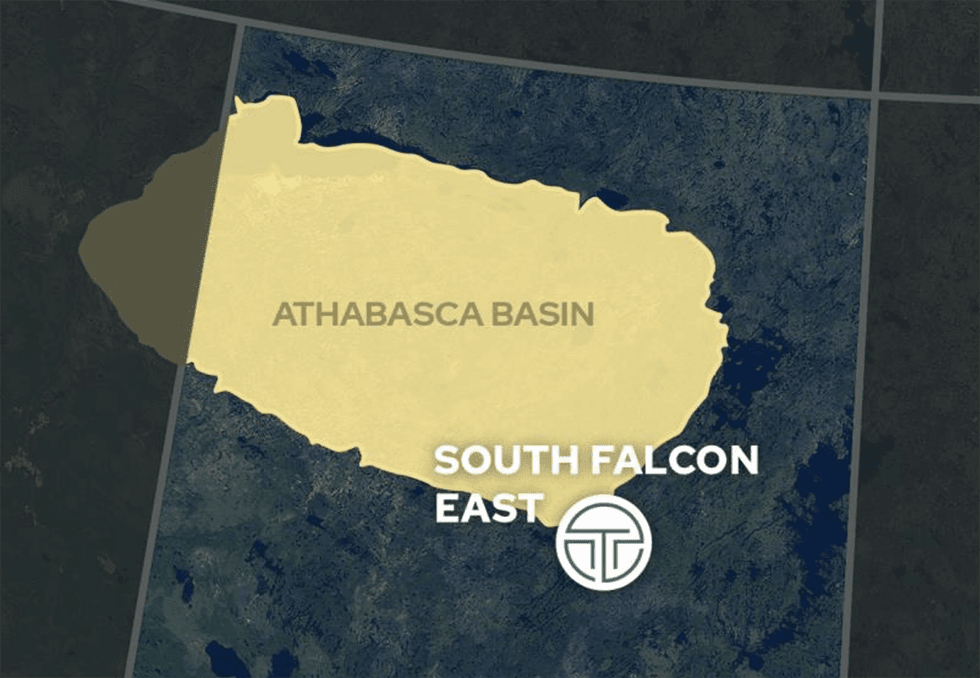
he South Falcon East is the company’s flagship uranium project where outcrop grab samples from 2008 to 2011 returned between 0.04 percent and 0.45 percent triuranium octoxide, and drill core samples returned mineralized sections with values from 0.01 percent to 0.55 percent triuranium octoxide. The Fraser Lakes Zone B deposit comprises multiple-stacked uranium, thorium and REE mineralization with an NI 43-101 mineral resource estimate of 6.9 Mlb triuranium octoxide at 0.03, and 5.3 Mlb thorium oxide at 0.023 percent within 10.3 million tons (Mt) of material using a cut-off grade of 0.01 percent triuranium octoxide.
This Tisdale Clean Energy profile is part of a paid investor education campaign.*
Click here to connect with Tisdale Clean Energy (CSE:TCEC) to receive an Investor Presentation
Tisdale Clean Energy’s land position in the prolific Athabasca Basin with proven resources places the company in an ideal position to leverage a rapidly expanding uranium market.
Tisdale Clean Energy (CSE:TCEC,OTC:TCEFF,FSE:T1KC) is a Canadian company focused on uranium exploration and development. The company is currently focused on the South Falcon East uranium project that spans over 12,000 hectares in the Athabasca Basin in Saskatchewan, Canada, and is home to the Fraser Lakes B uranium and thorium deposits.
The Athabasca Basin hosts several high-grade uranium deposits that provide over 20 percent of the world’s supply. Most of these deposits reside within the basin and are often found under deep sandstone cover.
In October 2022, Tisdale entered into an agreement with Skyharbour Resources (TSXV:SYH,OTCQX:SYHBF,FWB:SC1P) to acquire up to 75 percent interest in the South Falcon East project.
The project enjoys access to excellent infrastructure and has geological characteristics similar to several other high-grade deposits in the basin, such as the Eagle Point, Millennium, P-Patch and Roughrider. Historical exploration at the South Falcon East project, comprising 25 holes totaling 4,603 meters, discovered multiple-stacked uranium, thorium and REE mineralization at the Fraser Lakes Zone B deposit with an NI 43-101 mineral resource estimate of 6.9 million pounds (Mlbs) triuranium octoxide at 0.03 percent, and 5.3 Mlb thorium oxide at 0.023 percent.
The Fraser Lakes target area has exceptional exploitation potential, including the historical resource expansion potential of the current deposit at Zone B.
From 2008 to 2011, outcrop grab samples from South Falcon East returned between 0.04 percent and 0.45 percent triuranium octoxide, and drill core samples returned mineralized sections with values from 0.01 percent to 0.55 percent triuranium octoxide.
In 2015, Skyharbour Resources drilled five holes (1,278 meters) testing various targets. Multiple intervals of uranium mineralization were intersected in several drill holes during the winter program. This mineralization is accompanied by local thorium enrichment and anomalous levels of pathfinder elements such as copper, nickel, vanadium and lead. Hole FP-15-03 returned a 3-meter interval of .08 percent triuranium octoxide, including 2 meters of .10 percent triuranium octoxide (at 295-meter depth). The best intersections occur in drill hole FP-15-05, which was drilled within the main mineralized Fraser Lakes conductive corridor. Hole FP-15-05 returned multiple mineralized intervals over a 14-meter down hole length, including 6 meters of .10 percent triuranium octoxide (including a 2-meter interval of 0.17 percent triuranium octoxide (at 135-meter depth), and a 2.5-meter interval of 0.172 percent triuranium octoxide (at 145-meter depth).
The company benefits from the expertise of senior geologist Trevor Perkins, who brings more than two decades of experience discovering large uranium deposits in the Athabasca Basin and other areas. He discovered the McArthur River North Extension zones (110 Mlbs triuranium octoxide) and the Angulari uranium deposit (20 Mlbs triuranium octoxide).
Tisdale's presence in a favorable mining jurisdiction and its drill-ready South Falcon East uranium project position it to benefit from improving uranium market fundamentals.
The South Falcon East is the company’s flagship uranium project. It spans over 12,234 hectares and is located 18 kilometers southeast of the Athabasca Basin and 55 kilometers east of the Key Lake mine. The project area enjoys excellent infrastructure, including two highways and access to electricity.
The project has geological characteristics similar to high-grade basement-hosted deposits in the Athabasca Basin, such as Millennium, Eagle Point, Roughrider and P-Patch. Historical exploration at the South Falcon East project led to the discovery of the Fraser Lakes Zone B deposit in 2008. The Zone B deposit is located within the broader 6-kilometer by 7-kilometer Fraser Lakes target area that is considered to have exceptional resource potential along strike and at depth.
The Fraser Lakes Zone B deposit comprises multiple-stacked uranium, thorium and REE mineralization with an NI 43-101 mineral resource estimate of 6.9 Mlb triuranium octoxide at 0.03, and 5.3 Mlb thorium oxide at 0.023 percent within 10.3 million tons (Mt) of material using a cut-off grade of 0.01 percent triuranium octoxide.
Tisdale has planned drill programs through 2025. The main objective of the drilling is to validate and expand the current mineralization linked to the Fraser Lakes Zone B uranium deposit. The infill drilling aims to verify the presence and consistency of the existing mineralization, laying the groundwork for future resource updates. Additionally, the company will carry step-out drilling to enlarge the deposit’s footprint, given that the current mineralization is open in all directions.
A second priority involves initiating regional exploration by investigating potential anomalies identified in the T-Bone Lake area. Regional drilling will concentrate on uncovering additional mineralized zones and deposits within the folded structural package hosting the Fraser Lakes B deposit.
Tisdale has raised nearly C$1.9 million in private placement over two tranches (one in December 2023 and the other in February 2024). The money will be used to advance the 2024 drilling program. Management is confident of increasing the size and grade of the resource base. The project is well positioned to ride the current optimism in the sector.
In 2024, the company began mobilizing crews and equipment to the South Falcon East project commencing the initial Phase 1 program, which will consist of up to approximately 1,500 meters of drilling. Tisdale drilled 442 metres in the first two drill holes with Hole SF-0059 completed to a depth of 221 metres and intersected multiple zones of uranium mineralization over 13.5 metres, confirming the presence of mineralization in the vicinity of historical hole FP-15-05.
2024 drill target areas at the south Falcon East uranium project
Alex Klenman has over three decades of rich experience in the private and public sectors in various domains, including marketing, business development, media, finance and corporate communications. Over the last ten years, he has held senior leadership roles at Leocor Gold, Cross River Ventures, Manning Ventures and Nexus Gold. Moreover, as a consultant, he has worked with Roxgold, Forum Uranium, Midnight Sun Mining, Integra Gold and others.
C. Trevor Perkins is a geologist with over 25 years of experience planning and executing mineral exploration projects and leading exploration teams. He has worked with Rio Tinto, Cameco Corporation, and UEX Corporation. He has led teams that have made significant uranium deposit discoveries.
Brian Shin is a chartered professional accountant in British Columbia and has over 15 years of experience in various roles, including CFO, controller, consultant and auditor.
Mark Ferguson has over 25 years of experience in the trust and finance sector, and has held senior leadership roles at several public and private companies. Previously, he worked with Scotia Bank, Montreal Trust and Computershare Trust Company.
Andrew Brown has over 12 years of experience, having served in senior roles at companies listed on TSX Venture and CSE in various sectors, including agriculture, technology, mining and resources.
Jordan Trimble is the president, chief executive officer and director of Skyharbour Resources. Under his leadership, Skyharbour has grown from a $2 million shell company to a $90 million market cap as a leading exploration company in the Athabasca Basin. Throughout his career, Trimble has founded and helped manage several public and private companies having worked in the resource industry in various roles specializing in management, corporate finance and strategy, shareholder communications, business development and capital raising. He is a frequent speaker at resource and mining conferences globally and has appeared on various media outlets including BNN and the Financial Post. Trimble holds a Bachelor of Science Degree with a Minor in Commerce from the University of British Columbia, and he is a CFA Charterholder and served a full term as director of the CFA Society Vancouver.
Tisdale Clean Energy Corp. has announced a name change to Terra Clean Energy Corp.
Shares will begin trading under the new name and with a new CUSIP number on October 3, 2024.
The symbol will remain the same.
Disclosure documents are available at www.thecse.com.
Please note that all open orders will be canceled at the end of business on October 2, 2024. Dealers are reminded to re-enter their orders.
_________________________________
Tisdale Clean Energy Corp. a annoncé un changement de nom Terra Clean Energy Corp.
Les actions commenceront à être négociées sous le nouveau nom et avec un nouveau numéro CUSIP le 3 octobre 2024
Le symbole restera le même.
Les documents d'information sont disponibles sur www.thecse.com.
Veuillez noter que toutes les commandes ouvertes seront annulées à la fin des activités le 2 octobre 2024. Les concessionnaires sont priés de saisir à nouveau leurs commandes.
Effective Date/ Date Effective : | le 3 OCT 2024 |
Symbol/ Symbole : | TCEC |
New CUSIP/ Nouveau CUSIP : | 88100M 10 5 |
New ISIN/ Nouveau ISIN : | CA 88100M 10 5 9 |
Old/Vieux CUSIP & ISIN : | 88825J106/CA88825J1066 |
If you have any questions or require further information, please contact Listings at (416) 367-7340 or E-mail: Listings@thecse.com
Pour toute question, pour obtenir de l'information supplémentaire veuillez communiquer avec le service des inscriptions au 416 367-7340 ou par courriel à l'adresse: Listings@thecse.com
News Provided by Newsfile via QuoteMedia
Tisdale Clean Energy Corp. (CSE: TCEC) is pleased to announce that the company is presenting a live virtual corporate update hosted by Red Cloud Financial Services on May 6th, 2024 at 2pm ET.
We invite our shareholders, and all interested parties to register for the webinar and participate in the live Q&A session at the end of the presentation moderated by Red Cloud.
The replay will be emailed out to all webinar registrants proceeding the event and will also be available on the Red Cloud website.
For more information and to register: https://redcloudfs.com/events/rcwebinar-tcec/.
Learn about an undervalued microcap explorer developing a near-surface uranium deposit within a larger, highly prospective exploration opportunity in the Athabasca Basin.
Commodities to be covered: Uranium
About Tisdale Clean Energy Corp.
Tisdale Clean Energy is a uranium exploration and development company developing the Fraser Lakes B Uranium Deposit within the larger South Falcon East project, Athabasca Basin, Saskatchewan.
About Red Cloud Securities Inc.
Red Cloud Securities Inc. is an IIROC-regulated investment dealer focused on providing a full range of brokerage services to all investor types focused in the junior resource sector. Our services include Investment Banking, Research, Institutional and Retail Trading, Institutional Sales, and Retail Investment Advisory services.
About Red Cloud Financial Services Inc.
Red Cloud Financial Services Inc. is a globally focused capital markets advisory firm that provides a full range of executive strategy, media, marketing, and corporate access services. Our breadth of services combines with our significant knowledge of the junior mining industry combine for unique product offering. The company was founded by capital markets professionals with extensive experience in the junior mining industry.
For further information:
Tisdale Clean Energy Corp.
Alex Klenman, CEO
6049704330
aklenman@tisdalecleanenergy.com
For additional information contact marketing@redcloudfs.com or visit:
www.redcloudfs.com
www.facebook.com/RedCloudFinancialServices
www.twitter.com/RedCloudFS
www.linkedin.com/company/red-cloud-financial-services-inc
www.youtube.com/c/RedCloudFinancialServicesInc
www.instagram.com/redcloudfs
News Provided by Newsfile via QuoteMedia
(TheNewswire)
Tisdale Clean Energy Corp. ("Tisdale" or the "Company") (CSE:TCEC ) ( OTC:TCEFF ) ( FSE:T1KC), is pleased to invite investors and other interested parties to attend an upcoming interview with Market Radius Research
Martin Gagel of Market Radius Research , Tisdale CEO Alex Klenman, and lead geologist C. Trevor Perkins, will discuss Tisdale's South Falcon East uranium project which contains the Fraser Lake B uranium deposit, and the Company's earn-in agreement with Skyharbour Resources to explore and develop the project.
The webinar will be a live, interactive online event where attendees are invited to ask the Company questions in real-time following the interview. An archived webcast will be made available for those who cannot join the event live on the day of the webinar.
Event: Radius Research Pitch, Deep Dive, and Q&A with Tisdale Clean Energy Corp.
Presentation Date & Time: Thursday, March 7th at 1:00 PM ET / 10:00 AM PT
Webcast Registration Link:
https://us02web.zoom.us/webinar/register/2117092235396/WN_YyE5G8neTXC8FvDlz9TaGg
Market Radius Research gives individual investors access to in-depth CEO interviews with deep-dive institutional level discussion and Q&A. Market Radius is hosted by Martin Gagel, former top-ranked technology analyst. By registering for this webinar, you agree to receive email communications from Market Radius Capital, Inc. and from the presenting company (with unsubscribe). Your email will not be further shared. Martin Gagel and Market Radius Capital, Inc. are not registered or licensed to provide investment advice and may own shares in mentioned companies and may be compensated for these services. Content is for information purposes only and is not advice or recommendations and may include incomplete or incorrect information. Investing entails a high degree of risk. This is a production of Market Radius Capital, Inc.
About Tisdale Clean Energy Corp.
Tisdale Clean Energy is a Canadian-based uranium exploration and development company. The Company is currently developing the South Falcon East uranium project, a 12,770-hectare project located in the Athabasca Basin region, Saskatchewan, Canada, which contains the Fraser Lakes B uranium/thorium deposit.
For further information, contact Alex Klenman at info@tisdalecleanenergy.com or 604.970.4330 .
ON BEHALF OF THE BOARD OF Tisdale Clean Energy Corp.
"Alex Klenman"
Alex Klenman, Chief Executive Officer
This news release may contain certain "Forward-Looking Statements" within the meaning of the United States Private Securities Litigation Reform Act of 1995 and applicable Canadian securities laws. When or if used in this news release, the words "anticipate", "believe", "estimate", "expect", "target, "plan", "forecast", "may", "schedule" and similar words or expressions identify forward-looking statements or information. These forward-looking statements or information may relate to the anticipated use of proceeds from the Offering and other factors or information. Such statements represent the Company's current views with respect to future events and are necessarily based upon a number of assumptions and estimates that, while considered reasonable by the Company, are inherently subject to significant business, economic, competitive, political and social risks, contingencies and uncertainties. Many factors, both known and unknown, could cause results, performance or achievements to be materially different from the results, performance or achievements that are or may be expressed or implied by such forward-looking statements. The Company does not intend, and does not assume any obligation, to update these forward-looking statements or information to reflect changes in assumptions or changes in circumstances or any other events affecting such statements and information other than as required by applicable laws, rules and regulations.
Copyright (c) 2024 TheNewswire - All rights reserved.
News Provided by TheNewsWire via QuoteMedia
(TheNewswire)
Tisdale Clean Energy Corp. (the " Company " or " Tisdale ") (CSE:TCEC ) ( OTC:TCEFF ) ( FSE:T1KC ) is pleased to announce that it has closed a further non-brokered private placement (the " Offering ") and has issued 2,179,500 units (each, a " Unit ") at a price of $0.18 per Unit for gross proceeds of $392,310. Each "Unit" issued in the Offering consists of one common share of the Company and one share purchase warrant exercisable at a price of $0.30 until February 29, 2026
In connection with completion of the Offering, the Company paid $20,720 and issued 115,115 share purchase warrants (each, a " Brokers Warrant ") to certain arms-length brokerage firms who assisted in introducing subscribers to the Offering. Each Brokers Warrant is exercisable at a price of $0.30 until February 29, 2026. All securities issued in connection with closing of the Offering are subject to restrictions on resale until June 30, 2024, in accordance with applicable securities laws.
The proceeds from the Offering will be used for general working capital purposes and for carrying out exploration programs at the South Falcon East uranium project.
About Tisdale Clean Energy Corp.
Tisdale Clean Energy is a Canadian-based uranium exploration and development company. The Company is currently developing the South Falcon East uranium project, a 12,770 hectare project located in the Athabasca Basin region, Saskatchewan, Canada, which contains the Fraser Lakes B uranium/thorium deposit.
For further information, contact Alex Klenman at info@tisdalecleanenergy.com or 604.970.4330 .
ON BEHALF OF THE BOARD OF Tisdale Clean Energy Corp.
"Alex Klenman"
Alex Klenman, Chief Executive Officer
This news release may contain certain "Forward-Looking Statements" within the meaning of the United States Private Securities Litigation Reform Act of 1995 and applicable Canadian securities laws. When or if used in this news release, the words "anticipate", "believe", "estimate", "expect", "target, "plan", "forecast", "may", "schedule" and similar words or expressions identify forward-looking statements or information. These forward-looking statements or information may relate to the anticipated use of proceeds from the Offering and other factors or information. Such statements represent the Company's current views with respect to future events and are necessarily based upon a number of assumptions and estimates that, while considered reasonable by the Company, are inherently subject to significant business, economic, competitive, political and social risks, contingencies and uncertainties. Many factors, both known and unknown, could cause results, performance or achievements to be materially different from the results, performance or achievements that are or may be expressed or implied by such forward-looking statements. The Company does not intend, and does not assume any obligation, to update these forward-looking statements or information to reflect changes in assumptions or changes in circumstances or any other events affecting such statements and information other than as required by applicable laws, rules and regulations.
Copyright (c) 2024 TheNewswire - All rights reserved.
News Provided by TheNewsWire via QuoteMedia
(TheNewswire)
Tisdale Clean Energy Corp. (" Tisdale " or the " Company ") (TSXV:TCEC ) ( OTC: TCEFF ) ( FSE: T1KC ) is pleased to confirm its upcoming work program at the South Falcon East Uranium Project which hosts the Fraser Lakes B uranium deposit. The south Falcon East Project lies 18 km outside the edge of the Athabasca Basin, approximately 50 km east of the Key Lake uranium mill and former mine
Tisdale Clean Energy Corp entered into an option agreement with SkyHarbour Resources Ltd in October of 2022 whereby the company can earn up to a 75% interest in the South Falcon East property.
The Company is set to begin a preliminary phase one drill program for late winter 2024. The initial phase one program will consist of up to approximately 1,500 meters of drilling. The priority will be to confirm and expand the existing mineralization associated with the Fraser Lakes B Uranium Deposit (Figure 2). Infill drilling will confirm the presence and continuity of existing mineralization in preparation for a current updated resource estimate and 3D model in the future. Step out drilling will endeavor to expand the footprint of the deposit, as the current mineralization is open in all directions. Initial focus will be in extending mineralization along strike and down dip into the basement.
A secondary priority will be to begin regional exploration by following up promising anomalies located in the T-Bone Lake area (Figure 2). Regional drilling will focus on the effort to add additional mineralized zones and deposits along the folded structural package that hosts the Fraser Lakes B Deposit.
"The commencement of drilling is a milestone in terms of our ability to unlock the value contained at South Falcon," said Alex Klenman, CEO. "Right now, nobody is getting much credit for those pounds in the ground. This will begin to change as we drill and earn our interest in the project. The initial phase one plan allows us to meet the early obligations of the earn-in with Skyharbour. We are hopeful our valuation will grow as a result, therefore reducing the barrier to entry for institutional support and giving us the opportunity to implement larger drill programs moving forward through 2024 and beyond.
"We believe very strongly that both the size and average grade of the resource can be increased. The last holes drilled in 2015 generated U308 values of .172% and .165% over intervals of two meters or more. These results established that higher grade uranium exists within the deposit. We have a very compelling exploration narrative, and one we feel confident in pursuing. No doubt the first steps are the hardest, and we're pleased we're able to begin to execute on the plan," continued Mr. Klenman.
"We are thrilled to have Tisdale commence their inaugural drill program at South Falcon East," said Jordan Trimble, CEO of Skyharbour Resources. "The project is an advanced-stage exploration asset that hosts a near-surface uranium resource with strong expansion potential as well as robust discovery upside potential regionally on the property. We are confident that this winter drill program will unlock further value for both companies' shareholders with the uranium price trading near sixteen-year highs," continued Mr. Trimble.
The field program is anticipated to commence in late February and will be executed by Terralogic Exploration Inc. under the supervision of Laura Tennent, Project Manager with TerraLogic Exploration, and C. Trevor Perkins, consulting geologist for Tisdale. The drill program will be operating out of Skyharbour's McGowan Lake Camp with helicopter support for the daily drilling operations. The expected budget for the initial phase one program is anticipated to be $1.25 million.
Figure 1: South Falcon East Project Location – Eastern Athabasca Basin, Saskatchewan, Canada
Figure 2: 2024 Drill Target areas at the south Falcon East Uranium Project
Figure 3: South Falcon East Project – Camp and drilling location Map
About the South Falcon East Project
The South Falcon East Project is a uranium exploration project in the southeast Athabasca Basin and represents a portion of Skyharbour Resources Ltd.'s existing South Falcon Project. The project covers approximately 12,464 hectares and lies 18 kilometers outside the Athabasca Basin, approximately 50 kilometers east of the Key Lake Mine.
The South Falcon East Project contains the Fraser Lakes B Uranium/Thorium Deposit with a historic mineral resource* of 6.9 Mlbs U3O8 inferred at a grade of 0.03% U3O8 and 5.3 Mlbs ThO2 inferred at a grade of 0.023 % ThO2. Uranium and thorium mineralization discovered to date is shallow classic Athabasca-style basement mineralization associated with well-developed EM conductors.
About Tisdale Clean Energy Corp.
Tisdale Clean Energy is a Canadian-based uranium exploration and development company. The Company is currently developing the South Falcon East uranium project, which holds a 6.96M pound inferred uranium resource within the Fraser Lakes B uranium/thorium deposit, located in the Athabasca Basin region, Saskatchewan, Canada.
Qualified Person
The technical information in this news release has been prepared in accordance with the Canadian regulatory requirements set out in National Instrument 43-101 and reviewed on behalf of the company by C. Trevor Perkins, P.Geo., a Consulting Geologist for the Company, and a Qualified Person as defined by National Instrument 43-101.
* The historical resource is described in the Technical Report on the South Falcon East Property, filed on sedar.com on February 9, 2023. The Company is not treating the resource as current and has not completed sufficient work to classify the resource as a current mineral resource. While the Company is not treating the historical resource as current, it does believe the work conducted is reliable and the information may be of assistance to readers.
ON BEHALF OF THE BOARD OF TISDALE CLEAN ENERGY CORP.
"Alex Klenman"
Alex Klenman, CEO
Neither the TSX Venture Exchange nor its regulation services provider (as that term is defined in the policies of the TSX Venture Exchange) accepts responsibility for the adequacy or accuracy of this release.
This news release may contain certain "Forward-Looking Statements" within the meaning of the United States Private Securities Litigation Reform Act of 1995 and applicable Canadian securities laws. When or if used in this news release, the words "anticipate", "believe", "estimate", "expect", "target, "plan", "forecast", "may", "schedule" and similar words or expressions identify forward-looking statements or information. Such statements represent the Company's current views with respect to future events and are necessarily based upon a number of assumptions and estimates that, while considered reasonable by the Company, are inherently subject to significant business, economic, competitive, political, and social risks, contingencies and uncertainties. Many factors, both known and unknown, could cause results, performance, or achievements to be materially different from the results, performance or achievements that are or may be expressed or implied by such forward-looking statements. The Company does not intend, and does not assume any obligation, to update these forward-looking statements or information to reflect changes in assumptions or changes in circumstances or any other events affecting such statements and information other than as required by applicable laws, rules, and regulations.
For further information please contact:
Alex Klenman, CEO
Tel: 604-970-4330
Tisdale Clean Energy Corp
Suite 2200, HSBC Building, 885 West Georgia St.
Vancouver, BC V6C 3E8 Canada
www.tisdalecleanenergy.com
Copyright (c) 2024 TheNewswire - All rights reserved.
News Provided by TheNewsWire via QuoteMedia
Cameco( TSX: CCO; NYSE: CCJ) today reported its consolidated financial and operating results for the third quarter ended September 30, 2024, in accordance with International Financial Reporting Standards (IFRS).
"Our third quarter operational performance was strong across all segments, supporting our return to a tier-one cost structure," said Tim Gitzel, Cameco's president and CEO. "Looking past quarterly earnings, which can vary significantly, there is a clear underlying trend of improving operational performance and cash flow generation, backed by stable and rising market prices. Apart from the impact of a stronger US dollar, our financial outlook for both Cameco and Westinghouse remained strong and unchanged. To recognize the return to our tier-one production rate and the continued strengthening of the industry's long-term prospects, our board of directors declared an increased 2024 annual dividend of $0.16 per common share. We are also recommending a dividend growth plan to our board of directors, under which we expect to at least double last year's dividend of $0.12 per common share, to $0.24 per common share, over the fiscal periods 2024 through 2026, subject to annual consideration by our board.
"Our disciplined strategy aligns our marketing, operational, and financially focused decisions. From a marketing perspective, we have contracts in both our uranium and fuel services segments that have deliveries spanning more than a decade. However, in a market where we are seeing sustained, positive momentum for nuclear energy, we are continuing to be selective in committing our unencumbered, tier-one, in-ground uranium inventory and UF 6 conversion capacity under long-term contracts, to capture greater upside for many years to come.
"The marketing element of our strategy guides our operational decisions to ensure our supply aligns with our commitments, so we balance our production rates, inventory position, long-term purchases, product loans, and near-term market purchases in order to deliver full-cycle value. This past quarter was a good example of that prudent management of our supply sources, with our 2024 uranium production outlook increasing from 22.4 million pounds (our share) of uranium, to up to 23.1 million pounds (our share) of uranium, thanks to strong production from McArthur River/Key Lake. The higher production level for 2024 is fully committed within our contract portfolio and allows us to rebalance our other supply sources, including a partial offset of the increase in Saskatchewan by lower production and purchases from JV Inkai, where we now expect production of 7.7 million pounds (100% basis) of uranium, down about 600,000 pounds of uranium from last year due to the ongoing acid supply challenges in Kazakhstan.
"The marketing and operational decisions set the stage for the financial element of our strategy, under which we expect strong cash flow generation to underpin our conservative capital allocation priorities. Those priorities include a focus on debt management, as is evident with the prudent refinancing activities we have undertaken in 2024, and the prepayment of a large portion of the term loan we utilized to purchase Westinghouse.
"We are continuing to see a positive shift in government, industry and public support for nuclear energy, further supported by recent announcements between utilities, reactor developers, and the industrial energy users, who are now extending financial support to ensure future access to clean, reliable and scalable nuclear power. Cameco, with our assets and investments across the fuel and reactor life cycles, is uniquely positioned to benefit from those tailwinds as a responsible, commercial supplier with multiple long-lived, tier-one assets in reliable jurisdictions, proven operating experience, and a strong balance sheet to execute our strategy. In a market where we are seeing sustained, positive momentum for nuclear energy, we believe our disciplined strategy will allow us to achieve our vision of ‘energizing a clean-air world' in a manner that reflects our values, including a commitment to address the risks and opportunities that we believe will make our business sustainable over the long term."
Consolidated financial results
THREE MONTHS | NINE MONTHS | ||||||
HIGHLIGHTS | ENDED SEPTEMBER 30 | ENDED SEPTEMBER 30 | |||||
($ MILLIONS EXCEPT WHERE INDICATED) | 2024 | 2023 | CHANGE | 2024 | 2023 | CHANGE | |
Revenue | 721 | 575 | 25% | 1,953 | 1,744 | 12% | |
Gross profit | 171 | 152 | 13% | 533 | 429 | 24% | |
Net earnings attributable to equity holders | 7 | 148 | (95)% | 36 | 281 | (87)% | |
$ per common share (basic) | 0.02 | 0.34 | (94)% | 0.08 | 0.65 | (88)% | |
$ per common share (diluted) | 0.02 | 0.34 | (94)% | 0.08 | 0.65 | (88)% | |
Adjusted net earnings (losses) (ANE) (non-IFRS, see below) | (3) | 137 | >(100)% | 115 | 249 | (54)% | |
$ per common share (adjusted and diluted) | (0.01) | 0.32 | >(100)% | 0.26 | 0.57 | (54)% | |
Adjusted EBITDA (non-IFRS, see below) | 308 | 234 | 32% | 992 | 511 | 94% | |
Cash provided by operations (after working capital changes) | 52 | 185 | (72)% | 376 | 487 | (23)% |
The financial information presented for the three months and nine months ended September 30, 2023, and September 30, 2024, is unaudited.
Selected segment highlights
THREE MONTHS | NINE MONTHS | |||||||
ENDED SEPTEMBER 30 | ENDED SEPTEMBER 30 | |||||||
HIGHLIGHTS | 2024 | 2023 | CHANGE | 2024 | 2023 | CHANGE | ||
Uranium | Production volume (million lbs) | 4.3 | 3.0 | 43% | 17.3 | 11.9 | 45% | |
Sales volume (million lbs) | 7.3 | 7.0 | 4% | 20.8 | 22.2 | (6)% | ||
Average realized price 1 | ($US/lb) | 60.18 | 52.57 | 14% | 58.28 | 48.62 | 20% | |
($Cdn/lb) | 82.33 | 70.30 | 17% | 78.97 | 65.40 | 21% | ||
Revenue | 600 | 489 | 23% | 1,642 | 1,452 | 13% | ||
Gross profit | 154 | 139 | 11% | 467 | 349 | 34% | ||
Earnings before income taxes | 171 | 218 | (22)% | 615 | 474 | 30% | ||
Adjusted EBITDA 2 | 240 | 224 | 7% | 790 | 601 | 31% | ||
Fuel services | Production volume (million kgU) | 3.2 | 2.0 | 60% | 9.9 | 9.6 | 3% | |
Sales volume (million kgU) | 3.5 | 2.1 | 67% | 7.9 | 7.8 | 1% | ||
Average realized price 3 | ($Cdn/kgU) | 34.54 | 39.87 | (13)% | 39.17 | 37.44 | 5% | |
Revenue | 120 | 86 | 40% | 311 | 291 | 7% | ||
Earnings before income taxes | 17 | 28 | (39)% | 71 | 97 | (27)% | ||
Adjusted EBITDA 2 | 28 | 36 | (22)% | 96 | 121 | (21)% | ||
Adjusted EBITDA margin (%) 2 | 23 | 42 | (45)% | 31 | 42 | (26)% | ||
Westinghouse | Revenue | 726 | - | n/a | 2,052 | - | n/a | |
(our share) | Net loss | (57) | - | n/a | (227) | - | n/a | |
Adjusted EBITDA 2 | 122 | - | n/a | 320 | - | n/a |
1 | Uranium average realized price is calculated as the revenue from sales of uranium concentrate, transportation and storage fees divided by the volume of uranium concentrates sold. |
2 | Non-IFRS measure, see below. |
3 | Fuel services average realized price is calculated as revenue from the sale of conversion and fabrication services, including fuel bundles and reactor components, transportation and storage fees divided by the volumes sold. |
The table below shows the costs of produced and purchased uranium incurred in the reporting periods (see non-IFRS measures below). These costs do not include care and maintenance costs, selling costs such as royalties, transportation and commissions, nor do they reflect the impact of opening inventories on our reported cost of sales.
THREE MONTHS | NINE MONTHS | ||||||
ENDED SEPTEMBER 30 | ENDED SEPTEMBER 30 | ||||||
($CDN/LB) | 2024 | 2023 | CHANGE | 2024 | 2023 | CHANGE | |
Produced | |||||||
Cash cost | 29.21 | 32.37 | (10)% | 20.90 | 25.60 | (18)% | |
Non-cash cost | 10.40 | 12.24 | (15)% | 9.66 | 11.92 | (19)% | |
Total production cost 1 | 39.61 | 44.61 | (11)% | 30.56 | 37.52 | (19)% | |
Quantity produced (million lbs) 1 | 4.3 | 3.0 | 43% | 17.3 | 11.9 | 45% | |
Purchased | |||||||
Cash cost | 109.59 | 79.14 | 38% | 100.13 | 69.88 | 43% | |
Quantity purchased (million lbs) 1 | 1.8 | 0.8 | >100% | 6.2 | 5.0 | 24% | |
Totals | |||||||
Produced and purchased costs | 60.26 | 51.88 | 16% | 48.91 | 47.09 | 4% | |
Quantities produced and purchased (million lbs) | 6.1 | 3.8 | 61% | 23.5 | 16.9 | 39% |
1 | Due to equity accounting, our share of production from JV Inkai is shown as a purchase at the time of delivery. These purchases will fluctuate during the quarters and timing of purchases will not match production. There were no purchases during the quarter. In the first nine months of 2024, we purchased 1.2 million pounds at a purchase price per pound of $128.42 ($95.63 (US)). |
Non-IFRS measures
The non-IFRS measures referenced in this document are supplemental measures, which are used as indicators of our financial performance. Management believes that these non-IFRS measures provide useful supplemental information to investors, securities analysts, lenders and other interested parties in assessing our operational performance and our ability to generate cash flows to meet our cash requirements. These measures are not recognized measures under IFRS, do not have standardized meanings, and are therefore may not be comparable to similarly titled measures presented by other companies. Accordingly, these measures should not be considered in isolation or as a substitute for the financial information reported under IFRS. We are not able to reconcile our forward-looking non-IFRS guidance because we cannot predict the timing and amounts of discrete items, which could significantly impact our IFRS results.
The following are the non-IFRS measures used in this document.
ADJUSTED NET EARNINGS
Adjusted net earnings is our net earnings attributable to equity holders, adjusted for non-operating or non-cash items such as gains and losses on derivatives and adjustments to reclamation provisions flowing through other operating expenses, that we believe do not reflect the underlying financial performance for the reporting period. Other items may also be adjusted from time to time. We adjust this measure for certain of the items that our equity-accounted investees make in arriving at other non-IFRS measures. Adjusted net earnings is one of the targets that we measure to form the basis for a portion of annual employee and executive compensation (see Measuring our results in our 2023 annual MD&A).
In calculating ANE we adjust for derivatives. We do not use hedge accounting under IFRS and, therefore, we are required to report gains and losses on all hedging activity, both for contracts that close in the period and those that remain outstanding at the end of the period. For the contracts that remain outstanding, we must treat them as though they were settled at the end of the reporting period (mark-to-market). However, we do not believe the gains and losses that we are required to report under IFRS appropriately reflect the intent of our hedging activities, so we make adjustments in calculating our ANE to better reflect the impact of our hedging program in the applicable reporting period. See Foreign exchange in our 2023 annual MD&A for more information.
We also adjust for changes to our reclamation provisions that flow directly through earnings. Every quarter we are required to update the reclamation provisions for all operations based on new cash flow estimates, discount and inflation rates. This normally results in an adjustment to an asset retirement obligation asset in addition to the provision balance. When the assets of an operation have been written off due to an impairment, as is the case with our Rabbit Lake and US ISR operations, the adjustment is recorded directly to the statement of earnings as "other operating expense (income)". See note 10 of our interim financial statements for more information. This amount has been excluded from our ANE measure.
As a result of the change in ownership of Westinghouse when it was acquired by Cameco and Brookfield, Westinghouse's inventories at the acquisition date were revalued based on the market price at that date. As these quantities are sold, Westinghouse's cost of products and services sold reflect these market values, regardless of their historic costs. Our share of these costs is included in earnings from equity-accounted investees and recorded in cost of products and services sold in the investee information (see note 7 to the financial statements). Since this expense is non-cash, outside of the normal course of business and only occurred due to the change in ownership, we have excluded our share from our ANE measure.
Westinghouse has also expensed some non-operating acquisition-related transition costs that the acquiring parties agreed to pay for, which resulted in a reduction in the purchase price paid. Our share of these costs is included in earnings from equity-accounted investees and recorded in other expenses in the investee information (see note 7 to the financial statements). Since this expense is outside of the normal course of business and only occurred due to the change in ownership, we have excluded our share from our ANE measure.
To facilitate a better understanding of these measures, the table below reconciles adjusted net earnings with our net earnings for the third quarter and first nine months of 2024 and compares it to the same periods in 2023.
THREE MONTHS | NINE MONTHS | ||||||||
ENDED SEPTEMBER 30 | ENDED SEPTEMBER 30 | ||||||||
($ MILLIONS) | 2024 | 2023 | 2024 | 2023 | |||||
Net earnings attributable to equity holders | 7 | 148 | 36 | 281 | |||||
Adjustments | |||||||||
Adjustments on derivatives | (28 | ) | 41 | 19 | - | ||||
Inventory purchase accounting (net of tax) | - | - | 50 | - | |||||
Acquisition-related transition costs (net of tax) | 5 | - | 24 | - | |||||
Adjustment to other operating expense (income) | 5 | (48 | ) | (12 | ) | (42 | ) | ||
Income taxes on adjustments | 8 | (4 | ) | (2 | ) | 10 | |||
Adjusted net earnings (losses) | (3 | ) | 137 | 115 | 249 |
The following table shows what contributed to the change in adjusted net earnings (non-IFRS measure, see above) for the third quarter and first nine months of 2024 compares to the same periods in 2023.
THREE MONTHS | NINE MONTHS | ||||||||
ENDED SEPTEMBER 30 | ENDED SEPTEMBER 30 | ||||||||
($ MILLIONS) | IFRS | ADJUSTED | IFRS | ADJUSTED | |||||
Net earnings - 2023 | 148 | 137 | 281 | 249 | |||||
Change in gross profit by segment | |||||||||
(We calculate gross profit by deducting from revenue the cost of products and services sold, and depreciation and amortization (D&A), net of hedging benefits) | |||||||||
Uranium | Impact from sales volume changes | 6 | 6 | (22 | ) | (22 | ) | ||
Higher realized prices ($US) | 74 | 74 | 270 | 270 | |||||
Foreign exchange impact on realized prices | 14 | 14 | 12 | 12 | |||||
Higher costs | (78 | ) | (78 | ) | (139 | ) | (139 | ) | |
Change – uranium | 16 | 16 | 121 | 121 | |||||
Fuel services | Impact from sales volume changes | 9 | 9 | 2 | 2 | ||||
Higher (lower) realized prices ($Cdn) | (19 | ) | (19 | ) | 14 | 14 | |||
Lower (higher) costs | 13 | 13 | (32 | ) | (32 | ) | |||
Change – fuel services | 3 | 3 | (16 | ) | (16 | ) | |||
Other changes | |||||||||
Lower administration expenditures | 15 | 15 | 11 | 11 | |||||
Higher exploration and research and development expenditures | (2 | ) | (2 | ) | (10 | ) | (10 | ) | |
Change in reclamation provisions | (66 | ) | (13 | ) | (40 | ) | (10 | ) | |
Lower earnings from equity-accounted investees | (66 | ) | (61 | ) | (176 | ) | (102 | ) | |
Change in gains or losses on derivatives | 68 | (1 | ) | (23 | ) | (4 | ) | ||
Change in foreign exchange gains or losses | (68 | ) | (68 | ) | - | - | |||
Lower finance income | (30 | ) | (30 | ) | (75 | ) | (75 | ) | |
Higher finance costs | (12 | ) | (12 | ) | (48 | ) | (48 | ) | |
Change in income tax recovery or expense | 3 | 15 | 13 | 1 | |||||
Other | (2 | ) | (2 | ) | (2 | ) | (2 | ) | |
Net earnings (losses) - 2024 | 7 | (3 | ) | 36 | 115 |
EBITDA
EBITDA is defined as net earnings attributable to equity holders, adjusted for the costs related to the impact of the company's capital and tax structure including depreciation and amortization, finance income, finance costs (including accretion) and income taxes. Included in EBITDA is our share of equity-accounted investees.
ADJUSTED EBITDA
Adjusted EBITDA is defined as EBITDA, as further adjusted for the impact of certain costs or benefits incurred in the period which are either not indicative of the underlying business performance or that impact the ability to assess the operating performance of the business. These adjustments include the amounts noted in the ANE definition.
In calculating adjusted EBITDA, we also adjust for items included in the results of our equity-accounted investees that are not adjustments to arrive at our ANE measure. These items are reported as part of other expenses within the investee financial information and are not representative of the underlying operations. These primarily include transaction, integration and restructuring costs related to acquisitions.
The company may realize similar gains or incur similar expenditures in the future.
ADJUSTED EBITDA MARGIN
Adjusted EBITDA margin is defined as adjusted EBITDA divided by revenue for the appropriate period.
EBITDA, adjusted EBITDA and adjusted EBITDA margin are non-IFRS measures which allow us and other users to assess results of operations from a management perspective without regard for our capital structure.
To facilitate a better understanding of these measures, the tables below reconcile net earnings with EBITDA and adjusted EBITDA for the third quarter and first nine months of 2024 and 2023.
For the quarter ended September 30, 2024:
FUEL | ||||||||
($ MILLIONS) | URANIUM | SERVICES | WESTINGHOUSE | OTHER | TOTAL | |||
Net earnings (loss) attributable to equity holders | 171 | 17 | (57 | ) | (124 | ) | 7 | |
Depreciation and amortization | 59 | 11 | - | 1 | 71 | |||
Finance income | - | - | - | (4 | ) | (4 | ) | |
Finance costs | - | - | - | 35 | 35 | |||
Income taxes | - | - | - | 38 | 38 | |||
230 | 28 | (57 | ) | (54 | ) | 147 | ||
Adjustments on equity investees | ||||||||
Depreciation and amortization | 2 | - | 93 | - | ||||
Finance expense | - | - | 54 | - | ||||
Income taxes | 3 | - | (2 | ) | - | |||
Net adjustments on equity investees | 5 | - | 145 | - | 150 | |||
EBITDA | 235 | 28 | 88 | (54 | ) | 297 | ||
Loss on derivatives | - | - | - | (28 | ) | (28 | ) | |
Other operating expense | 5 | - | - | - | 5 | |||
5 | - | - | (28 | ) | (23 | ) | ||
Adjustments on equity investees | ||||||||
Acquisition-related transition costs | - | - | 7 | - | ||||
Other expenses | - | - | 27 | - | ||||
Net adjustments on equity investees | - | - | 34 | - | 34 | |||
Adjusted EBITDA | 240 | 28 | 122 | (82 | ) | 308 |
For the quarter ended September 30, 2023:
FUEL | |||||||
($ MILLIONS) | URANIUM | SERVICES | OTHER | TOTAL | |||
Net earnings (loss) attributable to equity holders | 218 | 28 | (98 | ) | 148 | ||
Depreciation and amortization | 47 | 8 | 1 | 56 | |||
Finance income | - | - | (34 | ) | (34 | ) | |
Finance costs | - | - | 23 | 23 | |||
Income taxes | - | - | 41 | 41 | |||
265 | 36 | (67 | ) | 234 | |||
Adjustments on equity investees | |||||||
Depreciation and amortization | 2 | - | - | ||||
Income taxes | 5 | - | - | ||||
Net adjustments on equity investees | 7 | - | - | 7 | |||
EBITDA | 272 | 36 | (67 | ) | 241 | ||
Gain on derivatives | - | - | 41 | 41 | |||
Other operating income | (48 | ) | - | - | (48 | ) | |
Adjusted EBITDA | 224 | 36 | (26 | ) | 234 |
For the nine months ended September 30, 2024:
FUEL | |||||||||
($ MILLIONS) | URANIUM 1 | SERVICES | WESTINGHOUSE | OTHER | TOTAL | ||||
Net earnings (loss) attributable to equity holders | 615 | 71 | (227 | ) | (423 | ) | 36 | ||
Depreciation and amortization | 148 | 25 | - | 4 | 177 | ||||
Finance income | - | - | - | (18 | ) | (18 | ) | ||
Finance costs | - | - | - | 117 | 117 | ||||
Income taxes | - | - | - | 87 | 87 | ||||
763 | 96 | (227 | ) | (233 | ) | 399 | |||
Adjustments on equity investees | |||||||||
Depreciation and amortization | 12 | - | 267 | - | |||||
Finance income | - | - | (3 | ) | - | ||||
Finance expense | - | - | 172 | - | |||||
Income taxes | 27 | - | (50 | ) | - | ||||
Net adjustments on equity investees | 39 | - | 386 | - | 425 | ||||
EBITDA | 802 | 96 | 159 | (233 | ) | 824 | |||
Gain on derivatives | - | - | - | 19 | 19 | ||||
Other operating income | (12 | ) | - | - | - | (12 | ) | ||
(12 | ) | - | - | 19 | 7 | ||||
Adjustments on equity investees | |||||||||
Inventory purchase accounting | - | - | 66 | - | |||||
Acquisition-related transition costs | - | - | 32 | - | |||||
Other expenses | - | - | 63 | - | |||||
Net adjustments on equity investees | - | - | 161 | - | 161 | ||||
Adjusted EBITDA | 790 | 96 | 320 | (214 | ) | 992 |
For the nine months ended September 30, 2023:
FUEL | |||||||
($ MILLIONS) | URANIUM 1 | SERVICES | OTHER | TOTAL | |||
Net earnings (loss) attributable to equity holders | 474 | 97 | (290 | ) | 281 | ||
Depreciation and amortization | 147 | 24 | 3 | 174 | |||
Finance income | - | - | (93 | ) | (93 | ) | |
Finance costs | - | - | 69 | 69 | |||
Income taxes | - | - | 100 | 100 | |||
621 | 121 | (211 | ) | 531 | |||
Adjustments on equity investees | |||||||
Depreciation and amortization | 6 | - | - | ||||
Income taxes | 16 | - | - | ||||
Net adjustments on equity investees | 22 | - | - | 22 | |||
EBITDA | 643 | 121 | (211 | ) | 553 | ||
Other operating income | (42 | ) | - | - | (42 | ) | |
Adjusted EBITDA | 601 | 121 | (211 | ) | 511 |
CASH COST PER POUND, NON-CASH COST PER POUND AND TOTAL COST PER POUND FOR PRODUCED AND PURCHASED URANIUM
Cash cost per pound, non-cash cost per pound and total cost per pound for produced and purchased uranium are non-IFRS measures. We use these measures in our assessment of the performance of our uranium business. These measures are not necessarily indicative of operating profit or cash flow from operations as determined under IFRS.
To facilitate a better understanding of these measures, the table below reconciles these measures to cost of product sold and depreciation and amortization for the third quarter and first nine months of 2024 and 2023.
THREE MONTHS | NINE MONTHS | ||||||||
ENDED SEPTEMBER 30 | ENDED SEPTEMBER 30 | ||||||||
($ MILLIONS) | 2024 | 2023 | 2024 | 2023 | |||||
Cost of product sold | 386.5 | 304.6 | 1,027.0 | 959.1 | |||||
Add / (subtract) | |||||||||
Royalties | (38.4 | ) | (22.3 | ) | (88.5 | ) | (61.0 | ) | |
Care and maintenance costs | (13.4 | ) | (12.1 | ) | (37.3 | ) | (35.2 | ) | |
Other selling costs | (2.9 | ) | (3.0 | ) | (12.2 | ) | (7.1 | ) | |
Change in inventories | (8.9 | ) | (106.8 | ) | 93.4 | (201.8 | ) | ||
Cash costs of production (a) | 322.9 | 160.4 | 982.4 | 654.0 | |||||
Add / (subtract) | |||||||||
Depreciation and amortization | 59.3 | 47.1 | 147.5 | 147.2 | |||||
Care and maintenance costs | (0.2 | ) | (0.8 | ) | (0.6 | ) | (3.4 | ) | |
Change in inventories | (14.4 | ) | (9.6 | ) | 20.2 | (2.0 | ) | ||
Total production costs (b) | 367.6 | 197.1 | 1,149.5 | 795.8 | |||||
Uranium produced & purchased (million lbs) (c) | 6.1 | 3.8 | 23.5 | 16.9 | |||||
Cash costs per pound (a ÷ c) | 52.93 | 42.21 | 41.80 | 38.70 | |||||
Total costs per pound (b ÷ c) | 60.26 | 51.88 | 48.91 | 47.09 |
Management's discussion and analysis (MD&A) and financial statements
The third quarter MD&A and unaudited condensed consolidated interim financial statements provide a detailed explanation of our operating results for the three and nine months ended September 30, 2024, as compared to the same periods last year. This news release should be read in conjunction with these documents, as well as our audited consolidated financial statements and notes for the year ended December 31, 2023, first quarter, second quarter and annual MD&A, and our most recent annual information form, all of which are available on our website at cameco.com, on SEDAR+ at sedarplus.ca, and on EDGAR at sec.gov/edgar.shtml.
Qualified persons
The technical and scientific information discussed in this document for our material properties McArthur River/Key Lake, Cigar Lake and Inkai was approved by the following individuals who are qualified persons for the purposes of NI 43-101:
MCARTHUR RIVER/KEY LAKE
CIGAR LAKE
INKAI
Caution about forward-looking information
This news release includes statements and information about our expectations for the future, which we refer to as forward-looking information. Forward-looking information is based on our current views, which can change significantly, and actual results and events may be significantly different from what we currently expect. Examples of forward-looking information in this news release include: our view that our third quarter operational performance supports our return to a tier-one cost structure, and that there is a trend of improving operational performance and cash flow generation, backed by stable and rising market prices; our financial outlook for both Cameco and Westinghouse; our expectation of continued strengthening of the industry's long term prospects; our recommended dividend growth plan and expectations regarding dividend payments, and increases through 2026; our perception of sustained, positive momentum for nuclear energy, and our ability to capture greater upside in future years; our view that our strategy will align with our commitments, permitting us to deliver fully-cycle value; our 2024 uranium production outlook; our ability to rebalance our supply sources; our production expectations for JV Inkai; our expectation of strong cash flow generation, and intention to prioritize debt management and reduction while maintaining liquidity and strong cash flow generation; our perception of a positive shift in government, industry and public support for nuclear energy, and continuing financial support for access to nuclear power; our belief that Cameco is uniquely positioned to benefit from those developments; our expected ability to achieve our vision, including a commitment to make our business sustainable over the long term; our expected uranium average realized prices, production and deliveries and outlook for our share of Westinghouse's 2024 adjusted EBITDA, as well as its performance and cash flows; expected Key Lake Mill and JV Inkai production levels, and timing of shipments and deliveries; the expected timing of the finalization and filing of a new technical report for the Inkai mine; our expectations regarding the building of our long-term contract portfolio and pipeline of business under discussion; our intention to file a new base shelf prospectus in the fourth quarter; and the timing of our third quarter conference call and announcement of our 2024 fourth quarter and annual results.
Material risks that could lead to different results include: unexpected changes in uranium supply, demand, long-term contracting, and prices; changes in consumer demand for nuclear power and uranium as a result of changing societal views and objectives regarding nuclear power, electrification and decarbonization; the risk that our views regarding nuclear power, its growth profile, and benefits, may prove to be incorrect; the risk that we may not be able to achieve planned production levels within the expected timeframes, or that the costs involved in doing so exceed our expectations; the risk that the production levels at Inkai may not be at expected levels due to the unavailability of sufficient volumes of sulfuric acid or for any other reason, or that it may not be able to deliver its production when expected, risks to Westinghouse's business associated with potential production disruptions, the implementation of its business objectives, compliance with licensing or quality assurance requirements, or that it may otherwise be unable to achieve expected growth; the risk that we may not be able to meet sales commitments for any reason; the risks to our business associated with potential production disruptions, including those related to global supply chain disruptions, global economic uncertainty, political volatility, labour relations issues, and operating risks; the risk that we may not be able to implement our business objectives in a manner consistent with our environmental, social, governance and other values; the risk that the strategy we are pursuing may prove unsuccessful, or that we may not be able to execute it successfully; the risk that Westinghouse may not be able to implement its business objectives in a manner consistent with its or our environmental, social, governance and other values; the filing of our new base shelf prospectus or the new technical report for the Inkai mine may be delayed for unanticipated reasons; we may be unable to pay dividends on our common shares through 2026 in the amounts we currently expect; and the risk that we may be delayed in announcing our future financial results.
In presenting the forward-looking information, we have made material assumptions which may prove incorrect about: uranium demand, supply, consumption, long-term contracting, growth in the demand for and global public acceptance of nuclear energy, and prices; our production, purchases, sales, deliveries and costs; the market conditions and other factors upon which we have based our future plans and forecasts; our contract pipeline discussions; Inkai production, its receipt of sufficient volumes of sulfuric acid, and our allocation of planned production and timing of deliveries; assumptions about Westinghouse's production, purchases, sales, deliveries and costs, the absence of business disruptions, and the success of its plans and strategies; the success of our plans and strategies, including planned production; the absence of new and adverse government regulations, policies or decisions; that there will not be any significant adverse consequences to our business resulting from production disruptions, including those relating to supply disruptions, economic or political uncertainty and volatility, labour relation issues, aging infrastructure, and operating risks; the assumptions relating to Westinghouse's adjusted EBITDA; the filing of our new base shelf prospectus and the new technical report for the Inkai mine will not be delayed for unanticipated reasons; annual dividends on our common shares will be declared and paid in the amounts we expected through 2026 and our ability to announce future financial results when expected.
Please also review the discussion in our 2023 annual MD&A, our 2024 first and second quarter MD&A and our most recent annual information form for other material risks that could cause actual results to differ significantly from our current expectations, and other material assumptions we have made. Forward-looking information is designed to help you understand management's current views of our near-term and longer-term prospects, and it may not be appropriate for other purposes. We will not necessarily update this information unless we are required to by securities laws.
Conference call
We invite you to join our third quarter conference call on Thursday, November 7, 2024, at 8:00 a.m. Eastern.
The call will be open to all investors and the media. To join the call, please dial (844) 763-8274 (Canada and US) or (647) 484-8814. An operator will put your call through. The slides and a live webcast of the conference call will be available from a link at cameco.com. See the link on our home page on the day of the call.
A recorded version of the proceedings will be available:
2024 fourth quarter and annual report release date
We plan to announce our 2024 fourth quarter and annual consolidated financial and operating results before markets open on February 20, 2025. Announcement dates are subject to change.
Profile
Cameco is one of the largest global providers of the uranium fuel needed to energize a clean-air world. Our competitive position is based on our controlling ownership of the world's largest high-grade reserves and low-cost operations, as well as significant investments across the nuclear fuel cycle, including ownership interests in Westinghouse Electric Company and Global Laser Enrichment. Utilities around the world rely on Cameco to provide global nuclear fuel solutions for the generation of safe, reliable, carbon-free nuclear power. Our shares trade on the Toronto and New York stock exchanges. Our head office is in Saskatoon, Saskatchewan, Canada.
As used in this news release, the terms we, us, our, the Company and Cameco mean Cameco Corporation and its subsidiaries unless otherwise indicated.
View source version on businesswire.com: https://www.businesswire.com/news/home/20241106081013/en/
Investor inquiries:
Cory Kos
306-716-6782
cory_kos@cameco.com
Media inquiries:
Veronica Baker
306-385-5541
veronica_baker@cameco.com
News Provided by Business Wire via QuoteMedia
C29 Metals receives official Category 2 environmental permit, MOU signed with Volkov Geology (100% owned subsidiary of Katomprom the national & only Uranium producer in Kazakhstan) strong local community support, and a Social Support Agreement signed.
C29 Metals Limited (ASX:C29) (C29, or the Company) is pleased to announce that it has received the official Category 2 environmental permit allowing drilling to be undertaken at the Ulytau uranium project with the Official permit received from the Natural Resources and Environmental Management Department.
HIGHLIGHTS
On the 28 October 2024, the Company announced the signing of an MOU with Volkov Geology, a 100% owned subsidiary of Katomprom the national & only Uranium producer in Kazakhstan.
Negotiations have continued and the Company is pleased to advise that we are at a very advanced stage of finalising the commercial agreement with Volkov Geology and finalising the commercial agreement with the independent drilling contractor.
As this initial program will be short in nature the drilling will see several key strategic holes drilled to test and verify the mineralisation in a small area of the Ulytau tenement. with final design of the initial drilling program at an advanced stage it is now planned to extend the initial diamond drill holes to a depth of ~500m. The greater depth is to test the area of highest geological confidence and to commence testing the geological theory that the mineralised trend is a part of a larger multi element geological occurrence.
The Company’s geology team has an established base of operations at the nearby village of Aksuyek where C29 enjoys strong community support.
C29 Metals Managing Director, Mr Shannon Green, commented:
“It is very exciting to have the official environmental permit enabling our team to commence the initial diamond drilling program this season. Obtaining this permit so quickly after receiving official notification that all regulatory requirements for the issue of the drill permit had been met once again demonstrates the positive operating environment in Kazakhstan and the support the company is enjoying”.
Diamond Drill Program
The initial diamond drill program has been designed to test and verify historical drill intersects and will see several key strategic holes drilled in a small area of the Ulytau tenement. With final design of the initial drilling program at an advanced stage it is now planned to extend the initial diamond drill holes to a depth of ~500m. The greater depth is to test the area of highest geological confidence and to commence testing the geological theory that the mineralised trend is a part of a larger multi element geological occurrence.
The geology team will be utilising a handheld XRF unit in the field providing real time geological information to the team and valuable geological data that will assist in prioritising the samples for assay.
Figure 1 below shows the interpreted mineralised uranium trend1 and location for initial Category 2 drilling.
Figure 1 – The interpreted mineralised Uranium trend & location for initial Category 2 drilling.
Project Location and history
The Ulytau Uranium Project is located in the Almaty Region of Southern Kazakhstan approximately 15 km southwest of the Bota-Burum mine, one of the largest uranium deposits mined in the former Soviet Union. Exploration for uranium has been carried out in the area since 1953. Production of Uranium at the Bota Burum mine next to the village of Aksuyek commenced in 1956 and continued until 19911.
Total mined reserves of Bota Burum are quoted at 20,000 tonnes of Uranium (44 million pounds)1,2.
Click here for the full ASX Release
This article includes content from C29 Metals Limited, licensed for the purpose of publishing on Investing News Australia. This article does not constitute financial product advice. It is your responsibility to perform proper due diligence before acting upon any information provided here. Please refer to our full disclaimer here.
Ur-Energy Inc. (NYSE American:URG)(TSX:URE) (the "Company" or "Ur-Energy") has filed the Company's Form 10-Q for the quarter ended September 30, 2024, with the U.S. Securities and Exchange Commission at www.sec.govedgar.shtml and with Canadian securities authorities at www.sedarplus.ca
Ur-Energy CEO, John Cash said: "The uranium market fundamentals remain strong, and, despite some volatility, we expect to see continued price support based on a slow response by suppliers to growing demand. We estimate this imbalance will take many years to correct and could be exacerbated by geopolitical events.
"Production at Lost Creek continued to increase quarter over quarter. While ramp-up has progressed at a slower rate than anticipated, we continue to work through the remaining challenges to facilitate steady state operations with increased production. Development and construction programs at Shirley Basin continue to advance and we expect to increase our company wide production capacity to 2.2M pounds per year in early 2026 when we anticipate bringing Shirley Basin online."
Lost Creek Operations
During 2024 Q3 we captured 75,075 pounds, dried and packaged 71,804 pounds and shipped 67,488 pounds U3O8. Although not at previously anticipated rates, these figures represent increases in production numbers compared with the captured and dried figures of earlier quarters.
At quarter end, our in-process inventory was approximately 90,140 pounds, our drummed inventory at Lost Creek was 26,580 pounds, and our finished inventory at the conversion facility was 40,713 pounds U3O8. In addition to the two shipments made to the conversion facility during 2024 Q3, we made two shipments following the end of the quarter, which totaled 46,592 pounds U3O8.
As we continue to work through the challenges of ramp-up at Lost Creek, we now anticipate 2024 production will be in a range between 240,000 and 280,000 pounds U3O8 captured on IX resin.
We expect to satisfy our remaining 2024 contractual commitments to our customers with Lost Creek production and other available sources.
Sales of U3O8 and Sales Agreements
We sold 100,000 pounds U3O8 in 2024 Q3 at an average price of $61.65 per pound for proceeds of $6.2 million.
We continue to anticipate that we will deliver and sell 570,000 pounds U3O8 in 2024. Including the revenue received during the quarter, we expect to realize revenues of $33.1 million from our 2024 U3O8 sales.
We anticipate we will deliver 740,000 pounds U3O8 into three of our term sales agreements in 2025.
Financial Results
As of September 30, 2024, we had cash resources of $129.4 million, which was an increase of $61.2 million from the $68.2 million balance on December 31, 2023. During the nine months ended September 30, 2024, we spent $32.5 million on operating activities, used $5.7 million on investing activities, and generated $99.3 million from financing activities.
U3O8 Sales by Product, U3O8 Product Cost, and U3O8 Product Profit 1
The following table provides information on our U3O8 sales, product costs, and product profit.
Unit | 2023 Q4 | 2024 Q1 | 2024 Q2 | 2024 Q3 | 2024 YTD | |||||||||||||||||||
U3O8 Pounds Sold | ||||||||||||||||||||||||
Produced | lb | 90,000 | - | 75,000 | 100,000 | 175,000 | ||||||||||||||||||
Purchased | lb | - | - | - | - | - | ||||||||||||||||||
lb | 90,000 | - | 75,000 | 100,000 | 175,000 | |||||||||||||||||||
U3O8 Sales | ||||||||||||||||||||||||
Produced | $ 000 | 5,441 | - | 4,624 | 6,165 | 10,789 | ||||||||||||||||||
Purchased | $ 000 | - | - | - | - | - | ||||||||||||||||||
$ 000 | 5,441 | - | 4,624 | 6,165 | 10,789 | |||||||||||||||||||
U3O8 Price per Pounds Sold | ||||||||||||||||||||||||
Produced | $/lb | 60.44 | - | 61.65 | 61.65 | 61.65 | ||||||||||||||||||
Purchased | $/lb | - | - | - | - | - | ||||||||||||||||||
$/lb | 60.44 | - | 61.65 | 61.65 | 61.65 | |||||||||||||||||||
U3O8 Product Cost | ||||||||||||||||||||||||
Ad valorem and severance taxes | $ 000 | 53 | - | 42 | 81 | 123 | ||||||||||||||||||
Cash costs | $ 000 | 1,674 | - | 2,336 | 3,798 | 6,134 | ||||||||||||||||||
Non-cash costs | $ 000 | 797 | - | 749 | 1,012 | 1,761 | ||||||||||||||||||
Produced | $ 000 | 2,524 | - | 3,127 | 4,891 | 8,018 | ||||||||||||||||||
Purchased | $ 000 | - | - | |||||||||||||||||||||
$ 000 | 2,524 | - | 3,127 | 4,891 | 8,018 | |||||||||||||||||||
U3O8 Cost per Pound Sold | ||||||||||||||||||||||||
Ad valorem and severance taxes | $/lb | 0.59 | - | 0.56 | 0.81 | 0.70 | ||||||||||||||||||
Cash costs | $/lb | 18.60 | - | 31.15 | 37.98 | 35.05 | ||||||||||||||||||
Non-cash costs | $/lb | 8.85 | - | 9.98 | 10.12 | 10.07 | ||||||||||||||||||
Produced | $/lb | 28.04 | - | 41.69 | 48.91 | 45.82 | ||||||||||||||||||
Purchased | $/lb | - | - | - | - | - | ||||||||||||||||||
$/lb | 28.04 | - | 41.69 | 48.91 | 45.82 | |||||||||||||||||||
U3O8 Product Profit | ||||||||||||||||||||||||
Produced | $ 000 | 2,917 | - | 1,497 | 1,274 | 2,771 | ||||||||||||||||||
Purchased | $ 000 | - | - | - | - | - | ||||||||||||||||||
$ 000 | 2,917 | - | 1,497 | 1,274 | 2,771 | |||||||||||||||||||
U3O8 Product Profit per Pound Sold | ||||||||||||||||||||||||
Produced | $/lb | 32.40 | - | 19.96 | 12.74 | 15.83 | ||||||||||||||||||
Purchased | $/lb | - | - | - | - | - | ||||||||||||||||||
$/lb | 32.40 | - | 19.96 | 12.74 | 15.83 | |||||||||||||||||||
U3O8 Product Profit Margin | ||||||||||||||||||||||||
Produced | % | 53.6 | % | 0.0 | % | 32.4 | % | 20.7 | % | 25.7 | % | |||||||||||||
Purchased | % | 0.0 | % | 0.0 | % | 0.0 | % | 0.0 | % | 0.0 | % | |||||||||||||
% | 53.6 | % | 0.0 | % | 32.4 | % | 20.7 | % | 25.7 | % |
1 The U3O8 and cost per pound measures included in the above table do not have a standardized meaning within US GAAP or a defined basis of calculation. These measures are used by management to assess business performance and determine production and pricing strategies. They may also be used by certain investors to evaluate performance. |
We sold 175,000 pounds of U3O8 in the nine months ended September 30, 2024 at an average price per pound sold of $61.65. In the nine months ended September 30, 2023, we sold 190,000 pounds at an average price per pound sold of $62.56.
Our total sales in 2024 are projected at 570,000 pounds of U3O8 at an average price per pound sold of $58.15 and we expect to realize revenues of $33.1 million. The deliveries are under contracts negotiated in 2022, when the long-term price was between $43 and $52 per pound.
U3O8 Production and Ending Inventory
The following table provides information on our production and ending inventory of U3O8 pounds.
Unit | 2023 Q4 | 2024 Q1 | 2024 Q2 | 2024 Q3 | 2024 YTD | |||||||||||||||||||
U3O8 Production | ||||||||||||||||||||||||
Pounds captured | lb | 68,448 | 38,221 | 70,679 | 75,075 | 183,975 | ||||||||||||||||||
Pounds drummed | lb | 6,519 | 39,229 | 64,170 | 71,804 | 175,203 | ||||||||||||||||||
Pounds shipped | lb | - | 35,445 | 70,390 | 67,488 | 173,323 | ||||||||||||||||||
U3O8 Ending Inventory | ||||||||||||||||||||||||
Pounds | ||||||||||||||||||||||||
In-process inventory | lb | 82,033 | 80,465 | 86,204 | 90,140 | |||||||||||||||||||
Plant inventory | lb | 22,278 | 26,062 | 21,570 | 26,580 | |||||||||||||||||||
Conversion inventory - produced | lb | 43,790 | 79,235 | 74,625 | 40,713 | |||||||||||||||||||
lb | 148,101 | 185,762 | 182,399 | 157,433 | ||||||||||||||||||||
Value | ||||||||||||||||||||||||
In-process inventory | $ 000 | - | - | 447 | 427 | |||||||||||||||||||
Plant inventory | $ 000 | 1,343 | 1,593 | 1,072 | 1,499 | |||||||||||||||||||
Conversion inventory - produced | $ 000 | 1,228 | 3,105 | 3,555 | 2,320 | |||||||||||||||||||
$ 000 | 2,571 | 4,698 | 5,074 | 4,246 | ||||||||||||||||||||
Cost per Pound | ||||||||||||||||||||||||
In-process inventory | $/lb | - | - | 5.19 | 4.74 | |||||||||||||||||||
Plant inventory | $/lb | 60.28 | 61.12 | 49.70 | 56.40 | |||||||||||||||||||
Conversion inventory - produced | $/lb | 28.04 | 39.19 | 47.64 | 56.98 | |||||||||||||||||||
Produced conversion inventory detail | ||||||||||||||||||||||||
Ad valorem and severance tax | $/lb | 0.59 | 0.53 | 0.67 | 1.63 | |||||||||||||||||||
Cash cost | $/lb | 18.60 | 28.47 | 36.77 | 45.26 | |||||||||||||||||||
Non-cash cost | $/lb | 8.85 | 10.19 | 10.20 | 10.09 | |||||||||||||||||||
$/lb | 28.04 | 39.19 | 47.64 | 56.98 |
2024 Continuing Guidance
With eight operational Header Houses (HHs) in MU2, we continue our ramp up toward target production levels and steady state operations at Lost Creek. To facilitate ongoing increases in production levels, we anticipate increasing our drill rig count through the end of the year to approximately 20 rigs. Fabrication of HHs 2-13 through 2-15 is in progress in our Casper construction shop and onsite construction related to these next header houses continues to advance. HH 2-15 is a newly planned production area for which we are advancing development and construction. We are also drilling in MU1 for the next phase of its production.
Because of continuing challenges of ramp-up at Lost Creek, we now anticipate 2024 production will be in a range between 240,000 and 280,000 pounds U3O8 captured on IX resin.
We have commitments under contracts negotiated in 2022, when the long-term price was between $43 and $52 per pound, for deliveries of 570,000 pounds U3O8 in 2024 and expect to realize revenues of $33.1 million. We anticipate making our remaining deliveries of 395,000 pounds U3O8 during Q4 with Lost Creek production and other available alternatives.
During the quarter, uranium spot prices softened to an average of approximately $82 per pound U3O8. However, average term pricing, which has increased steadily for several years now, reached approximately $81 per pound U3O8 during the quarter.
Term pricing has been supported by continued requests for proposals ("RFPs") in the market from utilities and other global fuel buyers. We have responded to the RFPs with prices commensurate with rising market conditions including increased demand for domestically produced uranium. Our contract book now includes agreements with six leading nuclear fuel purchasers, with commitments of approximately 5.7 million pounds U3O8 with deliveries occurring in 2024 through 2030. Sales prices are anticipated to be profitable on an all-in production cost basis and escalate annually from initial pricing, including some market-based pricing features.
We are progressing the buildout of a satellite facility at our wholly owned, fully permitted and licensed Shirley Basin Project in Carbon County, Wyoming. The buildout will nearly double our annual permitted mine production to 2.2 million pounds U3O8.
At October 30, 2024, our unrestricted cash position was $110.3 million. With this strong treasury, we are well funded for continuing construction at Shirley Basin.
Installation of the monitor wells for the first mine unit at Shirley Basin is complete. We have commenced the pump test program, which remains on schedule to be completed this year. Road construction is complete and the refurbishment of existing and installation of new electric infrastructure are all advancing. Renovation of existing buildings has begun. Major construction activities at Shirley Basin are expected to begin in 2025 and initial production is expected to commence in early 2026.
We are pleased to be one of the few publicly traded companies that is commercially recovering uranium and working to expand our production capacity to sell into a sustained stronger uranium market. We will continue to closely monitor the uranium markets, and other developments, which may affect the uranium production industry and provide the opportunity to put in place additional off-take sales contracts.
As always, we will focus on maintaining safe and compliant operations.
About Ur-Energy
Ur-Energy is a uranium mining company operating the Lost Creek in situ recovery uranium facility in south-central Wyoming. We have produced and packaged approximately 2.7 million pounds U3O8 from Lost Creek since the commencement of operations. Ur-Energy has all major permits and authorizations to begin construction at Shirley Basin, the Company's second in situ recovery uranium facility in Wyoming and is advancing Shirley Basin construction and development following the March 2024 ‘go' decision for the mine. We await the remaining regulatory authorization for the expansion of Lost Creek. Ur‑Energy is engaged in uranium mining, recovery and processing activities, including the acquisition, exploration, development, and operation of uranium mineral properties in the United States. The primary trading market for Ur‑Energy's common shares is on the NYSE American under the symbol "URG." Ur‑Energy's common shares also trade on the Toronto Stock Exchange under the symbol "URE." Ur-Energy's corporate office is in Littleton, Colorado and its registered office is in Ottawa, Ontario.
FOR FURTHER INFORMATION, PLEASE CONTACT
John W. Cash, Chairman, CEO and President
+1 720-981-4588, ext. 303
John.Cash@Ur-Energy.com
Cautionary Note Regarding Forward-Looking Information
This release may contain "forward-looking statements" within the meaning of applicable securities laws regarding events or conditions that may occur in the future (e.g., our ability to maintain operations at Lost Creek in a safe and compliant fashion; ability and timing to overcome production challenges to increase production levels and meet our production projections; whether we are able to remain ahead of supply chain challenges in our procurement of equipment and supplies for both Lost Creek and Shirley Basin; our ability to timely deliver into our sales contracts with Lost Creek production and other available sources; the ability to advance development and construction priorities at Lost Creek and Shirley Basin including further recruitment and retention of employees; the ability to complete build out of Shirley Basin as currently projected and budgeted; whether market fundamentals will remain strong and whether the imbalance being created in supply demand may take years to correct and the effects of geopolitical events; and whether we are able to complete additional favorable uranium sales agreements) and are based on current expectations that, while considered reasonable by management at this time, inherently involve a number of significant business, economic and competitive risks, uncertainties and contingencies. Generally, forward-looking statements can be identified by the use of forward-looking terminology such as "plans," "expects," "does not expect," "is expected," "is likely," "estimates," "intends," "anticipates," "does not anticipate," or "believes," or variations of the foregoing, or statements that certain actions, events or results "may," "could," "might" or "will be taken," "occur," "be achieved" or "have the potential to." All statements, other than statements of historical fact, are considered to be forward-looking statements. Forward-looking statements involve known and unknown risks, uncertainties and other factors which may cause the actual results, performance or achievements of the Company to be materially different from any future results, performance or achievements express or implied by the forward-looking statements. Factors that could cause actual results to differ materially from any forward-looking statements include, but are not limited to, capital and other costs varying significantly from estimates; failure to establish estimated resources and reserves; the grade and recovery of ore which is mined varying from estimates; production rates, methods and amounts varying from estimates; delays in obtaining or failures to obtain required governmental, environmental or other project approvals; inflation; changes in exchange rates; fluctuations in commodity prices; delays in development and other factors described in the public filings made by the Company at www.sedarplus.ca and www.sec.gov. Readers should not place undue reliance on forward-looking statements. The forward-looking statements contained herein are based on the beliefs, expectations and opinions of management as of the date hereof and Ur-Energy disclaims any intent or obligation to update them or revise them to reflect any change in circumstances or in management's beliefs, expectations or opinions that occur in the future.
SOURCE: Ur-Energy Inc.
News Provided by ACCESSWIRE via QuoteMedia
With protectionist views and a mandate to “make America great again,” what does another Donald Trump presidency mean for the domestic and international resource sectors?
During his first term in office, Trump focused on deregulation and energy independence, aiming to boost American oil, gas and coal production while rolling back environmental protections.
As he prepares to lead the US for a second time, experts are already speculating that Trump will pursue similar policies, providing support for the mining and energy sectors, but stalling clean energy efforts.
The president-elect is likely to take an “America first” approach to many of his policy decisions. This protectionist approach has been viewed as supportive of the US fossil fuel and mining industries, prioritizing energy independence and economic growth through expanded oil, gas and coal production.
There has also been speculation that he could ease environmental regulations, expedite drilling permits and encourage domestic mining for critical minerals — all of which would help the US resource industry.
Offering insight into how the 47th president may impact the oil and gas sector, Matthew Cunningham, editor at FocusEconomics, said oil prices may get a boost as supply declines and US demand rises.
“On the supply side, Trump could tighten sanctions against oil producers Iran and Venezuela, a strategy he pursued during his last mandate; on the demand side, Trump could scrap regulations and tax credits encouraging the production of electric vehicles (EVs), in turn raising demand for gasoline and therefore crude oil," he explained.
The Republican Party first used the "drill, baby, drill" mantra in 2008, and during his campaign the president-elect was quick to adopt the idea in his approach to the US oil and gas sector. “Trump is also vocal about wanting to boost domestic crude production, stating if he were 'a dictator for a day,' he would use his power 'for drilling and for closing the border,' though government policy typically only has a limited impact on US output,” said Cunningham.
Drilling could also refer to mining, a topic Trump has also spoken on during the campaign season. At a July rally in Minnesota, he told the crowd he would repeal a Biden-era 20 year mining ban in the state.
“We will end that ban, in about, what do you think, in about 10 minutes, I would say about 10 to 15 minutes, right Pete?” Trump said, referring to Pete Stauber, Minnesota’s Republican representative.
“Tonight, I pledge to Minnesota miners that when I am reelected, I will reverse the Biden-Harris attack on your way of life and we will turn the Iron Range into a mineral powerhouse like never before,” he added.
Increasing US uranium supply is an issue that has garnered support on both sides of the aisle.
During his previous term in office, Trump called for the creation of a US uranium reserve, outlining plans to spend US$150 million annually on U3O8 purchases. The earmarked funds were part of his proposed 2021 budget, which failed to come to fruition as Trump lost the 2020 presidential race to current President Joe Biden.
This time, the president-elect could allocate more money to the domestic stockpile.
“Luckily, uranium is one of the few things that both Democrats and Republicans can agree on — we've actually gotten surprisingly bipartisan support,” said Gerardo Del Real, co-founder of Digest Publishing and editor of Daily Profit Cycle. “So regardless of who ends up winning this election, I think there's nothing, but bright days ahead in the uranium sector."
To increase supply and ensure energy security, Trump could repeal a Biden-era uranium-mining ban near the Grand Canyon. In August 2023, the Biden administration designated Baaj Nwaavjo I’tah Kukveni a national monument, protecting over a million acres from uranium mining to preserve Indigenous sites and water resources.
With Trump soon to return to office, some wonder if his pledge to revise the Antiquities Act under the Project 2025 playbook will mean fewer protections for Baaj Nwaavjo I’tah Kukveni and other areas.
Ultimately, a second Trump administration could expand mining and drilling on US federal lands, potentially affecting parks and protected areas. While supporters are pointing to the benefits of securing energy independence, critics are warning of environmental damage and risks to wildlife and Indigenous lands.
Although Trump has spoken out against about EVs in the past, some market watchers believe his strong opposition toward China may ultimately benefit the US battery metals supply chain.
“There will be impacts on the speed of EV adoption, with a Harris win plus Congress majority likely leading to the most bullish EV demand growth scenario, and a Trump win plus Congress majority leading to the slowest,” Adam Megginson, analyst at Benchmark Intelligence, told the Investing News Network (INN) in October.
There has been speculation that Trump will look to levy 10 percent or higher tariffs on a wide range of Chinese imports. Given that the Asian nation is a leading producer of EV batteries, and the primary refiner for many in-demand EV materials, it's possible such tariffs will bode well for domestic supply chain growth in the US.
“On the supply side, future federal funding for the development of a domestic supply chain may be more frugal following a Trump outcome, but his administration’s stance remains quite anti-China, and developing a domestic supply chain would remain aligned with this ideology,” Megginson explained in his comments.
Jack Bedder of Project Blue said he will be watching for regulation changes that could impact the cobalt supply chain.
“The outcome could impact everything from trade patterns to investment trends, and foreign policies/tariffs,” he told INN in an October email. “In addition, the USA has recently been financially backing a lot of cobalt mines and refining projects to support domestic demand. However, the election result could have a large bearing on US environmental policies, with certain environmental/climate-related regulations potentially undergoing evaluation/changes, impacting the progression of these projects,” added Bedder, who is Project Blue's founder and director.
Also speaking about cobalt, Roman Aubry, cobalt pricing analyst at Benchmark, noted that a Democrat win would likely be “better” for long-term demand for cobalt. Now that Trump has secured the White House, the expert will be watching what the new administration does regarding the Inflation Reduction Act (IRA).
“Although a Trump victory is unlikely to lead to repealing the IRA, he has been critical of the EV industry previously,” Aubry said. “Furthermore, changes to the (foreign entity of concern) thresholds could further limit tax credits to other foreign countries in an attempt to bolster the US domestic market as part of his 'tough on China' approach.”
Looking at the energy transition more broadly, experts are already suggesting that while Trump may impede the shift, he won't stop it entirely. While federal incentives might face challenges, the clean energy momentum driven by state policies, corporate commitments and economic factors will likely keep growth on track, albeit at a reduced pace.
“There is no denying that another Trump presidency will stall national efforts to tackle the climate crisis and protect the environment, but most US state, local, and private sector leaders are committed to charging ahead. And you can count on a chorus of world leaders confirming that they won’t turn their back on climate and nature goals,” Dan Lashof, US director of the World Resources Institute, said in a press release following the election results.
He went on to state that Trump's return to office is unlikely to stop US clean energy growth, which has accelerated through bipartisan support for wind, solar and battery projects spurred by recent federal investments.
Leaders across political lines see clean energy as economically beneficial and a strong job creator, and Trump could face bipartisan resistance if he attempts to dismantle these incentives.
Lashof also pointed to the mounting toll of climate disasters. As of November 1, the US had experienced 24 “weather or climate disasters” for the year, with each resulting in more than US$1 billion in damages.
Don’t forget to follow us @INN_Resource for real-time updates!
Securities Disclosure: I, Georgia Williams, hold no direct investment interest in any company mentioned in this article.
Editorial Disclosure: The Investing News Network does not guarantee the accuracy or thoroughness of the information reported in the interviews it conducts. The opinions expressed in these interviews do not reflect the opinions of the Investing News Network and do not constitute investment advice. All readers are encouraged to perform their own due diligence.
AuKing Mining Limited (ASX: AKN, AuKing) is pleased to advise that, together with local Saudi Arabian partner, Barg Alsaman Mining Company (BSMC), it has been successful in securing the “Shaib Marqan” exploration licence as part of the Saudi Ministry of Industry and Mineral Resources’ 6th Licensing Round bid process.
HIGHLIGHTS
The Saudi Ministry of Industry and Mineral Resources (Ministry) issued an Information Memorandum dated 5 August 2024 (IM) as part of the 6th Licensing Round bid process. The following highlighted information was included in the IM in relation to Shaib Marqan:
Managing Director, Paul Williams commented: “AuKing is very pleased to have secured the Shaib Marqan exploration licence with its local partner BSMC. We understand that this 6th Bidding Round has been the subject of significant interest from companies around the world and it is an honour to be recognized by the Ministry with this successful bid. Shaib Marqan is situated in a highly mineralized area within the famous Arabian-Nubian Shield geological region and is situated within close proximity to various established deposits.
Systematic exploration across the licence area could lead to the rapid identification of a significant mineral deposit within the Ar Rayn Terrane”, he said.
We will now commence work with both the Ministry and our local Saudi partner, BSMC, to seek to finalise the grant of the formal Shaib Marqan exploration licence over the next several weeks”, Mr Williams said.
Saudi Arabia’s Mining Sector Expansion
Saudi Arabia’s Vision 2030 reform agenda has elevated the mining sector’s role in the Saudi economy, positioning it as a third key economic pillar as part of the National Industrial Development and Logistics Program. The Kingdom’s focus on mining is driven by a desire to diversify the economy and increase non-oil revenue as it weans itself off oil dependence.
Furthermore, minerals are key inputs in many industries essential to Vision 2030 objectives, such as achieving a green transition, digitizing the economy, becoming a global hub for technology and connectivity, producing nuclear energy, and localizing military procurement.
The new mining law that came into effect in 2021 targets the exploitation of the Kingdom’s mineral resources and the development of its mineral-based manufacturing industry, all of which are aimed at reducing imports to the Kingdom by circa $10Billion and generate more than 200,000 jobs by 2030.
Shaib Marqan Gold Project
Shaib Marqan is situated in central Saudi Arabia and covers an area of 91.8km2. The project area is around 240km south-west of Riyadh and is part of the Ar Rayn Terrane along the eastern margin of the Arabian-Nubian Shield (ANS). Despite being smaller than other terranes within the ANS, the Ar Rayn Terrane is known for hosting multiple mineral systems and mineral commodities, including volcanogenic massive sulfide (VMS)-hosted copper and zinc, epithermal and orogenic gold, and iron oxide copper/gold (IOCG) deposits.
Ancient workings have been documented throughout the Al Amar Belt, concentrating mainly on quartz veins with disseminated pyrite. The area was first mapped in 1956, with intermittent exploration occurring between 1970 and 1994.
The Ar Rayn Terrane in general has been the focus of exploration activities since the 1950’s. Notably, the Al Amar Au-Ag-Zn-Cu deposit, the Khnaiguiyah Zn-Cu-iron-manganese deposit and the Jabal Idsas magnetite prospect are all hosted within the Ar Rayn Terrane. The Al Amar Mine is located 100km northwest of Shaib Marqan project area and produced 27,443 ounces Au in 2022 (Ma’aden, 2022).
Previous exploration within the Ar Rayn Terrane includes mapping, regional geophysical surveying, and geochemical sampling of a single mineral occurrence within the KSA’s Mineral Occurrence Documentation System (MODS). Shaib Marqan stands out as a relatively under-explored area of the Ar Rayn Terrane in close proximity to several established deposits. Based upon the previous exploration work in the region, further systematic exploration activities could lead to the rapid generation of new precious and base metals targets.
Click here for the full ASX Release
This article includes content from Auking Mining, licensed for the purpose of publishing on Investing News Australia. This article does not constitute financial product advice. It is your responsibility to perform proper due diligence before acting upon any information provided here. Please refer to our full disclaimer here.
John Ciampaglia, CEO of Sprott Asset Management, discusses uranium supply, demand and price developments, honing in on recent deals geared at feeding power demand for artificial intelligence (AI).
"I think it's inevitable that (small modular reactor) technology gets commercialized and scaled, and that's the part that has been relatively new," he told the Investing News Network during an interview.
"We never would have guessed it would have been AI data centers that kicked it all off, but I think it's a very exciting development, and it helps to really validate the thesis that we've been talking about for over three years at this point."
Ciampaglia also spoke about the potential impact of the US election, saying that while Republicans have historically been more pro-nuclear than Democrats, the industry is now receiving bipartisan support.
"Irrespective of who wins, we think nuclear is going to continue to receive support," he emphasized.
Watch the interview above for more of his thoughts on uranium supply, demand and prices.
Don’t forget to follow us @INN_Resource for real-time updates!
Securities Disclosure: I, Charlotte McLeod, hold no direct investment interest in any company mentioned in this article.
Editorial Disclosure: The Investing News Network does not guarantee the accuracy or thoroughness of the information reported in the interviews it conducts. The opinions expressed in these interviews do not reflect the opinions of the Investing News Network and do not constitute investment advice. All readers are encouraged to perform their own due diligence.
Investing News Network websites or approved third-party tools use cookies. Please refer to the cookie policy for collected data, privacy and GDPR compliance. By continuing to browse the site, you agree to our use of cookies.