
November 18, 2024
Red Mountain Mining Limited (“RMX” or the “Company”) is pleased to advise that it has received geochemical results for 284 soil samples collected during September from the Company’s 100%-owned Flicka Lake prospect in Ontario, Canada. The soil sampling was undertaken in parallel with a rock grab sampling program (refer ASX announcement: 6 November 2024). Samples were taken from around 400 locations within the Flicka Lake claims and 91 rock grab samples and 284 soil samples were collected and submitted for multielement geochemical analysis.
HIGHLIGHTS
- Exceptionally high gold assay results from Flicka Lake in Canada received potentially supporting the discovery of a new Gold and Copper Region
- In soil Gold values returned from two areas include:
- 17.8ppm (17.8 g/t Au), 6.32ppm (6.32 g/t Au) and 1.11ppm (1.11 g/t Au) returned from North of the project area.
- 0.816ppm (0.816 g/t Au) returned for a single sample from the northwest of the claims.
- These results suggest potential for a large concealed high grade vein-hosted gold mineralisation similar to that seen at the Flicka Zone
- Results from the north and northwest of the Flicka Lake project area indicate the potential for near-surface high grade quartz-vein hosted gold mineralisation
- Polymetallic copper-rich soil anomalies with values of up to 2420ppm Cu indicate the potential of Flicka Lake for volcanic-hosted base metal sulfide mineralisation, particularly in the northern part of the tenement
- Potential high grade Copper discovery provides material potential exploration upside given the program was focused on Gold
- The Company will follow up these positive gold and base metal results and the previously identified Flicka Zone prospect with further exploration as soon as practically possible
High Gold in Soil Values Highlight New Gold prospects within the Flicka Lake Claims
Four soil samples from the northern portion of the project area returned exceptionally high gold values of contained 17.8ppm (17.8 g/t Au), 6.32ppm (6.32 g/t Au) and 1.11ppm (1.11 g/t Au) gold. A further sample from the northwest of the project area contained 0.816ppm gold (0.816 g/t Au).
Highly Significant Copper Results
19 samples contained over 200ppm Cu, with peak values of 2420ppm and 1630ppm. The highest copper value of 2420ppm was returned for sample 1291262, located approximately 400m north of the Flicka Zone. Copper results (see Table 1 and Figure 2).
The gold values returned for the soil samples are shown on Figure 1 with 22 samples, listed on Table 1. As outlined in RMX’s ASX announcement of 30 October 2024, the rock and soil sampling program was designed to test ten orogenic gold target zones defined using available geological and geophysical data for the Flicka Lake tenement. Soil sampling was undertaken primarily in areas that lacked surface outcrop, where rock sampling was not possible.
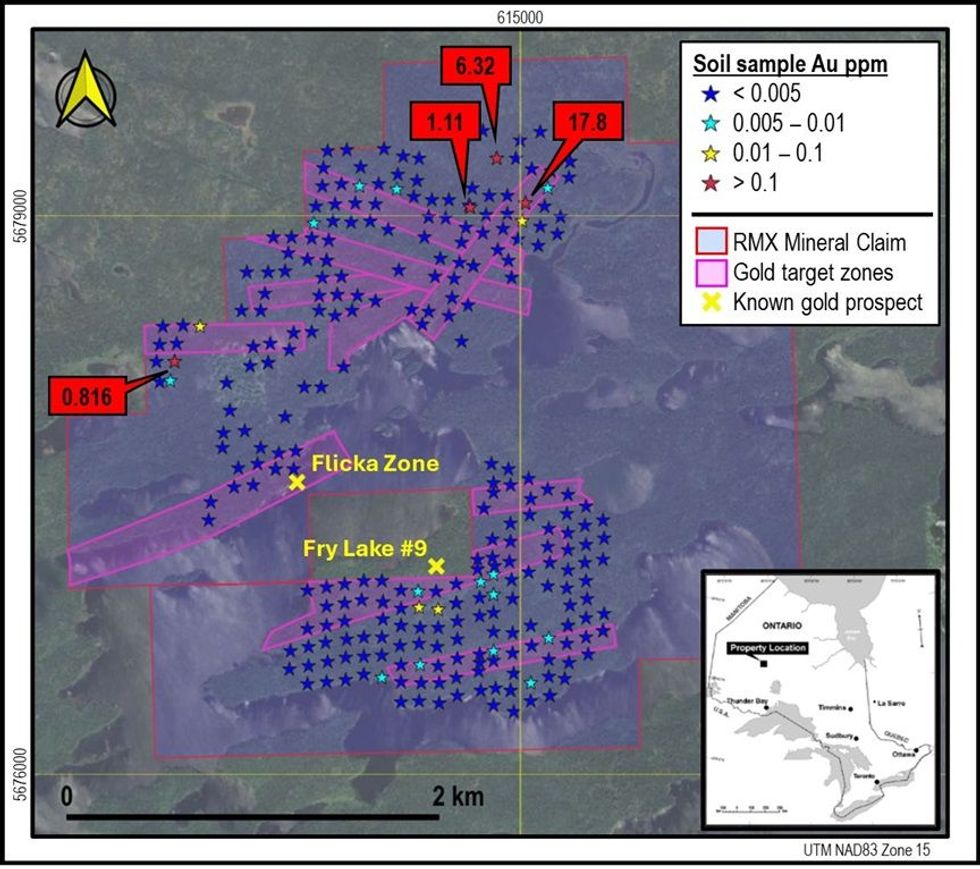
Figure 1: RMX soil gold results for the Flicka Lake project. Values for samples with > 0.1ppm Au are shown. The Fry Lake #9 prospect lies outside of the RMX mineral claims area.
The Company’s geochemical results are consistent with the results of detailed soil sampling from the high- grade Flicka Zone reported by Troon Ventures in their 2003 Assessment Report. Troon reported isolated values of up to 1.19ppm gold (1.19 g/t Au) immediately adjacent to mineralised quartz veins1.
RMX’s results from the north and northwest of the Flicka Lake project area indicate the potential for near- surface high grade quartz-vein hosted gold mineralisation, likely similar in style and tenor to the mineralisation rock chip sampled by RMX at the Flicka Zone (refer ASX Announcement 6 November 2024).
Click here for the full ASX Release
This article includes content from Red Mountain Mining, licensed for the purpose of publishing on Investing News Australia. This article does not constitute financial product advice. It is your responsibility to perform proper due diligence before acting upon any information provided here. Please refer to our full disclaimer here.
The Conversation (0)
1h
Danielle DiMartino Booth: Fed's Next Move as Dissent Builds, Where to Focus Now
Danielle DiMartino Booth breaks down the latest US consumer and producer price index data, saying it's important for investors to pay close attention to the American consumer.
The CEO and chief strategist at QI Research also discusses dissent at the US Federal Reserve, and how many times the central bank may cut interest rates in 2025.
Don’t forget to follow us @INN_Resource for real-time updates!
Securities Disclosure: I, Charlotte McLeod, hold no direct investment interest in any company mentioned in this article.
Keep reading...Show less
15 August
Editor's Picks: Gold Tariff Threat Ends, Price Reacts to Fresh Inflation Data
The gold price cooled off this week as tariff-related uncertainty reached a resolution.
The yellow metal was thrust into headlines late last week when US Customs and Border Protection told a Swiss refiner that 1 kilogram and 100 ounce gold bars would be subject to Trump administration tariffs that went into effect on August 7.
Gold is one of Switzerland's top exports to the US, and with the country facing a 39 percent levy, questions were rife about what the impact could be. Clarification came on Monday (August 11), when US President Donald Trump said on Truth Social that gold "will not be tariffed."
While the news calmed market participants, Keith Weiner of Monetary Metals believes the incident could have long-term impacts. He said the tariff confusion caused the spread between spot gold and gold futures to blow out, creating difficulties for entities using the market to hedge.
Here's how Weiner explained it:
"Once you've put the scare into everybody, you can't just say, 'Oh, sorry, just kidding.' You can't really do that. And so now we've done damage, and we'll see what happens to that spread over time. We'll see how users of the futures market adapt.
"There are other markets in the world that would be competing for this hedging business — maybe it moves to Singapore, maybe it moves to Dubai, maybe it moves to London, and the US loses not only a little more trust, but also a little bit of volume on what had been the biggest, or what is currently the biggest, futures market."
This week also brought the release of US consumer price index (CPI) and producer price index (PPI) data. On a seasonally adjusted basis, CPI for July was up 0.2 percent from the previous month and 2.7 percent from the year-ago period. Meanwhile, core CPI, which excludes the food and energy categories, was up 0.3 percent month-on-month and 3.1 percent from the same time last year.
While those numbers were largely in line with expectations, seasonally adjusted July PPI figures came in hotter than expected, rising 0.9 percent month-on-month compared to Dow Jones' forecast of 0.2 percent. Core PPI increased 0.9 percent from June compared to an estimated rise of just 0.3 percent.
Speaking about the implications of the data, Danielle DiMartino Booth of QI Research said it shows companies aren't yet passing tariff-related price increases on to consumers.
This is what she said about how these circumstances could develop:
"I do think that we will see where companies feel they can push through price increases — I think we'll see that. We saw quite a bit of food inflation in the PPI, and when you're talking about things like essentials, and especially with very, very low-margin types of sales, we could see what we call the substitution effect begin, where households end up buying other things. The classic is always that they trade down from steak to ground beef, or trade down from beef to chicken.
"We're going to see whether or not that plays out again."
While the PPI data has slightly dampened expectations that the US Federal Reserve will cut interest rates when it meets in September, CME Group's (NASDAQ:CME) FedWatch tool still shows a strong probability of a reduction at that time.
Bullet briefing — CATL closes mine, Mitsubishi invests in copper
CATL temporarily closes lithium mine
Contemporary Amperex Technology (HKEX:3750,SZSE:300750), better known as CATL, said on Sunday (August 10) that it will halt production at a lithium mine in China for at least three months.
Sources familiar with the matter told Bloomberg that CATL, which is the world's largest electric vehicle battery maker, failed to extend a key mining permit. The company is reportedly in talks about a renewal, but is prepared for a months-long shutdown.
Share prices of lithium miners rose on the news, buoyed by expectations that the CATL mine closure will help reduce oversupply. Excess output has caused Chinese lithium prices to drop 80 percent since the end of 2022, and investors are keen to see a turnaround for the beleaguered battery metal.
Hudbay, Mitsubishi team up on copper
Mitsubishi (TSE:8058) is set to acquire a 30 percent stake in Hudbay Minerals' (TSX:HBM,NYSE:HBM) Arizona-based Copper World subsidiary for US$600 million.
Hudbay called Mitsubishi its "strategic partner of choice," while Mitsubishi said the investment will help advance its copper growth plans. A feasibility study is in the works for Copper World, and a definitive feasibility study is expected in mid-2026.
Hudbay shareholders reacted positively to the news, which comes on the back of a strong focus on copper supply after last month's announcement of a 50 percent tariff on US imports of semi-finished copper products and intensive copper derivative products. The company projects that Copper World will result in a direct $1.5 billion investment into the US critical minerals supply chain.
Want more YouTube content? Check out our expert market commentary playlist, which features interviews with key figures in the resource space. If there's someone you'd like to see us interview, please send an email to cmcleod@investingnews.com.
And don't forget to follow us @INN_Resource for real-time updates!
Securities Disclosure: I, Charlotte McLeod, hold no direct investment interest in any company mentioned in this article.
Editorial Disclosure: The Investing News Network does not guarantee the accuracy or thoroughness of the information reported in the interviews it conducts. The opinions expressed in these interviews do not reflect the opinions of the Investing News Network and do not constitute investment advice. All readers are encouraged to perform their own due diligence.
Keep reading...Show less
15 August
OPINION — Goldenomics 103: Gold Protects and Performs
This opinion piece was submitted to the Investing News Network (INN) by Darren Brady Nelson, who is an external contributor. INN believes it may be of interest to readers and has copy edited the material to ensure adherence to the company’s style guide; however, INN does not guarantee the accuracy or thoroughness of the information reported by external contributors. The opinions expressed by external contributors do not reflect the opinions of INN and do not constitute investment advice. All readers are encouraged to perform their own due diligence.
By Darren Brady Nelson
US President Donald Trump’s “Liberation Day” tariffs certainly caused quite the stir in the markets on April 2.
Gold dropped about 6 percent, and silver 12 percent. A week later, a pause was announced, which ended on August 1. Gold and silver have since risen approximately 11 percent and 24 percent, respectively.
Six month gold and silver price performance.
Source: Trading Economics (gold) and (silver).
Unless you are a professional, or even amateur, trader, it is best to look at gold and silver investment with a perspective of years or decades, rather than just days, weeks or even months. Since the start of the COVID-19 panic in March 2020, gold and silver have exploded 123 percent and 192 percent.
10 year gold and silver price performance.
Source: Trading Economics (gold) and (silver).
In the shorter term, the gold price is driven by what economist John Maynard Keynes called “animal spirits.” In the longer term, it is driven by “monetary spirits.” And not just as protection, but also for performance. The Presidential Gold Guide highlights both in chapters four and five.
Source: Fisher Liberty Gold.
Gold unsurprisingly protects
Economist and investor Mark Skousen has wisely noted that: “Since we left the gold standard in 1971, both gold and silver have become superior inflation hedges.” Gold has more than countered the results of inflation, as measured by CPI, and the drivers of inflation, as measured by M3.
And the numbers back that up. The Gold Protects chart below compares the gold price, CPI and M3 in terms of cumulative growth of each from 1971 to 2025. That is throughout the whole era of gold as an investment, which officially started in 1974 once private ownership was restored.
During this era, gold grew by 541 percent, CPI by 214 percent and M3 by 384 percent. Annual average growth for gold was 10 percent, CPI at 4 percent and M3 at 7 percent. Maximums were 92 percent, 14 percent and 29 percent, respectively. CPI only failed to grow twice, ie. 0 percent in 2009 and 2015. M3 decreased twice, by -4 percent in 2023 and -6 percent in 2024.
Gold surprisingly performs
The highly respected In Gold We Trust (IGWT) report states: “When dealing with the specific level of gold allocation, it is advisable to differentiate between safe-haven gold and performance gold. The Big Long strategy emphasizes the potential of performance gold in the coming years.”
IGWT thus recommends an investment portfolio "rule of thumb" that includes 15 percent in “safe-haven gold” and 10 percent in “performance gold.” The Gold Performs chart below compares gold price, S&P 500 and nominal GDP in terms of cumulative growth of each from 1971 to 2025.
Gold grew by 541 percent, the S&P 500 by 484 percent and GDP by 339 percent. Annual average growth for gold was 10 percent, with the S&P 500 at 9 percent and GDP at 6 percent. Maximums were 92 percent, 45 percent and 14 percent, respectively. Gold did have a higher standard deviation of 27 percent, compared to 17 percent for the S&P 500 and 3 percent for GDP.
Animal and monetary spirits
Gold protects as a hedge or safe haven, not just from inflation, but from the flip side of that same coin of the boom-bust cycle. Both are driven, in the longer term, not by “animal spirits,” but by “monetary spirits.”
Inflation is when money inflation has a widespread impact as price inflation. A bubble is when money increases have a more concentrated impact such as in certain asset values. The bubble eventually bursts when “monetary spirits” are finally reined in by monetary realities.
I say “monetary spirits” because of the role of fiat money, as indicated by, say, M3. When money supply outstrips money demand in a localized way, then that is a bubble, and when in a general way, that is inflation.
The former shows up in certain asset, wholesale and/or producer prices, whilst the latter shows up in CPI. Asset prices include the S&P 500. But nominal GDP is also "ginned up" as it is ultimately a price times quantity measure as well. Price is expressed in money terms.
Conclusion
Gold can have ups and downs, as standard deviation indicates, due to the “animal spirits” of fear and uncertainty, that tend to be daily, weekly or monthly. Yet gold both protects and performs due to the “monetary spirits” of inflation and boom-bust, which tend to be decennially.
In particular, gold performs when the S&P 500 does not, like in the aftermaths of the 2001/2002 dot-com collapse, the 2008/2009 global financial crisis and 2020/2021 COVID-19 lockdowns.
Therefore, when it comes to gold, “follow the money” of central bank “money printing” and fractional reserve bank “fountain pen money,” for both superior inflation protection and boom-bust performance.
And besides, Skousen rightly "begged the question" as follows: “Gold and Silver have always had value, never gone to zero. Can you say the same for stocks and bonds?”
About Darren Brady Nelson
Darren Brady Nelson is chief economist with Fisher Liberty Gold and policy advisor to The Heartland Institute. He previously was economic advisor to Australian Senator Malcolm Roberts. He authored the Ten Principles of Regulation and Reform, and the CPI-X approach to budget cuts.
Click here to read Goldenomics 101: Follow the Money, and here to read Goldenomics 102: The Shadow Price of Gold.
Keep reading...Show less
15 August
Horn Island Mining Lease Application Registered
14 August
Brien Lundin: Gold at New US$3,000 Floor, Silver Supply Crunch Coming
Brien Lundin, editor of Gold Newsletter, shares his thoughts on gold and silver prices, as well as what types of stocks he's focusing on in these sectors.
In his view, the precious metals are set up for a new era.
Click here to sign up for the New Orleans Investment Conference, hosted by Lundin.
Don't forget to follow us @INN_Resource for real-time updates!
Securities Disclosure: I, Charlotte McLeod, hold no direct investment interest in any company mentioned in this article.
Affiliate Disclosure: The Investing News Network may earn commission from qualifying purchases or actions made through the links or advertisements on this page.
Keep reading...Show less
Latest News
Latest Press Releases
Related News
TOP STOCKS
American Battery4.030.24
Aion Therapeutic0.10-0.01
Cybin Corp2.140.00