The Conversation (0)
- S&P Dow Jones Indices ("S&P DJI") announced today preliminary S&P 500 ® stock buyback, or share repurchases, data for Q3 2021.
Historical data on S&P 500 buybacks are available at www.spdji.com/indices/equity/sp-500 .
Key Takeaways:
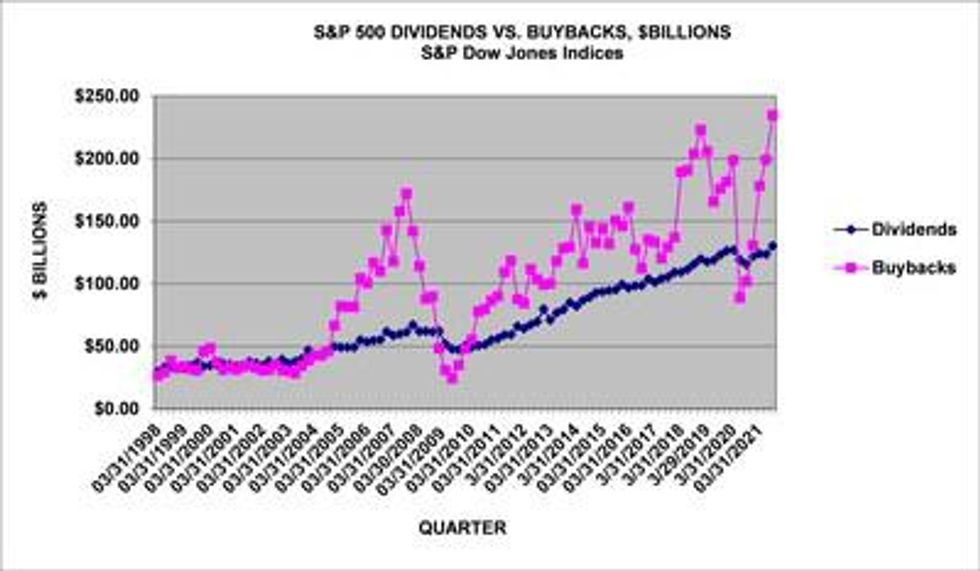
- Q3 2021 share repurchases were $234.6 billion , increasing 18.0% from Q2 2021's $198.8 billion expenditure and up 130.5% from Q3 2020' $101.8 billion .
- 309 companies reported buybacks of at least $5 million for the quarter , up from 294 in Q2 2021, and up from 190 in Q3 2020; 371 issues did some buybacks for the quarter, up from 360 in Q2 2020 and up from 290 in Q3 2020.
- Buybacks remained top heavy with the top 20 issues accounting for 53.8% of Q3 2021 buybacks, down from Q2 2021's 55.7%, down from the dominating 77.4% in Q3 2020, and up from the pre-COVID historical average of 44.5%.
- For the 12-month September 2021 period, buybacks were $742.2 billion , a 21.8% increase from $609.4 billion in the 12-month June 2021 period , and up 30.0% from $570.8 billion in the 12-month September 2020 period.
- Buybacks are expected to continue at a higher level for Q4 2021 as companies continue to cover employee options with discretionary purchases resulting in an increase in share count reduction.
- 7.4% of companies reduced share counts used for EPS by at least 4% year-over-year , up from Q2 2021's 5.4%, and down from Q3 2020's 9.6% period, and significantly down from Q3 2019's 22.8% rate.
- S&P 500 Q3 2021 dividends increased 5.4% to a record $130.0 billion from Q2 2021's $123.4 billion and were 12.5% greater than the $115.5 billion in Q3 2020. For the 12-month September 2021 period, dividends were $498.9 billion , up 2.3% on an aggregate basis from the 12-month September 2020 period's $487.9 billion .
- Total shareholder return of buybacks and dividends was a record $364.7 billion in Q3 2021, up 13.2% from Q2 2021's $322.2 billion and up 67.8% from Q3 2020's $217.3 billion .
- Total shareholder return for the 12-month September 2021 period increased to $1.24 trillion from June 2021's $1.09 trillion and September 2020's $1.06 trillion .
"While companies bought back shares in record numbers in Q3 2021, their expenditures appear cautious when measured against their earnings and market value," said Howard Silverblatt , Senior Index Analyst at S&P Dow Jones Indices. "Additionally, the impact on share count remains significantly lower compared to previous years as higher stock prices have reduced the number of shares companies can buy back with their current expenditures. For the quarter, 248 companies reduced their share counts from Q2 2021, up from 238 in the prior quarter (90 in Q3 2020), but still far from the 322 in pre-COVID Q1 2020, as the year-over-year significant EPS boost from fewer shares remains low at 37 for Q3 2021 compared to 115 for the Q3 2019 period.
Remainder of 2021 Outlook, and into 2022:
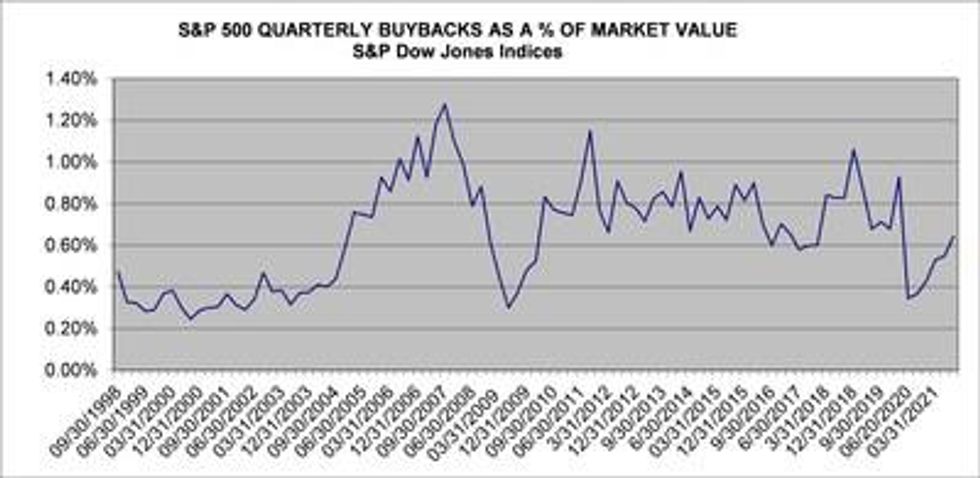
Silverblatt added, "Companies are expected to increase expenditures, which is needed for the higher priced shares, but not enough to impact share count. Q4 2021 is expected to surpass the Q3 2021 $235 billion record, as is 2021, which would replace the annual record of $806 billion set in 2018. At this point, a slight market downturn or correction could also see additional buying, as companies with strong (and expected strong) cash-flow stock up on shares. The proposed 1% buyback tax is not expected to materially impact buybacks, as the average daily high/low spread is near that mark (0.97%), showing that timing (or dollar averaging) is just as important."
Q3 2021 GICS® Sector Analysis :
Information Technology continued to lead in buybacks, as Financials continue to gain (prior to COVID they were within 1% of each other). In Q3 2021, IT's share declined to 28.2% of all S&P 500 buybacks compared to Q2 2021's 31.6%, and was down from Q3 2020's 48.9%, as expenditures increased (5.3%) to $66.1 billion from the prior quarter's $62.8 billion and was 32.8% higher than the Q3 2020 expenditure of $49.7 billion . For the 12-month September 2021 period, the sector spent $241.3 billion , representing 32.5% of all S&P buybacks, up from the prior 12-month period of $198.2 billion , which represented 34.7% of all buybacks. For the 5-years, the sector spent $1.65 trillion , representing 28.4% of the expenditures.
Financial buybacks increased 48.2%, spending $61.9 billion in Q3 2021 representing 26.4% of all buybacks, up from the Q2 2021 $41.8 billion , which accounted for 21.0% of the buybacks. Financial sector buybacks were 410% higher than the Q3 2020 $12.1 billion expenditure, when the Fed limited buybacks. For the 12-month period, the group spent $152.7 billion , up from the prior period of $117.3 billion .
Consumer Staples decrease their buyback expenditures, down 8.9% to $16.2 billion , from the prior quarter's $17.8 billion and up from the Q3 2020 $7.6 billion . As a percentage of all buybacks, the sector increased declined 6.9% of all buybacks from the prior quarter's 8.9%.
Consumer Staples decrease their buyback expenditures, down 6.5% to $8.3 billion , from the prior quarter's $8.9 billion and up from the Q3 2020 $4.2 billion . As a percentage of all buybacks, the sector increased declined 3.6% of all buybacks from the prior quarter's 4.5%.
Issues:
The five issues with the highest total buybacks for Q3 2021 are:
- Apple (AAPL) continued to be the poster child for buybacks as it again spent the most of any issue, with the Q3 2021 expenditure ranked eighth highest in S&P history. For the quarter, the company spent $20.5 billion , down 20.1% from Q2 2021's $25.6 billion . Apple holds 17 of the top 20 record quarters (QUALCOM holds #6, T-Mobile holds #18 and International Business Machines holds #20). For the 12-month period, Apple spent $92.5 billion on buybacks, up from the prior period's $76.0 billion . Over the five-year period, they have spent $348.3 billion and $487.6 billion over the ten-year period.
- Alphabet (GOOG/L) was next: $15.0 billion for Q3 2021, up from $8.4 billion in Q2 2021; the 12-month September 2021 expenditure was $31.5 billion versus $8.7 billion for the 12-months ending September 2020 .
- Meta Platforms, formerly Facebook (FB) : $12.6 billion for Q3 2021, down from $12.8 billion in Q2 2021; the 12-month expenditure was $44.7 billion versus $29.3 billion .
- Oracle (ORCL) : $9.9 billion for Q3 2021, up from $4.2 billion in Q2 2021; the 12-month expenditure was $17.9 billion versus $14.5 billion .
- Microsoft (MSFT): $8.8 billion for Q3 2021, up from $8.0 billion in Q2 2021; the 12-month expenditure was $25.0 billion versus $19.8 billion .
For more information about S&P Dow Jones Indices, please visit www.spdji.com .
| S&P Dow Jones Indices | | | | | | | | |
| S&P 500, $ U.S. BILLIONS | | (preliminary in bold) | | | | | | |
| PERIOD | MARKET | OPERATING | AS REPORTED | | | | | DIVIDEND & |
| | VALUE | EARNINGS | EARNINGS | DIVIDENDS | BUYBACKS | DIVIDEND | BUYBACK | BUYBACK |
| | $ BILLIONS | $ BILLIONS | $ BILLIONS | $ BILLIONS | $ BILLIONS | YIELD | YIELD | YIELD |
| 12 Mo Sep,21 | $36,538 | $1,604.29 | $1,483.50 | $498.95 | $742.21 | 1.37% | 2.03% | 3.40% |
| 12 Mo Sep,20 | $27,868 | $1,021.75 | $813.49 | $487.91 | $570.75 | 1.75% | 2.05% | 3.80% |
| 2020 | $31,659 | $1,019.04 | $784.21 | $483.18 | $519.76 | 1.53% | 1.64% | 3.17% |
| 2019 | $26,760 | $1,304.76 | $1,158.22 | $485.48 | $728.74 | 1.81% | 2.72% | 4.54% |
| 2018 | $21,027 | $1,281.66 | $1,119.43 | $456.31 | $806.41 | 2.17% | 3.84% | 6.01% |
| | | | | | | | | |
| 9/30/2021 | $36,538 | $441.51 | $410.46 | $130.04 | $234.64 | 1.37% | 2.03% | 3.40% |
| 6/30/2021 | $36,325 | $439.95 | $409.02 | $123.38 | $198.84 | 1.33% | 1.68% | 3.01% |
| 3/31/2021 | $33,619 | $401.19 | $388.84 | $123.91 | $178.13 | 1.43% | 1.48% | 2.91% |
| 12/31/2020 | $31,659 | $321.81 | $265.00 | $121.62 | $130.59 | 1.53% | 1.64% | 3.17% |
| 9/30/2020 | $27,868 | $314.06 | $273.29 | $115.54 | $101.79 | 1.75% | 2.05% | 3.80% |
| 6/30/2020 | $25,637 | $221.53 | $147.44 | $119.04 | $88.66 | 1.93% | 2.52% | 4.45% |
| 3/31/2020 | $21,424 | $161.64 | $98.48 | $126.98 | $198.72 | 2.31% | 3.37% | 5.68% |
| 12/31/2019 | $26,760 | $324.52 | $294.29 | $126.35 | $181.58 | 1.81% | 2.72% | 4.54% |
| 9/30/2019 | $24,707 | $330.42 | $282.12 | $123.12 | $175.89 | 1.94% | 3.12% | 5.06% |
| 6/28/2019 | $24,423 | $333.26 | $290.00 | $118.68 | $165.46 | 1.93% | 3.27% | 5.20% |
| 3/29/2019 | $23,619 | $316.56 | $291.82 | $117.33 | $205.81 | 1.97% | 3.49% | 5.45% |
| 12/31/2018 | $21,027 | $293.82 | $242.91 | $119.81 | $222.98 | 2.17% | 3.84% | 6.01% |
| 9/30/2018 | $24,579 | $349.04 | $306.70 | $115.72 | $203.76 | 1.81% | 2.93% | 4.75% |
| 6/30/2018 | $23,036 | $327.53 | $288.55 | $111.60 | $190.62 | 1.89% | 2.80% | 4.69% |
| 3/29/2018 | $22,496 | $311.26 | $281.28 | $109.18 | $189.05 | 1.90% | 2.56% | 4.46% |
| 12/29/2017 | $22,821 | $288.93 | $230.12 | $109.46 | $136.97 | 1.84% | 2.28% | 4.12% |
| 9/29/2017 | $21,579 | $268.35 | $243.68 | $105.45 | $129.17 | 1.92% | 2.40% | 4.32% |
| S&P Dow Jones Indices | | | | | | | | | |
| S&P 500 SECTOR BUYBACKS | | | | | | | | | |
| SECTOR $ MILLIONS | Q3,'21 | Q2,'21 | Q3,'20 | 12MoSep,'21 | 12MoSep,'20 | 5-YEARS | 10-YEARS | Q4,'18 | Q2,'20 |
| | | | | | | | | (high) | (recent low) |
| Consumer Discretionary | $20,553 | $19,193 | $3,247 | $64,528 | $37,270 | $344,503 | $737,907 | $25,652 | $1,317 |
| Consumer Staples | $8,337 | $8,912 | $4,231 | $35,599 | $20,452 | $176,356 | $395,295 | $9,588 | $1,514 |
| Energy | $2,974 | $1,615 | $66 | $5,410 | $9,012 | $72,291 | $222,239 | $8,698 | $60 |
| Financials | $61,927 | $41,777 | $12,101 | $152,693 | $117,316 | $699,756 | $1,065,765 | $45,641 | $8,346 |
| Healthcare | $16,170 | $17,754 | $7,551 | $69,336 | $59,105 | $394,836 | $730,856 | $31,336 | $10,706 |
| Industrials | $17,567 | $14,894 | $3,442 | $53,241 | $36,212 | $286,599 | $588,119 | $23,026 | $1,816 |
| Information Technology | $66,060 | $62,758 | $49,728 | $241,262 | $198,198 | $1,037,980 | $1,648,996 | $61,298 | $36,900 |
| Materials | $5,252 | $4,624 | $785 | $16,534 | $8,637 | $60,508 | $127,528 | $5,857 | $184 |
| Real Estate | $272 | $42 | $406 | $1,473 | $2,502 | $13,548 | $14,003 | $1,480 | $204 |
| Communication Services | $35,230 | $27,268 | $17,316 | $100,860 | $78,552 | $224,708 | $261,355 | $9,556 | $27,548 |
| Utilities | $299 | $7 | $2,914 | $1,272 | $3,496 | $10,131 | $17,755 | $850 | $67 |
| TOTAL | $234,640 | $198,843 | $101,786 | $742,209 | $570,753 | $3,321,214 | $5,809,820 | $222,980 | $88,661 |
| | | | | | | | | | |
| SECTOR BUYBACK MAKEUP % | Q3,'21 | Q2,'21 | Q3,'20 | 12MoSep,'21 | 12MoSep,'20 | 5-YEARS | 10-YEARS | Q4,'18 | Q2,'20 |
| Consumer Discretionary | 8.76% | 9.65% | 3.19% | 8.69% | 6.53% | 10.37% | 12.70% | 11.50% | 1.49% |
| Consumer Staples | 3.55% | 4.48% | 4.16% | 4.80% | 3.58% | 5.31% | 6.80% | 4.30% | 1.71% |
| Energy | 1.27% | 0.81% | 0.06% | 0.73% | 1.58% | 2.18% | 3.83% | 3.90% | 0.07% |
| Financials | 26.39% | 21.01% | 11.89% | 20.57% | 20.55% | 21.07% | 18.34% | 20.47% | 9.41% |
| Healthcare | 6.89% | 8.93% | 7.42% | 9.34% | 10.36% | 11.89% | 12.58% | 14.05% | 12.07% |
| Industrials | 7.49% | 7.49% | 3.38% | 7.17% | 6.34% | 8.63% | 10.12% | 10.33% | 2.05% |
| Information Technology | 28.15% | 31.56% | 48.85% | 32.51% | 34.73% | 31.25% | 28.38% | 27.49% | 41.62% |
| Materials | 2.24% | 2.33% | 0.77% | 2.23% | 1.51% | 1.82% | 2.20% | 2.63% | 0.21% |
| Real Estate | 0.12% | 0.02% | 0.40% | 0.20% | 0.44% | 0.41% | 0.24% | 0.66% | 0.23% |
| Communication Services | 15.01% | 13.71% | 17.01% | 13.59% | 13.76% | 6.77% | 4.50% | 4.29% | 31.07% |
| Utilities | 0.13% | 0.00% | 2.86% | 0.17% | 0.61% | 0.31% | 0.31% | 0.38% | 0.08% |
| TOTAL | 100.00% | 100.00% | 100.00% | 100.00% | 100.00% | 100.00% | 100.00% | 100.00% | 100.00% |
| S&P Dow Jones Indices | | | | | | | | |||
| S&P 500 20 LARGEST Q3 2021 BUYBACKS, $ MILLIONS | | | | | | | | |||
| Company | Ticker | Sector | Q3 2021 | Q2 2021 | Q3 20220 | 12-Months | 12-Months | 5-Year | 10-Year | Indicated |
| | | | Buybacks | Buybacks | Buybacks | Sep,'21 | Sep,'20 | Buybacks | Buybacks | Dividend |
| | | | $ Million | $ Million | $ Million | $ Million | $ Million | $ Million | $ Million | $ Million |
| Apple | Information Technology | $20,449 | $25,595 | $17,587 | $92,527 | $75,992 | $348,272 | $487,642 | $15,312 | |
| Alphabet | GOOGL | Communication Services | $15,033 | $8,434 | $2,725 | $31,532 | $8,710 | $66,167 | $69,998 | $0 |
| Meta Platforms | FB | Communication Services | $12,610 | $12,796 | $7,897 | $44,705 | $29,343 | $100,267 | $105,740 | $0 |
| Oracle | ORCL | Information Technology | $9,914 | $4,209 | $114 | $17,856 | $14,510 | $87,000 | $98,051 | $8,032 |
| Microsoft | MSFT | Information Technology | $8,815 | $8,045 | $5,423 | $24,992 | $19,809 | $100,488 | $147,180 | $6,057 |
| JPMorgan Chase | JPM | Financials | $7,684 | $7,177 | $6,743 | $28,326 | $24,799 | $95,727 | $146,272 | $18,637 |
| Berkshire Hathaway | BRK.B | Financials | $7,632 | $5,980 | $8,973 | $29,186 | $17,755 | $51,094 | $51,161 | $0 |
| Bank of America | BAC | Financials | $5,318 | $1,593 | $9 | $7,746 | $11,124 | $69,626 | $104,233 | $3,285 |
| Charter Communications | CHTR | Communication Services | $5,286 | $6,194 | $0 | $16,286 | $13,268 | $84,448 | $108,960 | $11,953 |
| Union Pacific | UNP | Industrials | $3,666 | $3,516 | $3,361 | $15,183 | $9,173 | $46,152 | $47,093 | $0 |
| Lowe's | LOW | Consumer Discretionary | $3,628 | $3,018 | $30 | $9,278 | $3,347 | $27,955 | $36,004 | $6,386 |
| Home Depot, | HD | Consumer Discretionary | $3,469 | $3,117 | $0 | $10,374 | $3,847 | $38,438 | $69,917 | $7,018 |
| Morgan Stanley | MS | Financials | $3,284 | $884 | $1 | $4,684 | $2,248 | $17,436 | $38,132 | $1,687 |
| Procter & Gamble | PG | Consumer Staples | $3,071 | $2,912 | $1 | $7,779 | $3,333 | $53,366 | $67,956 | $4,135 |
| Citigroup | C | Financials | $2,969 | $2,202 | $1,544 | $8,820 | $8,274 | $40,065 | $60,675 | $2,531 |
| Walmart | WMT | Consumer Staples | $2,825 | $3,136 | $562 | $12,442 | $2,192 | $25,053 | $44,543 | $2,262 |
| HCA Healthcare | HCA | Health Care | $2,750 | $3,000 | $2,000 | $11,759 | $6,405 | $35,872 | $58,385 | $8,447 |
| Visa | V | Information Technology | $2,710 | $1,668 | $2 | $4,956 | $388 | $9,272 | $17,628 | $1,071 |
| Chubb | CB | Financials | $2,611 | $916 | $1,028 | $8,011 | $2,799 | $15,417 | $19,050 | $1,360 |
| Mastercard | MA | Information Technology | $2,596 | $163 | $7 | $3,105 | $245 | $4,235 | $5,414 | $1,485 |
| Top 20 | | | $126,320 | $104,555 | $58,007 | $389,547 | $257,561 | $1,316,350 | $1,784,034 | $99,658 |
| S&P 500 | | | $234,640 | $198,843 | $101,786 | $742,209 | $570,753 | $3,321,214 | $5,809,820 | $568,697 |
| Top 20 % of S&P 500 | | | 53.84% | 52.58% | 56.99% | 52.48% | 45.13% | 39.63% | 30.71% | 17.52% |
| Gross values are not adjusted for float | | | | | | | | | ||
| S&P Dow Jones Indices | | | |
| S&P 500 Q3 2021 Buyback Report | | | |
| | | | |
| SECTOR | DIVIDEND | BUYBACK | COMBINED |
| | YIELD | YIELD | YIELD |
| Consumer Discretionary | 0.62% | 1.25% | 1.87% |
| Consumer Staples | 3.18% | 1.58% | 4.76% |
| Energy | 4.15% | 0.49% | 4.64% |
| Financials | 1.98% | 3.54% | 5.52% |
| HealthCare | 1.56% | 1.35% | 2.92% |
| Industrials | 1.50% | 1.69% | 3.18% |
| Information Technology | 0.83% | 2.05% | 2.88% |
| Materials | 1.84% | 1.64% | 3.48% |
| Real Estate | 2.48% | 0.13% | 2.60% |
| Communications Services | 1.04% | 3.11% | 4.15% |
| Utilities | 3.06% | 0.13% | 3.19% |
| S&P 500 | 1.45% | 1.90% | 3.35% |
| Uses full values (unadjusted for float) | | | |
| Dividends based on indicated; buybacks based on the last 12-months ending Q3,'21 | |||
| Share Count Changes | | |
| (Y/Y diluted shares used for EPS) | >=4% |
|
| Q3 2021 | 10.22% | 7.41% |
| Q2 2021 | 11.02% | 5.41% |
| Q1 2021 | 10.40% | 5.80% |
| Q4 2020 | 9.02% | 6.01% |
| Q3 2020 | 8.62% | 9.62% |
| Q2 2020 | 8.60% | 17.80% |
| Q1 2020 | 8.00% | 19.60% |
| Q4 2019 | 7.63% | 20.68% |
| Q3 2019 | 8.62% | 22.85% |
| Q2 2019 | 7.98% | 24.15% |
| Q1 2019 | 8.03% | 24.90% |
| Q4 2018 | 8.45% | 18.71% |
| Q3 2018 | 6.43% | 17.67% |
ABOUT S&P DOW JONES INDICES
S&P Dow Jones Indices is the largest global resource for essential index-based concepts, data and research, and home to iconic financial market indicators, such as the S&P 500® and the Dow Jones Industrial Average®. More assets are invested in products based on our indices than products based on indices from any other provider in the world. Since Charles Dow invented the first index in 1884, S&P DJI has been innovating and developing indices across the spectrum of asset classes helping to define the way investors measure and trade the markets.
S&P Dow Jones Indices is a division of S&P Global (NYSE: SPGI), which provides essential intelligence for individuals, companies, and governments to make decisions with confidence. For more information, visit: www.spdji.com .
![]()
SOURCE S&P Dow Jones Indices