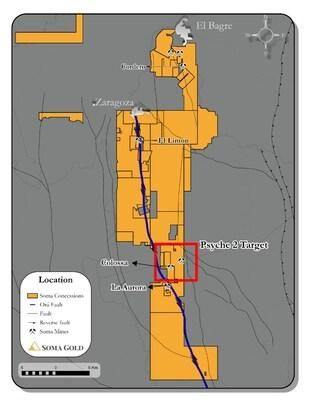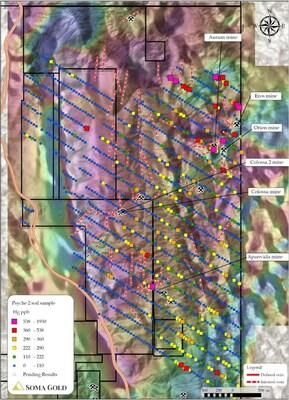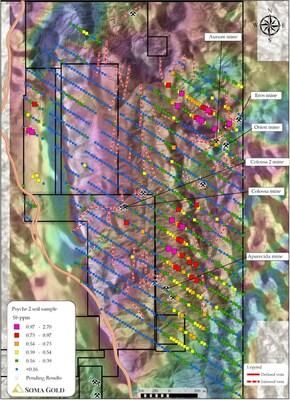
Soma Gold Corp. (TSXV: SOMA,OTC:SMAGF) (WKN: A2P4DU) (OTC: SMAGF) (the "Company" or "Soma") is pleased to provide an update on the ongoing soil sampling program at its Psyche 2 target area within the Machuca Project in Antioquia, Colombia (Figure 1). Psyche 2 was initially identified through high-grade stream sediment samples and the presence of informal, small-scale mines (see news release dated October 24, 2024). The Company has since expanded the soil sampling program northward along a prominent, linear, north-south-trending magnetic high that coincides with a recently identified copper-in-soil anomaly (see news release dated May 6, 2025). This release presents results from an additional 510 soil samples.
Soil Sampling
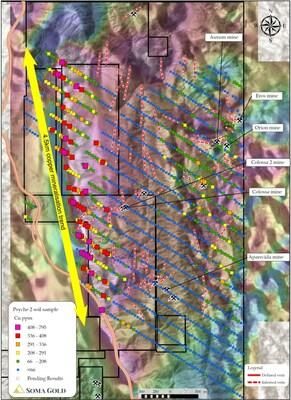
An additional 510 samples, bringing the total to 1,394, were collected to extend the Psyche 2 soil grid completed in early 2025. The samples were collected at 50 m intervals along lines spaced 200 m apart, covering the entire strike extent of a north-south trending magnetic anomaly. Fire assay results and multi-element geochemistry have been received for 1,291 samples, with multi-element results pending for the remaining 103. The previously discovered high copper-in-soil values extended over the entire length of the magnetic anomaly, adding 2.5 km of strike length to the copper anomaly for a total strike length of approximately 4.5 km (Figure 2). The average width of the anomaly is 325 m.
Copper concentrations range from 2.5 ppm to 795 ppm. The 97.5th percentile values range from 336 ppm to 795 ppm, while the 95th and 90th percentile values are 291 ppm and 212 ppm, respectively. Table 1 presents the 95th percentile copper values and highlights a relationship between weakly anomalous gold and zinc values. Highly anomalous gold and zinc soil samples occur in clusters along the trend of the magnetic anomaly.
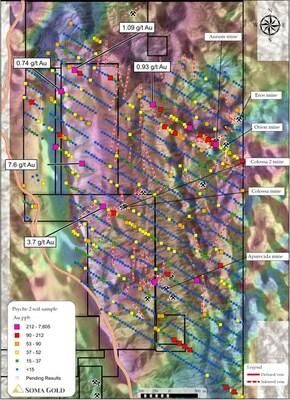
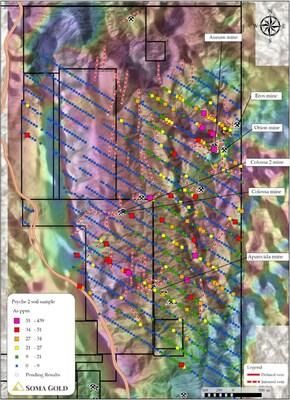
Gold concentrations in the soil samples range from <5 ppb to 7,605 ppb (i.e., 7.6 g/t Au). The 97.5th percentile values, ranging from 90 ppb to 7,605 ppb, are considered strongly anomalous. The 95th and 90th percentile gold values are 55 ppb and 37 ppb, respectively. The 97.5th percentile values commonly correlate spatially with known high-grade quartz veins in surface outcrop or informal mines and are interpreted to reflect the presence of gold-bearing quartz veins. Lower, yet still elevated, gold-in-soil values along the strike of the known quartz veins are interpreted as evidence of the continuity of these gold-bearing structures. Table 2 presents the 97.5th percentile soil sample results across the grid.
Chris Buchanan, Soma's Vice President of Exploration, stated, "Discovering the continuation of the copper anomaly to the north of the Rio Pocune is an important development for the Psyche 2 target. Our team has been mapping and prospecting to determine the geological nature of this significant soil anomaly. We are looking forward to initiating the maiden diamond drill program further to investigate the underlying geology of the soil anomaly."
Figure 2 displays the copper-in-soil values superimposed on the first vertical derivative map of the recently flown magnetic survey (see news release dated February 6, 2025). The 95th percentile copper values are clustered along the western edge of the soil grid, forming a north-south trending anomaly with a strike length of approximately 4.5 kilometres. This anomaly is located near the Otú Fault and is interpreted to be controlled by associated higher-order structures. The anomalous copper samples also coincide with a prominent magnetic high. The cause of the magnetic high is currently unknown, and geological mapping is underway along the entire length of the anomaly to determine the nature of the underlying bedrock. However, mapping is hampered by poor exposure due to dense vegetation and thick saprolite cover.
Table 1: 97.5th percentile values of Cu in soil samples
| Sample No. | Au (ppb) | Au (g/t) | Ag (ppb) | Ag (g/t) | As (ppm) | Cu (ppm) | Zn (ppm) | Ni (ppm) | Co (ppm) |
| SS13341 | 24 | 0.024 | 100 | 0.1 | 6.6 | 795 | 71.8 | 48.7 | 26.4 |
| SS13348 | 25 | 0.025 | 480 | 0.48 | 0.7 | 643 | 90.4 | 103 | 143 |
| SS12220 | 7 | 0.007 | 100 | 0.1 | 0.9 | 578 | 142 | 110 | 56.2 |
| SS10980 | 25 | 0.025 | 300 | 0.3 | 1.9 | 576 | 192 | 114 | 105 |
| SS10959 | 42 | 0.042 | 380 | 0.38 | 0.3 | 506 | 79.4 | 85.4 | 75.6 |
| SS15082 | 28 | 0.028 | 100 | 0.1 | 0.6 | 502 | 104 | 65.6 | 81 |
| SS13052 | 9 | 0.009 | 100 | 0.1 | 0.05 | 494 | 98.6 | 96.2 | 74.1 |
| SS12462 | 18 | 0.018 | 1140 | 1.14 | 0.6 | 472 | 124 | 239 | 74.9 |
| SS10954 | 58 | 0.058 | 100 | 0.1 | 0.2 | 455 | 123 | 93.8 | 36 |
| SS13350 | 68 | 0.068 | 740 | 0.74 | 2.7 | 451 | 128 | 82.6 | 75.6 |
| SS10978 | 24 | 0.024 | 100 | 0.1 | 0.05 | 443 | 98.9 | 84.4 | 55.7 |
| SS15081 | 24 | 0.024 | 100 | 0.1 | 0.2 | 422 | 130 | 87.2 | 87.1 |
| SS15036 | 11 | 0.011 | 500 | 0.5 | 0.4 | 414 | 107 | 74.1 | 94.6 |
| SS11465 | 20 | 0.02 | 100 | 0.1 | 4.2 | 410 | 105 | 85.6 | 60.7 |
| SS12048 | 27 | 0.027 | 380 | 0.38 | 1.8 | 407 | 151 | 173 | 72 |
| SS10979 | 21 | 0.021 | 290 | 0.29 | 0.05 | 405 | 126 | 87.7 | 67.1 |
| SS13386 | 16 | 0.016 | 460 | 0.46 | 2.3 | 405 | 73.6 | 68.4 | 20.3 |
| SS12187 | 6 | 0.006 | 100 | 0.1 | 1.7 | 404 | 97.3 | 50.8 | 60.6 |
| SS11997 | 9 | 0.009 | 250 | 0.25 | 11 | 400 | 38.5 | 38.1 | 15.1 |
| SS13381 | 8 | 0.008 | 320 | 0.32 | 1.4 | 396 | 155 | 554 | 226 |
| SS12451 | 41 | 0.041 | 500 | 0.5 | 1.3 | 391 | 145 | 67.7 | 100 |
| SS10958 | 29 | 0.029 | 100 | 0.1 | 0.1 | 388 | 87.3 | 93.1 | 95.2 |
| SS12463 | 19 | 0.019 | 660 | 0.66 | 1.8 | 387 | 49.8 | 122 | 53.8 |
| SS15008 | 45 | 0.045 | 750 | 0.75 | 1.8 | 386 | 56 | 82 | 48.4 |
| SS12054 | 30 | 0.03 | 100 | 0.1 | 0.05 | 379 | 161 | 68.9 | 65.6 |
| SS15077 | 56 | 0.056 | 290 | 0.29 | 2.5 | 375 | 24.2 | 43.5 | 47.5 |
| SS12057 | 8 | 0.008 | 310 | 0.31 | 4.3 | 375 | 189 | 129 | 67.4 |
| SS12186 | 9 | 0.009 | 100 | 0.1 | 1.8 | 372 | 83.4 | 61.4 | 53.3 |
| SS12184 | 10 | 0.01 | 100 | 0.1 | 1.8 | 367 | 94.7 | 71.1 | 122 |
| SS10951 | 43 | 0.043 | 590 | 0.59 | 0.9 | 362 | 84.2 | 117 | 101 |
| SS11430 | 12 | 0.012 | 620 | 0.62 | 2.9 | 357 | 102 | 74.4 | 51.1 |
| SS11856 | 10 | 0.01 | 100 | 0.1 | 0.4 | 356 | 108 | 153 | 48.6 |
| SS12452 | 29 | 0.029 | 530 | 0.53 | 0.2 | 355 | 66.3 | 89.9 | 165 |
| SS13380 | 22 | 0.022 | 280 | 0.28 | 1.1 | 351 | 82.7 | 79.4 | 40.6 |
| SS12217 | 21 | 0.021 | 790 | 0.79 | 0.05 | 344 | 176 | 97.2 | 43.2 |
| SS15006 | 24 | 0.024 | 420 | 0.42 | 1.4 | 340 | 129 | 57.6 | 72.5 |
| SS12421 | 13 | 0.013 | 240 | 0.24 | 0.5 | 340 | 119 | 94.6 | 64.9 |
| SS12189 | 12 | 0.012 | 210 | 0.21 | 1.3 | 339 | 83.7 | 41.9 | 39.5 |
| SS12503 | 17 | 0.017 | 580 | 0.58 | 0.7 | 337 | 93.6 | 83.4 | 44.5 |
| SS12183 | 15 | 0.015 | 100 | 0.1 | 2.4 | 336 | 49.5 | 46.2 | 32 |
Figure 3 displays the gold-in-soil values superimposed on the first vertical derivative map of the magnetic survey. Solid and dashed red lines indicate the mapped and interpreted vein traces in the area. All identified informal mines coincide with gold-in-soil anomalies. The strike length of these gold anomalies and associated quartz veins ranges from 300 to 1,000 meters. These findings are considered significant and warrant follow-up prospecting, infill soil sampling, and drilling near the informal mines.
Table 2: 97.5th percentile values of Au in soil samples
| Sample No. | Au (ppb) | Au (g/t) | Ag (ppb) | Ag (g/t) | As (ppm) | Cu (ppm) | Zn (ppm) | Ni (ppm) | Co (ppm) |
| SS13340 | 7605 | 7.61 | 100 | 0.1 | 1.8 | 150 | 40.8 | 38.3 | 27.5 |
| SS12040 | 3700 | 3.7 | 450 | 0.45 | 8.7 | 38 | 19.7 | 13.5 | 6.5 |
| SS13398 | 1086 | 1.09 | 1020 | 1.02 | 20.5 | 272 | 116 | 85 | 9.7 |
| SS13114 | 932 | 0.93 | 470 | 0.47 | 9.9 | 29.3 | 30.4 | 12.7 | 2.2 |
| SS15050 | 741 | 0.74 | 410 | 0.41 | 2.1 | 80.6 | 47.3 | 36.3 | 16.8 |
| SS11929 | 488 | 0.49 | 280 | 0.28 | 15.7 | 21.3 | 14.8 | 7.7 | 0.7 |
| SS13097 | 465 | 0.47 | 330 | 0.33 | 4.8 | 103 | 151 | 30.1 | 33.4 |
| SS13087 | 389 | 0.39 | 450 | 0.45 | 71.7 | 109 | 60 | 10.7 | 1.6 |
| SS13358 | 332 | 0.33 | 560 | 0.56 | 3 | 299 | 165 | 664 | 138 |
| SS11785 | 311 | 0.31 | 100 | 0.1 | 9.4 | 63.6 | 94.8 | 61.6 | 20.3 |
| SS12387 | 263 | 0.26 | 820 | 0.82 | 17.7 | 33.7 | 108 | 18.8 | 11.9 |
| SS13075 | 263 | 0.26 | 1140 | 1.14 | 22.1 | 51.1 | 62.8 | 9.5 | 1.2 |
| SS13088 | 257 | 0.26 | 290 | 0.29 | 21.1 | 70.3 | 55.2 | 18.1 | 5.5 |
| SS12399 | 221 | 0.22 | 530 | 0.53 | 11.1 | 24.4 | 70.2 | 14.9 | 1 |
| SS15096 | 214 | 0.21 | 370 | 0.37 | pending | pending | pending | pending | pending |
| SS11497 | 195 | 0.2 | 500 | 0.5 | 11.4 | 29.7 | 45.9 | 11.9 | 2 |
| SS13092 | 186 | 0.19 | 2800 | 2.8 | 37.3 | 51.5 | 55.7 | 13.8 | 16.6 |
| SS12388 | 170 | 0.17 | 570 | 0.57 | 24.4 | 38.8 | 104 | 17.6 | 2.5 |
| SS12395 | 163 | 0.16 | 610 | 0.61 | 10.6 | 25.1 | 84.2 | 18.2 | 1.4 |
| SS12389 | 150 | 0.15 | 510 | 0.51 | 19.4 | 27.2 | 89 | 14.4 | 9.9 |
| SS13399 | 146 | 0.15 | 100 | 0.1 | 1.5 | 294 | 30.6 | 33.8 | 3.4 |
| SS13072 | 137 | 0.14 | 790 | 0.79 | 24.3 | 116 | 114 | 52 | 19.6 |
| SS13110 | 129 | 0.13 | 630 | 0.63 | 12 | 44.2 | 28.4 | 14.4 | 1.2 |
| SS12390 | 121 | 0.12 | 540 | 0.54 | 13.3 | 31.3 | 108 | 43.4 | 18.6 |
| SS12035 | 121 | 0.12 | 390 | 0.39 | 4.3 | 56.7 | 75.1 | 8.8 | 5.4 |
| SS13067 | 112 | 0.11 | 640 | 0.64 | 8.5 | 133 | 65.6 | 61.5 | 79 |
| SS12347 | 108 | 0.11 | 730 | 0.73 | 8.4 | 238 | 112 | 76.9 | 81.5 |
| SS13352 | 104 | 0.1 | 340 | 0.34 | 0.8 | 184 | 59.4 | 45 | 65.4 |
| SS12427 | 101 | 0.1 | 540 | 0.54 | 12.9 | 27.2 | 89.4 | 18.7 | 14.4 |
| SS13089 | 101 | 0.1 | 240 | 0.24 | 20.2 | 59.8 | 75 | 21.6 | 3 |
| SS11918 | 100 | 0.1 | 590 | 0.59 | 14.6 | 44.5 | 53.4 | 18.9 | 8.7 |
| SS12253 | 96 | 0.1 | 220 | 0.22 | 3.8 | 45.5 | 31.4 | 13.3 | 2.8 |
| SS12036 | 91 | 0.09 | 310 | 0.31 | 7.9 | 71 | 84.8 | 73.1 | 15.6 |
| SS13120 | 91 | 0.09 | 940 | 0.94 | 33.5 | 34.7 | 48.5 | 38.2 | 10 |
| SS13397 | 91 | 0.09 | 390 | 0.39 | 5.2 | 179 | 45.7 | 10.4 | 3.6 |
| SS13402 | 90 | 0.09 | 720 | 0.72 | 12 | 12.8 | 102 | 91.7 | 10.7 |
| SS12492 | 88 | 0.09 | 600 | 0.6 | pending | pending | pending | pending | pending |
| SS12026 | 87 | 0.09 | 450 | 0.45 | 7.3 | 42.2 | 28.2 | 11.7 | 1.8 |
| SS12484 | 86 | 0.09 | 410 | 0.41 | pending | pending | pending | pending | pending |
| SS13090 | 85 | 0.09 | 390 | 0.39 | 25.5 | 70.4 | 60.3 | 18.8 | 16.7 |
| SS12070 | 82 | 0.08 | 280 | 0.28 | 19.6 | 107 | 116 | 28.8 | 5.4 |
| SS13065 | 77 | 0.08 | 510 | 0.51 | 2.6 | 128 | 53.9 | 52.3 | 40.5 |
| SS13138 | 76 | 0.08 | 250 | 0.25 | 17.3 | 35.5 | 60.3 | 31.5 | 44.3 |
| SS13009 | 76 | 0.08 | 230 | 0.23 | 11.6 | 63.9 | 53.3 | 26.7 | 20.3 |
| SS13066 | 76 | 0.08 | 740 | 0.74 | 7.5 | 101 | 41.1 | 13.2 | 13.2 |
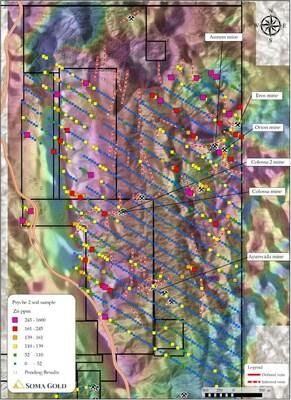
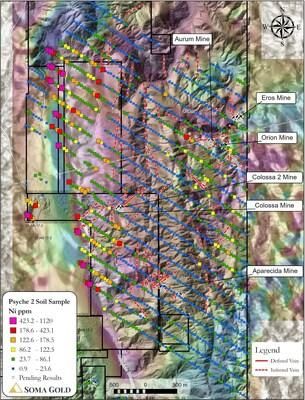
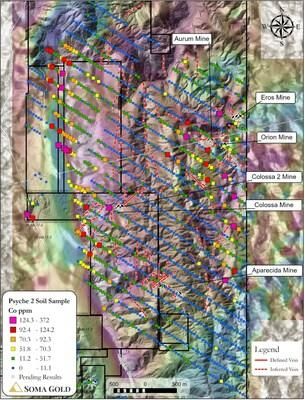
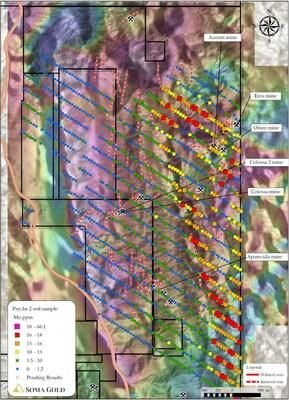
Figure 4 presents the zinc (Zn) values, which form a distinct trend that is coincident with the copper and gold anomalies along the western edge of the soil grid. Figures 5 and 6 display the anomalous values for nickel (Ni) and cobalt (Co), which are also coincident with the Cu and Zn anomalies along the magnetic high. Additional elements commonly used as indicators of gold mineralization systems are also present in the area, forming distinct trends associated with gold anomalies. On the eastern side of the soil grid, several elements are strongly anomalous, including arsenic (As), molybdenum (Mo), mercury (Hg), and antimony (Sb) (see figures 7-10). The most anomalous samples are generally coincident with the gold anomalies and known high-grade gold-bearing quartz veins.
Soil sampling has successfully identified numerous gold anomalies at the Psyche 2 target. The extent and tenor of the copper anomaly represent an exciting new exploration target in the region. A drilling campaign in late 2025 will determine the geology of the host rocks and the style of potential copper mineralization. The copper anomaly remains open to the north and south along portions of the magnetic high that have not yet been soil sampled. Soma will continue expanding the soil grid to define the full extent of the copper and gold anomalies. Drilling operations will also continue at the high-grade gold targets near the Colossa Mine and the Aurum-Orion-Eros area while the Company awaits approval of drilling permits for the copper anomaly.
The Psyche 2 gold target area is a 2.4 km long, northeast-southwest-striking trend of mineralized quartz veins, with a width of approximately 300-400 m. The target is located east of the Otú Fault, in a region predominantly underlain by undifferentiated upper-greenschist-facies metasedimentary rocks (Figure 2). The rocks are strongly folded, exhibiting north-south-trending axial planes and moderately northeast-plunging fold axes. However, the fold system is only exposed in a few small creek outcrops and remains poorly constrained. The far eastern edge of the property is also poorly exposed, but underlain by a strong regional magnetic signature like the magnetic signature of the Segovia Batholith and is interpreted to demarcate the western contact of the batholith in this area.
Unlike other quartz veins and informal mines along the Otú Fault, these veins have an average orientation of 240o/43o, forming a high angle relative to the northerly trending Otú Fault and are similar to the orientation of Aris Mining's (TSX:ARIS) El Silencio vein in Segovia. The quartz vein orientation also aligns with a regional lineament trend, suggesting the potential for additional quartz vein-bearing structures along the same trend. Mapping within informal mines has identified two additional sets of mineralized quartz vein orientations: east-northeast- and north-striking. In general, the veins dip moderately to the northwest.
The Otú fault system ("Otú Fault") extends for over 100 km, from Segovia-Remedios in the south to Nechi in the north, where it is buried beneath younger sedimentary overlap sequences. Soma's tenements now cover more than 56 km of this strike length. High-grade gold deposits have been identified along the entire length of the Otú Fault, hosted in brittle-ductile to brittle quartz veins formed during later deformation stages. Throughout the district, quartz veins show orientation patterns consistent with formation in conjugate faults associated with brittle faulting along the Otú Fault. Notable mines along this trend include Segovia-Remedios, La Aurora, El Limon, Le Ye, Los Mangos, and Cordero. The Machuca Property is located along a key segment of this regional fault system and shows numerous signs of high-grade gold mineralization.
Soil sampling and QA/QC protocols
Soil samples are collected on a predetermined grid, typically with 50m spacing along 200 m-spaced lines. The sampler digs a pit to expose the C-horizon of the local soil profile. A 2.0 kg sample is extracted from the C-horizon and submitted to the laboratory for analysis. Additional information regarding the stratigraphy of the soil profile, depth of the C-horizon, and a description of the sampled material is recorded by the sampler.
All soil samples for Soma Gold are submitted to ActLabs Medellin for sample preparation and analysis. All samples are dried and sieved prior to analysis at the lab. A 50-gram aliquot fire assay with an atomic absorption finish determines gold and silver values. An aqua regia digestion and ICP-MS analysis is used to determine the concentration of a 36-element package.
QA/QC is monitored using field duplicates, blank material, and certified standard material (CRM). The CRM is purchased from OREAS.
Qualified Person Statement
Mr. Chris Buchanan, P.Geo, is Soma's Vice-President of Exploration and a Qualified Person as defined by National Instrument 43-101. Mr. Buchanan has reviewed the technical information disclosed in this press release.
ABOUT SOMA GOLD
Soma Gold Corp. (TSXV: SOMA,OTC:SMAGF) is a mining company focused on gold production and exploration. The Company owns two adjacent mining properties in Antioquia, Colombia with a combined milling capacity of 675 tpd. (Permitted for 1,400 tpd). The El Bagre Mill is currently operating and producing. Internally generated funds are being used to finance a regional exploration program.
With a solid commitment to sustainability and community engagement, Soma Gold Corp. is dedicated to achieving excellence in all aspects of its operations.
The Company also owns an exploration property near Tucuma, Para State, Brazil that is currently under option to Ero Copper Corp.
On behalf of the Board of Directors
"Geoff Hampson"
Chief Executive Officer and Chairman
Neither the TSX Venture Exchange nor its Regulation Services Provider (as that term is defined in the policies of the TSX Venture Exchange) accepts responsibility for the adequacy or accuracy of this release.
All statements, analysis and other information contained in this press release about anticipated future events or results constitute forward-looking statements. Forward-looking statements are often, but not always, identified by the use of words such as "seek", "anticipate", "believe", "plan", "estimate", "expect" and "intend" and statements that an event or result "may", "will", "should", "could" or "might" occur or be achieved and other similar expressions. Forward-looking statements are subject to business and economic risks and uncertainties and other factors that could cause actual results of operations to differ materially from those contained in the forward-looking statements. Forward-looking statements are based on estimates and opinions of management at the date the statements are made. The Company does not undertake any obligation to update forward-looking statements even if circumstances or management's estimates or opinions should change except as required by applicable laws. Investors should not place undue reliance on forward-looking statements.
SOURCE Soma Gold Corp.

![]() View original content to download multimedia: http://www.newswire.ca/en/releases/archive/November2025/18/c8998.html
View original content to download multimedia: http://www.newswire.ca/en/releases/archive/November2025/18/c8998.html
