(TheNewswire)
NOT FOR DISTRIBUTION TO U.S. NEWSWIRE SERVICES OR FOR RELEASE, PUBLICATION,
DISTRIBUTION OR DISSEMINATION, DIRECTLY OR INDIRECTLY, IN WHOLE OR IN PART,
IN OR INTO THE UNITED STATES.
Siren Gold Limited (ASX: SNG) (Siren or the Company) is pleased to announce a JORC (2012) Mineral Resource Estimate (MRE) for the Supreme Gold Project in Reefton, New Zealand.
Highlights
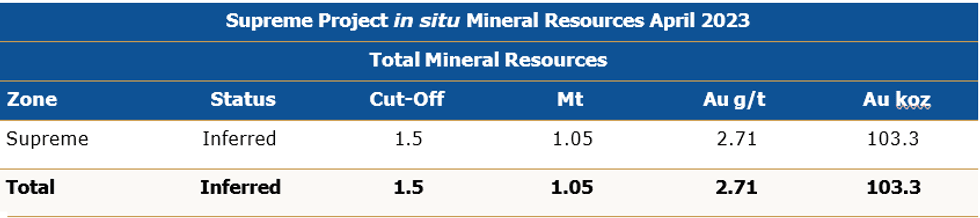
Table 1. Supreme Mineral Resource Estimate at a 1.5g/t Au cut-off.
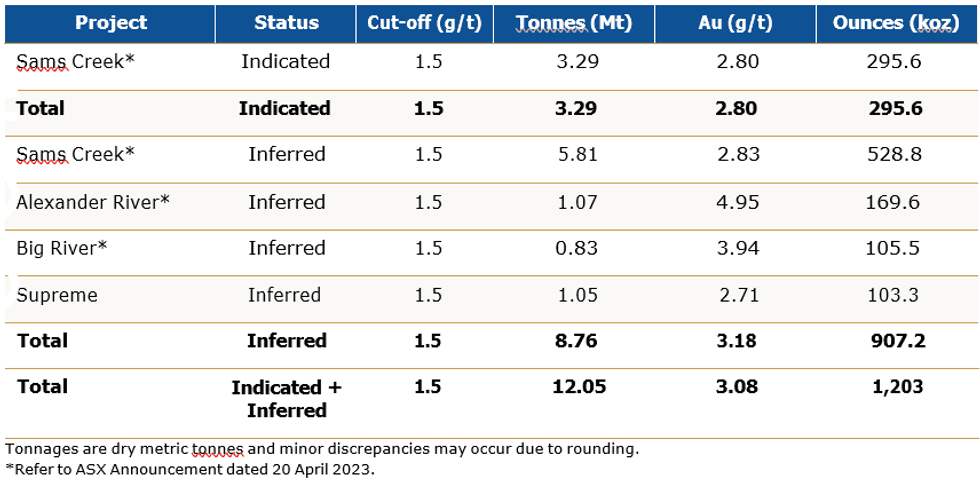
Table 2. Global Resource Estimate at a 1.5g/t Au cut-off (100% basis)
Background
The Cumberland permit comprises the northern and southern areas of the previous Globe Progress mining permit, as shown in Figure 1. The Cumberland permit joins Siren’s Big River, Golden Point and Reefton South permits and abuts the Federation Mining permit, where they are currently developing the Snowy River underground mine to extract around 700koz of gold below the historic Blackwater mine.
Gold bearing reefs in the Cumberland project area were first discovered at Supreme in 1872 and mining proceeded from then until 1923 when Sir Francis Drake mine closed. Relative to the rest of the Reefton Goldfield, the historical Cumberland mines were undercapitalised, with a total production of 44,626 oz of gold from 97,993 tonnes of ore at an average grade of 14.2 g/t Au.
The mineralisation in the Cumberland permit extends for 3kms south of the Globe Progress mine and is open to the west (under cover) and south (Figure 2). This area lies along the main structural corridor that hosts all the larger mines in the Reefton Goldfield and links to Siren’s very promising Auld Creek Au-Sb prospect. The gold and antimony mineralisation extends for 10kms from Auld Creek south into the Globe Progress Mine, including the Globe Deeps area below the open pit, through Souvenir, Supreme and Big River. A total of 77 drillholes for a total of 10,933m have been completed.
Supreme’s gold mineralisation is a similar style to the Globe-Progress deposit, with high-grade quartz breccia, pug and disseminated sulphides. The Supreme prospect contains three sub-parallel mineralised shoots that have been traced down dip for approximately 200m and are open at depth (Figure 3). The shoots plunge moderately to the SE, with an average thickness of approximately 12m. Significant intersections include 10m @ 3.5g/t Au and 14m @ 3.5g/t Au (RDD013), 14m @ 3.2g/t Au (RDD017), 29m @ 2.6g/t Au (RDD018), 9.5m @ 2.3g/t Au (RDD021) and 9.5m @ 4.1g/t Au (RDD025).
The Gallant prospect contains a shear hosted, 1m-5m thick quartz vein, that extends for over 300m and dips steeply east and west. Diamond hole GLA001 was drilled to the west and appears to have drilled obliquely down a steeply west dipping reef. The hole intersected a 27m mineralised zone dominated by a quartz reef with visible gold and disseminated arsenopyrite mineralisation in the hangingwall. The true thickness of the mineralised zone is unclear but estimated to be around 5m. The average down- hole grade of the mineralised zone was 27m @ 74.9g/t Au, which includes 1m @ 1,911g/t Au. Detailed soil sampling and trenching will be utilised in Quarter 2 to try and expose the Galant Reef to determine its orientation and true thickness.
(TheNewswire)
NOT FOR DISTRIBUTION TO U.S. NEWSWIRE SERVICES OR FOR RELEASE, PUBLICATION,
DISTRIBUTION OR DISSEMINATION, DIRECTLY OR INDIRECTLY, IN WHOLE OR IN PART,
IN OR INTO THE UNITED STATES.
Vancouver, British Columbia, Canada September 27, 2024 TheNewswire JZR Gold Inc. (the " Company " or " JZR ") ( TSX-V: JZR ) is pleased to announce that it intends to undertake a non-brokered private placement offering (the " Offering ") of up to 5,000,000 units (each, a " Unit ") at a price of $0.15 per Unit, to raise aggregate gross proceeds of up to $750,000. Each Unit will be comprised of one common share (each, a " Share ") and one share purchase warrant (each, a " Warrant "). Each Warrant will entitle the holder to acquire one additional common share (each, a " Warrant Share ") in the capital of the Company at an exercise price of $0.20 per Warrant Share for a period of thirty-six (36) months after the closing of the Offering.
The Units will be offered pursuant to available prospectus exemptions set out under applicable securities laws and instruments, including National Instrument 45-106 – Prospectus Exemptions. The Offering will also be made available to existing shareholders of the Company who, as of the close of business on September 24, 2024, held common shares (and who continue to hold such common shares as of the closing date), pursuant to the existing shareholder exemption set out in BC Instrument 45-534 Exemption From Prospectus Requirement for Certain Trades to Existing Security Holders (the " Existing Securityholder Exemption ") . The Existing Securityholder Exemption limits a shareholder to a maximum investment of CAD$15,000 in a 12-month period unless the shareholder has obtained advice regarding the suitability of the investment and, if the shareholder is resident in a jurisdiction of Canada, that advice has been obtained from a person that is registered as an investment dealer in the jurisdiction. If the Company receives subscriptions from investors relying on the Existing Shareholder Exemption which exceeds the maximum amount of the Offering, the Company intends to adjust the subscriptions received on a pro-rata basis.
Certain Insiders (as such term is defined under the policies of the TSX Venture Exchange (the " Exchange ")) of the Company may participate in the Offering. Any participation of Insiders in the Offering will constitute a "related party transaction" within the meaning of Multilateral Instrument 61-101 – Protection of Minority Security Holders in Special Transactions (" MI 61-101 "). The Company intends to rely on exemptions from the formal valuation and minority shareholder approval requirements provided under subsections 5.5(a) and 5.7(a) of MI 61-101 on the basis that participation in the Offering by Insiders will not exceed 25% of the fair market value of the Company's market capitalization.
The Offering may close in one or more tranches, as subscriptions are received. The Securities will be subject to a hold period of four months and one day from the date of issuance. Closing of the Offering, which is expected to occur on or about October 4, 2024, will be subject to satisfaction of certain conditions, including, but not limited to, the receipt of all necessary regulatory and other approvals, including approval by the Exchange.
The Company intends to use the net proceeds from the Offering to prepare and commence operation of the gravimetric processing mill that was constructed on the Vila Nova gold project located in the state of Amapa, Brazil, and for general working capital purposes.
For further information, please contact:
Robert Klenk
Chief Executive Officer
rob@jazzresources.ca
Forward-Looking Statements
This news release contains forward-looking statements, which includes any information about activities, events or developments that the Company believes, expects or anticipates will or may occur in the future. Forward-looking statements in this news release include statements with respect to the details of the Offering, including the anticipated use of the net proceeds. Forward-looking information reflects the expectations or beliefs of management of the Company based on information currently available to it. Forward-looking information is subject to known and unknown risks, uncertainties and other factors that may cause the actual results, level of activity, performance or achievements of the Company to be materially different from those expressed or implied by such forward-looking information. These factors include, but are not limited to: risks associated with the business of the Company; business and economic conditions in the mineral exploration industry generally; the supply and demand for labour and other project inputs; changes in commodity prices; changes in interest and currency exchange rates; risks related to inaccurate geological and engineering assumptions; risks relating to unanticipated operational difficulties (including failure of equipment or processes to operate in accordance with the specifications or expectations, unavailability of materials and equipment, government action or delays in the receipt of government approvals, industrial disturbances or other job action and unanticipated events related to health, safety and environmental matters); risks related to adverse weather conditions; geopolitical risk and social unrest; changes in general economic conditions or conditions in the financial markets; and other risk factors as detailed from time to time in the Company's continuous disclosure documents filed with the Canadian securities regulators. The forward-looking information contained in this press release is expressly qualified in its entirety by this cautionary statement. The Company does not undertake to update any forward-looking information, except as required by applicable securities laws.
Neither the TSX Venture Exchange nor its regulation services provider (as that term is defined in the policies of the TSX Venture Exchange) accepts responsibility for the adequacy or accuracy of this press release.
None of the securities of JZR have been registered under the U.S. Securities Act of 1933, as amended (the "U.S. Securities Act"), or any state securities law, and may not be offered or sold in the United States or to, or for the account or benefit of, persons in the United States or "U.S. persons" (as such term is defined in Regulation S under the U.S. Securities Act) absent registration or an exemption from such registration requirements. This news release shall not constitute an offer to sell or the solicitation of an offer to buy in the United States nor shall there be any sale of the securities in any State in which such offer, solicitation or sale would be unlawful.
Copyright (c) 2024 TheNewswire - All rights reserved.
News Provided by TheNewsWire via QuoteMedia
Astral Resources (ASX:AAR) is funded through to a final investment decision thanks to "firm commitments" to raise approximately AU$25 million via a placement of new company shares.
The amount will be secured across two tranches, with Astral set to issue approximately 263 million new fully paid shares at AU$0.095 each. It has already raised AU$21 million via the first tranche.
The second tranche is subject to shareholder approval, and is anticipated to bring in about AU$4 million.
“Proceeds of the placement ensure that Astral is funded through to completion of the Mandilla PreFeasibility Study (PFS) and Definitive Feasibility Study (DFS),” Astral said in a Wednesday (September 25) press release.
The company specified that the funds will be used along with its current cash reserves to conduct various study and technical work streams related to the PFS and DFS. The proceeds will also go toward exploration, infill drilling and ongoing resource estimate updates for Mandilla, as well as the Feysville project.
“We are delighted with the strong support shown by both new and existing investors in the Placement,” said Astral Managing Director Marc Ducler in a statement from the company.
“The calibre of new investors we were able to attract and the quantum of funds we were able to raise is testament to the quality of the Mandilla Gold Project as one of Australia’s best near-term gold development stories.”
Both Mandilla and Feysville are located south of Kalgoorlie in Western Australia. Astral says that together the assets have consolidated resources of 1.38 million ounces of gold.
Don’t forget to follow us @INN_Australia for real-time news updates!
Securities Disclosure: I, Gabrielle de la Cruz, hold no direct investment interest in any company mentioned in this article.
Flynn Gold Limited (ASX: FG1, “Flynn” or “the Company”) is pleased to advise that it has been successful with two applications in Round 10 of the Tasmanian State Government’s Exploration Drilling Grant Initiative (EDGI).
The successful applications will support exploration drilling targeting new zones of gold mineralisation at the Company’s flagship Golden Ridge Project, located in north-east Tasmania (see Figure 1).
Commenting on the EDGI grants, Flynn Gold Managing Director & CEO, Neil Marston, said:
“We are delighted to have received such strong support from the Tasmanian State Government through these grants, which are designed to help uncover the next generation of mineral discoveries in Tasmania.
“Flynn will receive up to $140,000 in EDGI grant funds, allowing the Company to fast-track the next phase of drilling at our flagship Golden Ridge Project.
“One grant of $70,000 will co-fund drilling beneath the historical Golden Ridge Adit, where recent underground sampling of veins recorded results of up to 64g/t gold.
“The second $70,000 grant will co-fund a fence of drill-holes at the Link Zone, approximately 900 metres south-west of the Trafalgar Prospect, testing for western extensions to the high-grade gold mineralisation intersected in our earlier drilling.
“The Company expects to be able to commence drilling once grant documentation and drilling approvals are received.”
Click here for the full ASX Release
This article includes content from Flynn Gold, licensed for the purpose of publishing on Investing News Australia. This article does not constitute financial product advice. It is your responsibility to perform proper due diligence before acting upon any information provided here. Please refer to our full disclaimer here.
Speaking to the Investing News Network, Brien Lundin, editor of Gold Newsletter, gave his thoughts on gold's recent price activity, including which stocks are likely to provide the most torque on its move.
"The place to be right now I think for the most torque on this move in gold is really the silver junior mining stocks — the ones that have silver resources," he said during the interview. "I think they are going to take off like we saw in the spring of 2020, when we had a tremendous move in the silver miners. I think that's going to happen again."
Looking at the outlook for gold as it continues to make fresh all-time highs, Lundin gave a positive forecast.
"Gold is in a unique spot in that it will benefit no matter what happens," he explained.
"If there is a no landing — or a slow landing — and we are in an easier money environment and real interest rates are dropping, then gold and the metals and miners are going to do quite well and keep up with stocks I believe."
In Lundin's opinion, the yellow metal will also do well in a recession scenario. Whether or not that will happen remains to be seen — he currently places the odds of a recession at 40 to 50 percent.
He also shared details on the New Orleans Investment Conference, which will run from November 20 to 23. This year will be the 50th anniversary, and Lundin said his team will be pulling out all the stops — speakers will include Rick Rule, Jim Grant, Brent Johnson, Danielle DiMartino Booth, Lawrence Lepard, Peter Boockvar and many more.
Watch the interview above for more from Lundin, and click here to register for the event.
Don't forget to follow us @INN_Resource for real-time updates!
Securities Disclosure: I, Charlotte McLeod, hold no direct investment interest in any company mentioned in this article.
Editorial Disclosure: The Investing News Network does not guarantee the accuracy or thoroughness of the information reported in the interviews it conducts. The opinions expressed in these interviews do not reflect the opinions of the Investing News Network and do not constitute investment advice. All readers are encouraged to perform their own due diligence.
Affiliate Disclosure: The Investing News Network may earn commission from qualifying purchases or actions made through the links or advertisements on this page.
Gold has long been considered a store of wealth, and the gold price often makes its biggest gains during turbulent times as investors look for cover in this safe-haven asset.
The 21st century has so far been heavily marked by episodes of economic and sociopolitical upheaval. Uncertainty has pushed the precious metal to record highs as market participants seek its perceived security. And each time the gold price rises, there are calls for even higher record-breaking levels.
Gold market gurus from Lynette Zang to Chris Blasi to Jordan Roy-Byrne have shared eye-popping predictions on the gold price that would intrigue any investor — gold bug or not.
While some have posited that the gold price may break US$3,000 per ounce and carry on as high as US$4,000 or US$5,000, there are those with hopes that US$10,000 gold or even US$40,000 gold could become a reality.
These impressive price predictions have investors wondering, what was the highest gold price ever? Gold has set multiple fresh all-time highs (ATH) in 2024 alone, and we share the latest one and what has driven it to this level below. We also take a look at how the gold price has moved historically and what has driven its performance in recent years.
Before discovering what the highest gold price ever was, it’s worth looking at how the precious metal is traded. Knowing the mechanics behind gold's historical moves can help illuminate why and how its price changes.
Gold bullion is traded in dollars and cents per ounce, with activity taking place worldwide at all hours, resulting in a live price for the metal. Investors trade gold in major commodities markets such as New York, London, Tokyo and Hong Kong. London is seen as the center of physical precious metals trading, including for silver. The COMEX division of the New York Mercantile Exchange is home to most paper trading.
There are many popular ways to invest in gold. The first is through purchasing gold bullion products such as bullion bars, bullion coins and rounds. Physical gold is sold on the spot market, meaning that buyers pay a specific price per ounce for the metal and then have it delivered. In some parts of the world, such as India, buying gold in the form of jewelry is the largest and most traditional route to investing in gold.
Another path to gold investment is paper trading, which is done through the gold futures market. Participants enter into gold futures contracts for the delivery of gold in the future at an agreed-upon price. In such contracts, two positions can be taken: a long position under which delivery of the metal is accepted or a short position to provide delivery of the metal. Paper trading as a means to invest in gold can provide investors with the flexibility to liquidate assets that aren’t available to those who possess physical gold bullion.
One significant long-term advantage of trading in the paper market is that investors can benefit from gold’s safe-haven status without needing to store it. Furthermore, gold futures trading can offer more financial leverage in that it requires less capital than trading in the physical market.
Interestingly, investors can also purchase physical gold via the futures market, but the process is complicated and lengthy and comes with a large investment and additional costs.
Aside from those options, market participants can invest in gold through exchange-traded funds (ETFs). Investing in a gold ETF is similar to trading a gold stock on an exchange, and there are numerous gold ETF options to choose from. For instance, some ETFs focus solely on physical gold bullion, while others focus on gold futures contracts. Other gold ETFs center on gold-mining stocks or follow the gold spot price.
It is important to understand that you will not own any physical gold when investing in an ETF — in general, even a gold ETF that tracks physical gold cannot be redeemed for tangible metal.
With regards to the performance of gold versus trading stocks, gold has an interesting relationship with the stock market. The two often move in sync during “risk-on periods” when investors are bullish. On the flip side, they tend to become inversely correlated in times of volatility.
According to the World Gold Council, gold's ability to decouple from the stock market during periods of stress makes it “unique amongst most hedges in the marketplace.” It is often during these times that gold outperforms the stock market. For that reason, it is often used as a portfolio diversifier to hedge against uncertainty.
The gold price hit US$2,685.15, its all time highest price at the time of this writing, on September 26, 2024. What drove it to set this new ATH?
Market watchers expected the Fed to cut interest rates by a quarter point at their September meeting, but news on September 12 that the regulators were still deciding between the expected cut or a larger half-point cut led gold prices on a rally that carried through into the next day, bringing gold prices near US$2,600.
At the September 18 Fed meeting, the committee ultimately made the decision to cut rates by half a point, news that sent gold even higher. By Friday, September 20, it moved above US$2,600 and held above US$2,620.
The following week, gold continued to set new highs on a variety of factors, including further rate cut and economic data anticipation, the escalating conflict in the Middle East between Israel and Hezbollah and economic stimulus in China.
Going a bit further back, gold broke through the important psychological level of US$2,000 per ounce in late 2023 on rising expectations that the US Federal Reserve would begin to reverse course on interest rates, and set multiple new all time highs in 2024. Gold climbed throughout Q2 to over US$2,450 in May, and then moved to US$2,483.35 on July 17.
Gold climbed to over US$2,500 in mid-August on a weakening dollar, positive economic data and the news on August 16 that the Chinese government issued new gold import quotas to banks in the country following a two month pause.
Central bank gold buying has been one of the tailwinds for the gold price this year and China's central bank has been one of the strongest buyers. It climbed further the following week to its new all-time high.
Fears of a looming recession — or the strong belief that a recession is already here — are also highly supportive for gold heading as we head deeper into 2024. Read our in-depth breakdown of gold's recent price performance below.
Five year gold price chart, September 25, 2019, to September 26, 2024.
Chart via the Investing News Network.
Despite these recent runs, gold has seen its share of both peaks and troughs over the last decade. After remaining rangebound between US$1,100 and US$1,300 from 2014 to early 2019, gold pushed above US$1,500 in the second half of 2019 on a softer US dollar, rising geopolitical issues and a slowdown in economic growth.
Gold’s first breach of the significant US$2,000 price level in mid-2020 was due in large part to economic uncertainty caused by the COVID-19 pandemic. To break through that barrier and reach what was then a record high, the yellow metal added more than US$500, or 32 percent, to its value in the first eight months of 2020.
The gold price breached that level again in early 2022 as Russia's invasion of Ukraine collided with rising inflation around the world, increasing the allure of safe-haven assets and pulling the yellow metal up to a price of US$2,074.60 on March 8, 2022. However, it fell throughout the rest of 2022, dropping below US$1,650 in October.
Although it didn't quite reach the level of volatility as the previous year, the gold price experienced drastic price changes in 2023 on the back of banking instability, high interest rates and the breakout of war in the Middle East.
After central bank buying pushed the gold price up to the US$1,950.17 mark by the end of January, the US Federal Reserve’s 0.25 percent rate hike on February 1 sparked a retreat as the dollar and Treasury yields saw gains. The precious metal went on to fall to its lowest price level of the year at US$1,809.87 on February 23.
The banking crisis that hit the US in early March caused a domino effect through the global financial system and led to the mid-March collapse of Credit Suisse, Switzerland’s second-largest bank. The gold price jumped to US$1,989.13 by March 15. The continued fallout in the global banking system throughout the second quarter of the year allowed gold to break above US$2,000 on April 3, and go on to flirt with a near-record high of US$2,049.92 on May 3.
Those gains were tempered by the Fed’s ongoing rate hikes and improvements in the banking sector, resulting in a downward trend in the gold price throughout the remainder of the second quarter and throughout the third quarter. By October 4, gold had fallen to a low of US$1,820.01 and analysts expected the precious metal to be on the path to drop below the US$1,800 level.
That was before the October 7 attacks by Hamas on Israel ignited legitimate fears of a much larger conflict erupting in the Middle East. Reacting to those fears, the gold price climbed through the month and closed at US$2,007.08 on October 27. As the Israel-Hamas fighting intensified, gold reached a then new high of US$2,152.30 during intraday trading on December 3.
That robust momentum in the spot gold price has continued into 2024, chasing new highs on fears of a looming US recession, the promise of Fed rate cuts on the horizon, the worsening conflict in the Middle East and the tumultuous US presidential election year. By mid-March, gold was pushing up against the US$2,200 level.
That record-setting momentum continued into the second quarter of 2024 when gold broke through US$2,400 per ounce in mid-April on strong central bank buying, sovereign debt concerns in China and investors expecting the Fed to start cutting interest rates. The precious metal went on to hit US$2,450.05 per ounce on May 20.
Throughout the summer, the hits have just kept on coming. The global macro environment is highly bullish for gold in the lead up to the US election. Following the failed assassination attempt on former US President Donald Trump and a statement about coming interest rate cuts by Fed Chair Jerome Powell, the gold spot price hit a new all-time high on July 16 at US$2,469.30 per ounce.
One week later, news that President Joe Biden would not seek re-election and would instead pass the baton to his VP Kamala Harris eased some of the tension in the stock markets and strengthened the US dollar. This also pushed the price of gold down to US$2,387.99 per ounce on July 22.
However, the bullish factors supporting gold over the past year remain in play and the spot price for gold has gone on to breach the US$2,500 level first on August 2 on a less than stellar US jobs report before closing just above the US$2,440 level. A few weeks later, gold pushed past US$2,500 once again on August 16, to close above that level for the first time ever after the US Department of Commerce released data showing a fifth consecutive monthly decrease in a row for homebuilding.
Ongoing economic and geopolitical uncertainty had the gold spot price supported above the US$2,500 level to a then-high of US$2,530 per ounce on August 20, which it surpassed in September on the interest rate cut news discussed above.
What's next for the gold price is never an easy call to make. There are many factors that affect the gold price, but some of the most prevalent long-term drivers include economic expansion, market risk, opportunity cost and momentum.
Economic expansion is one of the primary gold price contributors as it facilitates demand growth in several categories, including jewelry, technology and investment. As the World Gold Council explains, “This is particularly true in developing economies where gold is often used as a luxury item and a means to preserve wealth.” Market risk is also a prime catalyst for gold values as investors view the precious metal as the “ultimate safe haven,” and a hedge against currency depreciation, inflation and other systemic risks.
Going forward, in addition to the Fed, inflation and geopolitical events, experts will be looking for cues from factors like supply and demand. In terms of supply, the world’s five top gold producers are China, Australia, Russia, Canada and the US. The consensus in the gold market is that major miners have not spent enough on gold exploration in recent years. Gold mine production has fallen from around 3,200 to 3,300 metric tons each year between 2018 and 2020 to around 3,000 to 3,100 metric tons each year between 2021 and 2023.
On the demand side, China and India are the biggest buyers of physical gold, and are in a perpetual fight for the title of world’s largest gold consumer. That said, it's worth noting that the last few years have brought a big rebound in central bank gold buying, which dropped to a record low in 2020, but reached a 55 year high of 1,136 metric tons in 2022.
The World Gold Council has reported that central bank gold purchases in 2023 came to 1,037 metric tons, marking the second year in a row above 1,000 MT.
"We think that gold has entered into a new phase of this bull market," Adam Rozencwajg, managing partner at Goehring & Rozencwajg, told the Investing News Network (INN) in a June 2023 interview. "It probably started in the third and fourth quarter of last year, and it really revolves around central banks' behavior as much as anything else. I think it's going to propel gold much much higher in this leg of the bull market."
Joe Cavatoni, North American market strategist at the WGC, told INN in an email at the end of Q1, “As central banks continue to be significant buyers and geopolitical risks and global uncertainties drive investors towards the perceived safety of gold, the current environment underscores gold’s importance as a strategic asset for portfolio diversification and risk mitigation. Therefore, while there may have been a perception of western disinterest in gold, recent developments indicate a sustained and broad-based demand for the precious metal.”
At the beginning of Q3, INN spoke with Brien Lundin, editor of Gold Newsletter, at the Rule Symposium in Boca Raton, Florida.
"I think clearing US$2,400 for good — trading a few weeks above that level would be key," Lundin said. "Eventually I think we're going to go much higher. The timing of that is always the hard part. Getting back to where I think we're going to be at the end of this cycle, I think the gold price is going to be somewhere between US$6,000 and US$8,000."
In August, INN spoke with Brett Heath, CEO and director of Metalla Royalty & Streaming (TSXV:MTA,NYSEAMERICAN:MTA), who sees gold going to US$2,600 to US$3,000 this year.
"You've seen such an incredible breakout (in gold), such an incredible setup — and the public's just not in the trade yet," he said. "When they do come back in, I think on the back of some of these capital flows, then that'll be a big driver of not only gold, but the equities, which today we still really have not seen any material inflows."
As a final note on the price of gold and buying gold bullion, it’s important for investors to be aware that gold price manipulation is a hot topic in the industry.
In 2011, when gold hit what was then a record high, it dropped swiftly in just a few short years. This decline after three years of impressive gains led many in the gold sector to cry foul and point to manipulation. Early in 2015, 10 banks were hit in a US probe on precious metals manipulation. Evidence provided by Deutsche Bank (NYSE:DB) showed “smoking gun” proof that UBS Group (NYSE:UBS), HSBC Holdings (NYSE:HSBC), the Bank of Nova Scotia (NYSE:BNS) and other firms were involved in rigging gold and silver rates in the market from 2007 to 2013.
Not long after, the long-running London gold fix was replaced by the LBMA gold price in a bid to increase gold price transparency. The twice-a-day process, operated by the ICE Benchmark Administration, still involves a variety of banks collaborating to set the gold price, but the system is now electronic.
Still, manipulation has by no means been eradicated, as a 2020 fine on JPMorgan (NYSE:JPM) shows. The next year, chat logs were released in a spoofing trial for two former precious metals traders from the Bank of America’s (NYSE:BAC) Merrill Lynch unit. They show a trader bragging about how easy it is to manipulate the gold price.
Gold market participants have consistently spoken out about manipulation. In mid-2020, Chris Marcus, founder of Arcadia Economics and author of the book “The Big Silver Short,” said that when gold fell back below the US$2,000 mark after hitting close to US$2,070, he saw similarities to what happened with the gold price in 2011.
Marcus has been following the gold and silver markets with a focus specifically on price manipulation for nearly a decade. His advice? “Trust your gut. I believe we’re witnessing the ultimate ’emperor’s really naked’ moment. This isn’t complex financial analysis. Sometimes I think of it as the greatest hypnotic thought experiment in history.”
While we have the answer to what the highest gold price ever is as of now, it remains to be seen how high gold can climb, and if the precious metal can reach as high as US$5,000, US$10,000 or even US$40,000.
Even so, many market participants believe gold is a must have in any investment profile, and there is little doubt investors will continue to see gold price action making headlines this year and beyond.
This is an updated version of an article first published by the Investing News Network in 2020.
Don’t forget to follow us @INN_Resource for real-time updates!
Securities Disclosure: I, Melissa Pistilli, hold no direct investment interest in any company mentioned in this article.
Editorial Disclosure: The Investing News Network does not guarantee the accuracy or thoroughness of the information reported in the interviews it conducts. The opinions expressed in these interviews do not reflect the opinions of the Investing News Network and do not constitute investment advice. All readers are encouraged to perform their own due diligence.
Kestrel Gold Inc. ("Kestrel" or the "Corporation")(TSXV:KGC) is pleased to provide an update on work completed by Centerra Gold Inc. ("Centerra") on the QCM gold property ("QCM") located in the Manson-Germanson area of central British Columbia. Centerra is currently in the process of earning a 75% interest in QCM by making cash payments totaling $900,000 and completing $6,500,000 in exploration work, which must include a minimum of 13,500 metres of drilling, by May 7th, 2029
Centerra collected 1,245 soil samples from the area of the 14 Vein showing and the Main Zone during May and June. Follow-up soil sampling and prospecting as well as a trial induced polarization ("IP") geophysical survey over the 14 Vein showing are underway. Current plans are for a reverse circulation ("RC") drill test of showings and anomalies to commence in early October.
Highlights from Centerra's soil sampling program show that the 14 Vein showing, where RC drilling in 2022 returned 2.33 g/t Au over 44.19 metres, is located within the northwest portion of an approximate 1.8 kilometre long by up to 500-metre-wide southeast trending gold soil anomaly. Gold values from within this anomaly range from background to 1870.7 ppb with strongly anomalous gold typically associated with anomalous arsenic. The historically recognized gold in soil anomaly located over Main Zone, where hole 2004-002 returned 2.86 g/t Au over 110.95 metres, was extended approximately 550 metres to the southeast of previous limits. Gold values from the southeast extension range from background to 207 ppb.
Showings on Geology (area of detail soil sample maps outlined in gold)
14 Vein Gold in Soil Map
Grid soil sampling in the 14 Vein area did not return significant gold anomalies over several showings including at Alcove (1.17 g/t Au from a 9.0m chip sample) and at Adit Zone where previous soil sampling returned up to 7,689 ppb Au. The loosely defined and sporadic nature of the 1.8 kilometre long by up to 500-metre-wide southeast trending gold soil anomaly and the lack of anomalies over several showings may be the result of glacial till dispersion and masking. Ice flow in this area is northwest to southeast.
Main Zone Gold in Soil Map
Pat Lynch, President and CEO of Kestrel, states: "We are pleased to see Centerra continue to make quality progress at QCM. The identification of a 1.8 kilometre long by up to 500-metre-wide gold in soil anomaly encompassing the 14 Vein showing suggests strong size potential for this target. We are also excited to see a 550-metre expansion of the gold in soil anomaly overlying Main Zone. Overall, work continues to support our belief that QCM is host to several large-scale gold targets and we look forward to results from the soon to commence drill test of these targets."
QCM Project Highlights:
QCM is comprised of 8,729 hectares covering an approximate 15-kilometre strike length of the Manson Fault Zone which is thought to be a controlling structure for much of the gold mineralization in the district.
Peak values from historical drilling completed within the Main Zone were found within hole 2004-002 which intersected an interval of 2.86 g/t Au over 110.95 metres, including a high-grade interval of 173 g/t Au over 1.5 metres, true widths unknown.
Prospecting during 2022 resulted in the discovery of the 14 Vein showing, drilling of which returned 2.33 g/t Au over 44.19 metres. Geology consists of silica-ankerite-pyrite altered greywacke cut by sheeted quartz veins. For further details see Kestrel's October 26, 2022 news release: https://www.kestrelgold.com/news/oct-25-2022-e7yzr.
Numerous historical showings occur throughout the project area, including Farrell where historical values of up to 1,777 g/t Au and 3,560 g/t Ag were returned from grab samples of a 3.0-metre-wide quartz vein and Flagstaff where historical values of up to 5.9 g/t Au and 1,153 g/t Ag were reported for grab samples of quartz veins and stockworks.
Kestrel owns a 100% interest in the QCM Property. For further details see Kestrel's March 22, 2024 news release: https://www.kestrelgold.com/news/march-22-2024. Kestrel subsequently granted Centerra the option to earn a 75% interest in QCM. For further details see Kestrel's May 8, 2024 news release: https://www.kestrelgold.com/news/may-8-2024.
Recently completed logging and associated road building has significantly improved access throughout the property which is proving of significant value to exploration efforts.
About Kestrel Gold
Kestrel Gold Inc. is an exploration company headquartered in western Canada and focused on the Canadian Cordillera. Kestrel has earned a 100% interest, subject to a 2% NSR royalty with buydown provisions, in the QCM Property which is an orogenic gold target located in the Manson-Germanson placer district. Kestrel has also earned a 100% interest, subject to a 2.5% NSR royalty with buydown provisions, in the KSD Property which is an orogenic gold target located in the Yukon portion of the Tintina Gold Belt. Kestrel is listed on the TSX Venture exchange under the symbol KGC. Readers are encouraged to refer to the Corporation's website "www.kestrelgold.com" for further information.
Qualified Person
Derek Torgerson P.Geo., a Qualified Person as defined by National Instrument 43-101, has reviewed and approved the technical information contained in this news release.
Forward-Looking Statements
The information and statements in this news release contain certain forward-looking information. This forward-looking information relates to future events or the Corporation's future performance including exploration activity that could take place on the Corporation's properties or projects. This forward-looking information is subject to certain risks and uncertainties and may be based on assumptions that could cause actual results to differ materially from those anticipated or implied in the forward-looking information. The Corporation's forward-looking information is expressly qualified in its entirety by this cautionary statement. Except as required by law, the Corporation undertakes no obligation to publicly update or revise any forward-looking information.
NEITHER THE TSX VENTURE EXCHANGE NOR ITS REGULATION SERVICES PROVIDER (as that term is defined in the policies of the TSX Venture Exchange) ACCEPTS RESPONSIBILITY FOR THE ADEQUACY OR ACCURACY OF THIS RELEASE.
For further information contact:
Pat Lynch, President and CEO
Office: (403) 660-3329
Email: pat@kestrelgold.com
SOURCE: Kestrel Gold Inc.
News Provided by ACCESSWIRE via QuoteMedia
Investing News Network websites or approved third-party tools use cookies. Please refer to the cookie policy for collected data, privacy and GDPR compliance. By continuing to browse the site, you agree to our use of cookies.