The Conversation (0)
All amounts are in US dollars except as otherwise noted
Nutrien Ltd. (TSX and NYSE: NTR) announced today its third quarter 2021 results, with net earnings of $726 million ($1.25 diluted earnings per share). Third-quarter adjusted net earnings 1 were $1.38 per share and adjusted EBITDA 1 was $1.6 billion.
"Nutrien delivered record earnings in the third quarter driven by the decisive actions we made across our business units and leveraging our competitive advantages to benefit from strong market fundamentals. The results demonstrate our ability to efficiently and reliably deliver crop inputs and services to our customers amid global supply uncertainties, and we remain focused on our essential role to support global food security and sustainable food production," commented Mayo Schmidt, Nutrien's President and CEO.
"We are raising full-year 2021 adjusted earnings guidance and expect this positive momentum to continue into 2022. We expect to generate significant free cash flow and to meaningfully strengthen our balance sheet through debt reduction, providing flexibility to deliver on future growth opportunities and return cash to shareholders," added Mr. Schmidt.
Highlights:
- Nutrien generated record adjusted EBITDA of $4.7 billion and free cash flow 1 of $2.8 billion in the first nine months of 2021. We repurchased 2.4 million shares in the third quarter of 2021 and expect to reduce long-term debt by approximately $2 billion over the next six months.
- Nutrien raised full-year 2021 adjusted EBITDA and adjusted net earnings per share 1 guidance to $6.9 to $7.1 billion and $5.85 to $6.10 per share. We expect strong demand for crop inputs in the fourth quarter and tight global fertilizer supply and demand fundamentals to carry into 2022.
- Nutrien Ag Solutions ("Retail") delivered record adjusted EBITDA in the third quarter and first nine months of 2021 with 80 percent and 32 percent increases respectively compared to the same periods in 2020. Our Retail business delivered double digit revenue growth, which combined with the benefits of strategic procurement and proprietary products growth resulted in adjusted EBITDA margins increasing to 11 percent in the first nine months of 2021.
Retail normalized comparable store sales 1 reached 5 percent in the first nine months of 2021 while rolling four quarter adjusted EBITDA per US selling location 1 was $1.4 million. Sales through our digitally-enabled retail platform were approximately $1.9 billion in the first nine months of 2021 and we are beginning to roll out the interface in Australia. We announced five transactions in Brazil since the start of 2020 and expect to generate over 30 percent of our Retail adjusted EBITDA from regions outside of the US in 2021.
- Potash adjusted EBITDA increased 131 percent in the third quarter of 2021 and increased 74 percent in the first nine months of 2021 compared to the same periods in 2020. We achieved record sales volumes in the first nine months of 2021 due to our capability to quickly ramp up production from our flexible, low-cost network of six mines and expect to surge production to an annualized run-rate of 17 million tonnes during the fourth quarter.
- Nitrogen adjusted EBITDA was 173 percent higher in the third quarter of 2021 and increased 70 percent in the first nine months of 2021 compared to the same periods in 2020. In the third quarter of 2021, we completed phase 1 of our nitrogen brownfield expansion projects and anticipate to fully benefit from this expanded capacity in 2022, which is expected to generate attractive returns on investment. We also started a second phase of brownfield projects that is expected to add approximately 500,000 tonnes of annualized, low-cost and environmentally efficient production capacity over the next few years. We progressed previously announced decarbonization projects that are expected to reduce CO 2 equivalent emissions by approximately one million tonnes by the end of 2023.
- Phosphate adjusted EBITDA increased 193 percent in the third quarter of 2021 and 104 percent in the first nine months of 2021 compared to the same periods in 2020.
| 1 This financial measure, including related guidance, is a non-IFRS financial measure. See the "Non-IFRS Financial Measures" section for further information. |
Management's Discussion and Analysis
The following management's discussion and analysis ("MD&A") is the responsibility of management and is dated as of November 1, 2021. The Board of Directors ("Board") of Nutrien carries out its responsibility for review of this disclosure principally through its audit committee, comprised exclusively of independent directors. The audit committee reviews and, prior to its publication approves this disclosure pursuant to the authority delegated to it by the Board. The term "Nutrien" refers to Nutrien Ltd. and the terms "we", "us", "our", "Nutrien" and "the Company" refer to Nutrien and, as applicable, Nutrien and its direct and indirect subsidiaries on a consolidated basis. Additional information relating to Nutrien (which, except as otherwise noted, is not incorporated by reference herein), including our 2020 Annual Report dated February 18, 2021, which includes our annual audited consolidated financial statements and MD&A, and our Annual Information Form, each for the year ended December 31, 2020, can be found on SEDAR at www.sedar.com and on EDGAR at www.sec.gov . No update is provided to the disclosure in our annual MD&A except for material information since the date of our annual MD&A. The Company is a foreign private issuer under the rules and regulations of the US Securities and Exchange Commission ("SEC").
This MD&A is based on and should be read in conjunction with the Company's unaudited interim condensed consolidated financial statements as at and for the three and nine months ended September 30, 2021 ("interim financial statements") based on International Financial Reporting Standards ("IFRS") as issued by the International Accounting Standards Board and prepared in accordance with International Accounting Standard 34 "Interim Financial Reporting" unless otherwise noted. This MD&A contains certain non-IFRS financial measures and forward-looking statements which are described in the "Non-IFRS Financial Measures" and the "Forward-Looking Statements" sections, respectively.
Market Outlook
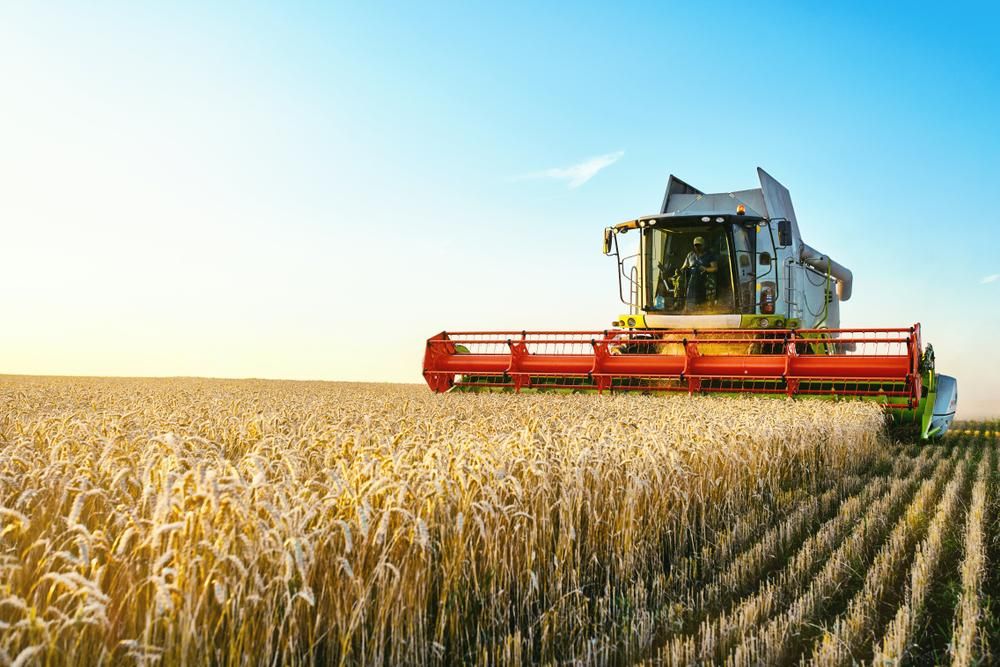
Agriculture and Retail
- Global grain and oilseed inventory is well below historic levels and crop prices and grower margins remain strong, which is supportive of crop input spending in key regions where we operate.
- The North American harvest progressed ahead of historic levels and grower sentiment is positive, which supported a strong start to the fall application season in most regions. We expect growers to maximize planted acreage and yields in 2022 as projected US grower corn and soybean margins are approximately 60 percent and 35 percent, respectively, above 10-year average levels.
- Brazilian growers are expected to increase total plantings by 5 to 7 million acres due to record grower profitability and are planting soybeans at an above-average pace due to supportive rainfalls. This is expected to result in higher crop input spending through the growing season.
- Growers in Australia started harvesting winter crops and we expect them to benefit from the combination of above-average yields and high prices for crops like wheat, barley and canola.
- The availability of crop inputs, including fertilizer and certain herbicides, has been impacted by global production and supply-chain issues. Nutrien is strategically positioned to cover fall commitments and expects limited impact to its crop protection product availability in the first half of 2022.
Crop Nutrient Markets
- Global potash prices continue to increase in all key spot markets driven by record global demand and strong grower margins. We maintain our 2021 global shipment forecast between 69 and 71 million tonnes.
- Global supply of potash is tight caused by competitor mine flooding, new project delays and a limited ability of most producers to meaningfully increase production. US and European sanctions imposed on Belarus are causing additional supply concerns due to potential impacts to vessel chartering and transaction execution in US dollars. Potash inventories remain below historic levels in key markets with China accessing strategic reserves. Nutrien remains committed to providing a reliable supply for our customers through our world-class distribution network, including Canpotex.
- Soaring energy prices in Europe and China triggered nitrogen capacity shutdowns and reduced operating rates, rapidly tightening global nitrogen supply and shifting trade flows. Furthermore, the Chinese government ordered fertilizer producers to halt exports until June 2022, which is expected to significantly reduce Chinese urea and phosphate trade volumes.
- Phosphate prices have been supported by the expected reduction in supply from China due to export restrictions and reduced US supply, compounded by tight inventories as a result of robust demand throughout 2021.
Financial Outlook and Guidance
Based on market factors detailed above, we are raising full-year 2021 adjusted EBITDA guidance to $6.9 to $7.1 billion from $6.0 to $6.4 billion and full-year 2021 adjusted net earnings guidance to $5.85 to $6.10 per share from $4.60 to $5.10 per share.
All guidance numbers, including those noted above are outlined in the table below. Refer to page 57 of Nutrien's 2020 Annual Report for related assumptions and sensitivities.
| 2021 Guidance Ranges 1 |
| Low |
|
|
| High |
|
| Adjusted net earnings per share 2 | $ | 5.85 |
|
| $ | 6.10 |
|
| Adjusted EBITDA (billions) 2 | $ | 6.9 |
|
| $ | 7.1 |
|
| Retail Adjusted EBITDA (billions) | $ | 1.75 |
|
| $ | 1.80 |
|
| Potash Adjusted EBITDA (billions) | $ | 2.65 |
|
| $ | 2.75 |
|
| Nitrogen Adjusted EBITDA (billions) | $ | 2.3 |
|
| $ | 2.4 |
|
| Phosphate Adjusted EBITDA (millions) | $ | 490 |
|
| $ | 540 |
|
| Potash sales tonnes (millions) 3 |
| 13.6 |
|
|
| 13.9 |
|
| Nitrogen sales tonnes (millions) 3 |
| 10.7 |
|
|
| 10.9 |
|
| Depreciation and amortization (billions) | $ | 1.9 |
|
| $ | 2.0 |
|
| Effective tax rate on adjusted earnings |
| 24 | % |
|
| 25 | % |
| Sustaining capital expenditures (billions) 2 | $ | 1.15 |
|
| $ | 1.25 |
|
| 1 See the "Forward-Looking Statements" section. | |||||||
| 2 See the "Non-IFRS Financial Measures" section. | |||||||
| 3 Manufactured products only. Nitrogen excludes ESN® and Rainbow products. |
Consolidated Results
|
| Three Months Ended September 30 |
| Nine Months Ended September 30 | ||||||||
| (millions of US dollars) | 2021 |
| 2020 |
| % Change |
| 2021 |
| 2020 |
| % Change |
| Sales 1 | 6,024 |
| 4,227 |
| 43 |
| 20,445 |
| 16,856 |
| 21 |
| Freight, transportation and distribution | 220 |
| 204 |
| 8 |
| 653 |
| 653 |
| - |
| Cost of goods sold | 3,639 |
| 3,004 |
| 21 |
| 13,589 |
| 12,129 |
| 12 |
| Gross margin 1 | 2,165 |
| 1,019 |
| 112 |
| 6,203 |
| 4,074 |
| 52 |
| Expenses 1 | 1,108 |
| 1,741 |
| (36) |
| 3,249 |
| 3,575 |
| (9) |
| Net earnings (loss) | 726 |
| (587) |
| n/m |
| 1,972 |
| 143 |
| n/m |
| Adjusted EBITDA 2 | 1,642 |
| 670 |
| 145 |
| 4,663 |
| 2,899 |
| 61 |
| Cash (used in) provided by operating activities | (1,565) |
| (685) |
| 128 |
| 249 |
| 545 |
| (54) |
| Free cash flow ("FCF") 2 | 862 |
| 280 |
| 208 |
| 2,751 |
| 1,634 |
| 68 |
| FCF including changes in non-cash operating working capital 2 | (1,890) |
| (888) |
| 113 |
| (544) |
| 34 |
| n/m |
| 1 Certain immaterial figures have been reclassified for the three and nine months ended September 30, 2020. | |||||||||||
| 2 See the "Non-IFRS Financial Measures" section. | |||||||||||
Net earnings and adjusted EBITDA increased significantly in the third quarter and first nine months of 2021 compared to the same periods in 2020 due to higher net realized selling prices across our nutrient businesses, higher potash sales volumes and earnings growth in Nutrien Ag Solutions ("Retail"), as well as, the non-cash impairment in the third quarter of 2020 that was primarily related to our phosphate business. Cash flow from operating activities decreased in the third quarter and first nine months of 2021 compared to the same periods in 2020 due to higher working capital requirements associated with much higher sales and higher value of fertilizers, while free cash flow increased by over $1 billion in the first nine months of 2021. The COVID-19 pandemic had a limited impact on our results during the third quarter and first nine months of 2021.
Segment Results
Our discussion of segment results set out on the following pages is a comparison of the results for the three and nine months ended September 30, 2021 to the results for the three and nine months ended September 30, 2020, unless otherwise noted.
Nutrien Ag Solutions ("Retail")
|
| Three Months Ended September 30 | ||||||||||||||
| (millions of US dollars, except | Dollars |
| Gross Margin |
| Gross Margin (%) | ||||||||||
| as otherwise noted) | 2021 |
| 2020 |
| % Change |
| 2021 |
| 2020 |
| % Change |
| 2021 |
| 2020 |
| Sales |
|
|
|
|
|
|
|
|
|
|
|
|
|
|
|
| Crop nutrients | 1,194 |
| 780 |
| 53 |
| 246 |
| 179 |
| 37 |
| 21 |
| 23 |
| Crop protection products | 1,469 |
| 1,328 |
| 11 |
| 374 |
| 256 |
| 46 |
| 25 |
| 19 |
| Seed | 140 |
| 103 |
| 36 |
| 56 |
| 27 |
| 107 |
| 40 |
| 26 |
| Merchandise | 265 |
| 234 |
| 13 |
| 44 |
| 37 |
| 19 |
| 17 |
| 16 |
| Nutrien Financial 1 | 54 |
| 36 |
| 50 |
| 54 |
| 36 |
| 50 |
| 100 |
| 100 |
| Services and other 1 | 276 |
| 296 |
| (7) |
| 194 |
| 183 |
| 6 |
| 70 |
| 62 |
| Nutrien Financial elimination 2 | (51) |
| (35) |
| 46 |
| (51) |
| (35) |
| 46 |
| 100 |
| 100 |
|
| 3,347 |
| 2,742 |
| 22 |
| 917 |
| 683 |
| 34 |
| 27 |
| 25 |
| Cost of goods sold | 2,430 |
| 2,059 |
| 18 |
|
|
|
|
|
|
|
|
|
|
| Gross margin | 917 |
| 683 |
| 34 |
|
|
|
|
|
|
|
|
|
|
| Expenses 1, 3 | 808 |
| 691 |
| 17 |
|
|
|
|
|
|
|
|
|
|
| Earnings (loss) before finance costs and taxes ("EBIT") | 109 |
| (8) |
| n/m |
|
|
|
|
|
|
|
|
|
|
| Depreciation and amortization | 182 |
| 170 |
| 7 |
|
|
|
|
|
|
|
|
|
|
| EBITDA / Adjusted EBITDA | 291 |
| 162 |
| 80 |
|
|
|
|
|
|
|
|
|
|
| 1 Certain immaterial figures have been reclassified for the three months ended September 30, 2020. | |||||||||||||||
| 2 Represents elimination for the interest and service fees charged by Nutrien Financial to Retail branches. | |||||||||||||||
| 3 Includes selling expenses of $746 million (2020 – $669 million). | |||||||||||||||
|
| Nine Months Ended September 30 | ||||||||||||||
| (millions of US dollars, except | Dollars |
| Gross Margin |
| Gross Margin (%) | ||||||||||
| as otherwise noted) | 2021 |
| 2020 |
| % Change |
| 2021 |
| 2020 |
| % Change |
| 2021 |
| 2020 |
| Sales |
|
|
|
|
|
|
|
|
|
|
|
|
|
|
|
| Crop nutrients | 5,255 |
| 4,092 |
| 28 |
| 1,169 |
| 894 |
| 31 |
| 22 |
| 22 |
| Crop protection products | 5,220 |
| 4,774 |
| 9 |
| 1,137 |
| 960 |
| 18 |
| 22 |
| 20 |
| Seed | 1,819 |
| 1,638 |
| 11 |
| 362 |
| 305 |
| 19 |
| 20 |
| 19 |
| Merchandise | 763 |
| 703 |
| 9 |
| 127 |
| 116 |
| 9 |
| 17 |
| 17 |
| Nutrien Financial 1 | 138 |
| 92 |
| 50 |
| 138 |
| 92 |
| 50 |
| 100 |
| 100 |
| Services and other 1 | 784 |
| 951 |
| (18) |
| 617 |
| 567 |
| 9 |
| 79 |
| 60 |
| Nutrien Financial elimination | (123) |
| (83) |
| 48 |
| (123) |
| (83) |
| 48 |
| 100 |
| 100 |
|
| 13,856 |
| 12,167 |
| 14 |
| 3,427 |
| 2,851 |
| 20 |
| 25 |
| 23 |
| Cost of goods sold | 10,429 |
| 9,316 |
| 12 |
|
|
|
|
|
|
|
|
|
|
| Gross margin | 3,427 |
| 2,851 |
| 20 |
|
|
|
|
|
|
|
|
|
|
| Expenses 1, 2 | 2,467 |
| 2,206 |
| 12 |
|
|
|
|
|
|
|
|
|
|
| EBIT | 960 |
| 645 |
| 49 |
|
|
|
|
|
|
|
|
|
|
| Depreciation and amortization | 528 |
| 488 |
| 8 |
|
|
|
|
|
|
|
|
|
|
| EBITDA | 1,488 |
| 1,133 |
| 31 |
|
|
|
|
|
|
|
|
|
|
| Adjustments 3 | 9 |
| - |
| n/m |
|
|
|
|
|
|
|
|
|
|
| Adjusted EBITDA | 1,497 |
| 1,133 |
| 32 |
|
|
|
|
|
|
|
|
|
|
| 1 Certain immaterial figures have been reclassified for the nine months ended September 30, 2020. | |||||||||||||||
| 2 Includes selling expenses of $2,276 million (2020 – $2,068 million). | |||||||||||||||
| 3 See Note 2 to the interim financial statements. | |||||||||||||||
- Adjusted EBITDA increased in the third quarter and first nine months of 2021 due to significantly higher sales and gross margin. Higher sales were achieved through market share growth and strong agriculture fundamentals. Gross margin increased due to improved proprietary product results and from strategic procurement of crop nutrients and crop protection products in a rising price environment. Retail cash operating coverage ratio 1 declined to 59 percent for the rolling four quarters ended September 30, 2021 due to significantly higher gross margin.
- Crop nutrients sales increased in the third quarter and first nine months of 2021 as a result of record sales volumes and higher selling prices. Gross margin per tonne increased significantly due to strategic purchasing in a rising price environment and higher proprietary product sales. Gross margin percentage decreased slightly in the third quarter of 2021 due to the magnitude of per tonne selling price increases but was slightly higher in the first nine months of 2021.
- Crop protection products sales increased in the third quarter and first nine months of 2021 due to higher selling prices, market share growth and higher proprietary product sales. The reliability of our supply chain and strategic procurement allowed us to deliver on strong grower demand and generate higher gross margin percentages.
- Seed sales increased in the third quarter and first nine months of 2021 due to strategic acquisitions in Brazil, strong grower purchasing in the US and higher planted acreage in key regions where we operate. Gross margin percentage increased in the third quarter and first nine-months of 2021 due to the timing and mix of seed sales and a greater proportion of higher margin proprietary product sales.
- Merchandise sales and gross margin percentage increased in the third quarter and first nine months of 2021 primarily driven by strong grower and rancher purchasing in Australia.
- Nutrien Financial sales increased in the third quarter and first nine months of 2021 due to higher utilization and adoption of our programs, including from the expansion of Nutrien Financial into Australia in the fourth quarter of 2020. At the end of the third quarter of 2021 net receivables in the programs were $2.8 billion, an increase of $1.1 billion compared to the same time last year, while net credit loss was minimal in the first nine months of 2021 and 2020 due to strong credit evaluation and collection.
- Services and other sales decreased in the third quarter and first nine months of 2021 compared to the same periods in 2020 due to the divestiture of an Australian livestock export business in the fourth quarter of 2020, which more than offset higher US custom application sales. Despite the change in revenue mix, gross margin increased and the impact to gross margin percentage was favorable for both the third quarter and first nine months of 2021.
| 1 This financial measure is a non-IFRS financial measure. See the "Non-IFRS Financial Measures" section for further information |
Potash
|
| Three Months Ended September 30 | ||||||||||
| (millions of US dollars, except | Dollars |
| Tonnes (thousands) |
| Average per Tonne | ||||||
| as otherwise noted) | 2021 | 2020 | % Change |
| 2021 | 2020 | % Change |
| 2021 | 2020 | % Change |
| Manufactured product |
|
|
|
|
|
|
|
|
|
|
|
| Net sales |
|
|
|
|
|
|
|
|
|
|
|
| North America | 483 | 252 | 92 |
| 1,515 | 1,426 | 6 |
| 319 | 176 | 81 |
| Offshore | 705 | 339 | 108 |
| 2,276 | 2,252 | 1 |
| 310 | 151 | 105 |
|
| 1,188 | 591 | 101 |
| 3,791 | 3,678 | 3 |
| 313 | 161 | 94 |
| Cost of goods sold | 372 | 303 | 23 |
|
|
|
|
| 98 | 83 | 18 |
| Gross margin - total | 816 | 288 | 183 |
|
|
|
|
| 215 | 78 | 176 |
| Expenses 1 | 146 | 84 | 74 |
| Depreciation and amortization |
| 35 | 34 | 2 | ||
| EBIT | 670 | 204 | 228 |
| Gross margin excluding depreciation |
|
|
| |||
| Depreciation and amortization | 131 | 124 | 6 |
| and amortization - manufactured 2 | 250 | 112 | 123 | |||
| EBITDA | 801 | 328 | 144 |
| Potash cash cost of product |
|
|
|
| ||
| Adjustments 3 | 7 | 22 | (68) |
| manufactured 2 |
| 66 | 53 | 25 | ||
| Adjusted EBITDA | 808 | 350 | 131 |
|
|
|
|
|
|
|
|
| 1 Includes provincial mining taxes of $128 million (2020 – $58 million). | |||||||||||
| 2 See the "Non-IFRS Financial Measures" section. | |||||||||||
| 3 See Note 2 to the interim financial statements. | |||||||||||
|
| Nine Months Ended September 30 | ||||||||||
| (millions of US dollars, except | Dollars |
| Tonnes (thousands) |
| Average per Tonne | ||||||
| as otherwise noted) | 2021 | 2020 | % Change |
| 2021 | 2020 | % Change |
| 2021 | 2020 | % Change |
| Manufactured product |
|
|
|
|
|
|
|
|
|
|
|
| Net sales |
|
|
|
|
|
|
|
|
|
|
|
| North America | 1,141 | 709 | 61 |
| 4,157 | 3,774 | 10 |
| 275 | 188 | 46 |
| Offshore | 1,475 | 987 | 49 |
| 6,412 | 6,396 | - |
| 230 | 154 | 49 |
|
| 2,616 | 1,696 | 54 |
| 10,569 | 10,170 | 4 |
| 248 | 167 | 49 |
| Cost of goods sold | 980 | 878 | 12 |
|
|
|
|
| 93 | 87 | 7 |
| Gross margin - total | 1,636 | 818 | 100 |
|
|
|
|
| 155 | 80 | 94 |
| Expenses 1 | 333 | 199 | 67 |
| Depreciation and amortization |
| 35 | 32 | 9 | ||
| EBIT | 1,303 | 619 | 111 |
| Gross margin excluding depreciation |
|
|
| |||
| Depreciation and amortization | 371 | 329 | 13 |
| and amortization - manufactured | 190 | 112 | 69 | |||
| EBITDA | 1,674 | 948 | 77 |
| Potash cash cost of product |
|
|
|
| ||
| Adjustments 2 | 9 | 22 | (59) |
| manufactured |
| 61 | 55 | 11 | ||
| Adjusted EBITDA | 1,683 | 970 | 74 |
|
|
|
|
|
|
|
|
| 1 Includes provincial mining taxes of $293 million (2020 – $161 million). | |||||||||||
| 2 See Note 2 to the interim financial statements. | |||||||||||
- Adjusted EBITDA increased in the third quarter and first nine months of 2021 due to higher net realized selling prices and record sales volumes in the first nine months of 2021.
- Sales volumes increased in the third quarter and first nine months of 2021 and were the highest of any first nine-month period on record underpinned by the reliable supply from our flexible, low-cost network of six mines and integrated transportation and logistics system.
- Net realized selling price increased in the third quarter and first nine months of 2021 due to strong global demand supported by higher crop prices and impacts to global supply caused by competitor outages and project delays.
- Cost of goods sold per tonne in the third quarter and first nine months of 2021 increased primarily due to a stronger Canadian dollar, the timing of mine maintenance activity and higher royalties resulting from increased selling prices.
Canpotex Sales by Market
| (percentage of sales volumes, except as | Three Months Ended September 30 |
| Nine Months Ended September 30 | ||||
| otherwise noted) | 2021 | 2020 | Change |
| 2021 | 2020 | Change |
| Latin America | 48 | 36 | 12 |
| 38 | 33 | 5 |
| Other Asian markets 1 | 28 | 20 | 8 |
| 35 | 25 | 10 |
| India | 9 | 14 | (5) |
| 6 | 13 | (7) |
| China | 7 | 23 | (16) |
| 11 | 22 | (11) |
| Other markets | 8 | 7 | 1 |
| 10 | 7 | 3 |
|
| 100 | 100 |
|
| 100 | 100 |
|
| 1 All Asian markets except China and India. |
|
|
|
|
|
|
|
Nitrogen
|
| Three Months Ended September 30 | ||||||||||
| (millions of US dollars, except | Dollars |
| Tonnes (thousands) |
| Average per Tonne | ||||||
| as otherwise noted) | 2021 | 2020 | % Change |
| 2021 | 2020 | % Change |
| 2021 | 2020 | % Change |
| Manufactured product |
|
|
|
|
|
|
|
|
|
|
|
| Net sales |
|
|
|
|
|
|
|
|
|
|
|
| Ammonia | 368 | 105 | 250 |
| 721 | 546 | 32 |
| 509 | 193 | 164 |
| Urea | 316 | 193 | 64 |
| 659 | 766 | (14) |
| 480 | 251 | 91 |
| Solutions, nitrates and sulfates | 289 | 143 | 102 |
| 1,141 | 1,091 | 5 |
| 253 | 131 | 93 |
|
| 973 | 441 | 121 |
| 2,521 | 2,403 | 5 |
| 386 | 184 | 110 |
| Cost of goods sold | 591 | 392 | 51 |
|
|
|
|
| 234 | 164 | 43 |
| Gross margin - manufactured | 382 | 49 | 680 |
|
|
|
|
| 152 | 20 | 660 |
| Gross margin - other 1 | 24 | 9 | 167 |
| Depreciation and amortization |
| 50 | 55 | (9) | ||
| Gross margin - total | 406 | 58 | 600 |
| Gross margin excluding depreciation |
|
|
| |||
| (Income) expenses | (1) | 21 | n/m |
| and amortization - manufactured | 202 | 75 | 171 | |||
| EBIT | 407 | 37 | 1,000 |
| Ammonia controllable cash cost of |
|
|
|
| ||
| Depreciation and amortization | 125 | 131 | (5) |
| product manufactured 2 |
| 53 | 47 | 13 | ||
| EBITDA | 532 | 168 | 217 |
|
|
|
|
|
|
|
|
| Adjustments 3 | - | 27 | (100) |
|
|
|
|
|
|
|
|
| Adjusted EBITDA | 532 | 195 | 173 |
|
|
|
|
|
|
|
|
| 1 Includes other nitrogen (including ESN® and Rainbow) and purchased products and is comprised of net sales of $128 million (2020 – $99 million) less cost of goods sold of $104 million (2020 – $90 million). | |||||||||||
| 2 See the "Non-IFRS Financial Measures" section. | |||||||||||
| 3 See Note 2 to the interim financial statements. | |||||||||||
|
| Nine Months Ended September 30 | ||||||||||
| (millions of US dollars, except | Dollars |
| Tonnes (thousands) |
| Average per Tonne | ||||||
| as otherwise noted) | 2021 | 2020 | % Change |
| 2021 | 2020 | % Change |
| 2021 | 2020 | % Change |
| Manufactured product |
|
|
|
|
|
|
|
|
|
|
|
| Net sales |
|
|
|
|
|
|
|
|
|
|
|
| Ammonia | 874 | 464 | 88 |
| 2,129 | 2,048 | 4 |
| 411 | 227 | 81 |
| Urea | 911 | 703 | 30 |
| 2,235 | 2,622 | (15) |
| 407 | 268 | 52 |
| Solutions, nitrates and sulfates | 743 | 500 | 49 |
| 3,526 | 3,451 | 2 |
| 211 | 145 | 46 |
|
| 2,528 | 1,667 | 52 |
| 7,890 | 8,121 | (3) |
| 320 | 205 | 56 |
| Cost of goods sold | 1,628 | 1,344 | 21 |
|
|
|
|
| 206 | 165 | 25 |
| Gross margin - manufactured | 900 | 323 | 179 |
|
|
|
|
| 114 | 40 | 185 |
| Gross margin - other 1 | 72 | 40 | 80 |
| Depreciation and amortization |
| 52 | 56 | (7) | ||
| Gross margin - total | 972 | 363 | 168 |
| Gross margin excluding depreciation |
|
|
| |||
| (Income) expenses | (1) | 29 | n/m |
| and amortization - manufactured | 166 | 96 | 73 | |||
| EBIT | 973 | 334 | 191 |
| Ammonia controllable cash cost of |
|
|
|
| ||
| Depreciation and amortization | 409 | 453 | (10) |
| product manufactured |
| 52 | 44 | 18 | ||
| EBITDA | 1,382 | 787 | 76 |
|
|
|
|
|
|
|
|
| Adjustments 2 | 5 | 27 | (81) |
|
|
|
|
|
|
|
|
| Adjusted EBITDA | 1,387 | 814 | 70 |
|
|
|
|
|
|
|
|
| 1 Includes other nitrogen (including ESN® and Rainbow) and purchased products and is comprised of net sales of $512 million (2020 – $404 million) less cost of goods sold of $440 million (2020 – $364 million). | |||||||||||
| 2 See Note 2 to the interim financial statements. | |||||||||||
- Adjusted EBITDA increased in the third quarter and first nine months of 2021 primarily due to higher net realized selling prices which more than offset higher natural gas costs.
- Sales volumes increased in the third quarter of 2021 due to strong market demand and higher availability from our facility in Trinidad. Sales volumes in the first nine months of 2021 decreased compared to the same period in 2020 due to more planned turnaround activity, temporary production outages and lower inventory volumes at the beginning of 2021 compared to the same period in 2020.
- Net realized selling price in the third quarter and first nine months of 2021 was higher due to higher benchmark prices resulting from the strength in global agriculture markets, a recovery in industrial nitrogen demand, global production outages and higher energy prices in key nitrogen exporting regions.
- Cost of goods sold per tonne increased during the third quarter and first nine months of 2021 due to higher natural gas costs, production outages at our lower-cost North American facilities and a stronger Canadian dollar.
Natural Gas Prices in Cost of Production
|
| Three Months Ended September 30 |
| Nine Months Ended September 30 | ||||
| (US dollars per MMBtu, except as otherwise noted) | 2021 | 2020 | % Change |
| 2021 | 2020 | % Change |
| Overall gas cost excluding realized derivative impact | 4.77 | 2.18 | 119 |
| 3.92 | 2.17 | 81 |
| Realized derivative impact | 0.01 | 0.06 | (83) |
| 0.02 | 0.06 | (67) |
| Overall gas cost | 4.78 | 2.24 | 113 |
| 3.94 | 2.23 | 77 |
|
|
|
|
|
|
|
|
|
| Average NYMEX | 4.01 | 1.98 | 103 |
| 3.18 | 1.88 | 69 |
| Average AECO | 2.83 | 1.62 | 75 |
| 2.48 | 1.54 | 61 |
- Natural gas prices in our cost of production increased in the third quarter and first nine months of 2021 as a result of higher North American gas index prices and increased gas costs in Trinidad, where our gas prices are linked to ammonia benchmark prices.
Phosphate
|
| Three Months Ended September 30 | ||||||||||
| (millions of US dollars, except | Dollars |
| Tonnes (thousands) |
| Average per Tonne | ||||||
| as otherwise noted) | 2021 | 2020 | % Change |
| 2021 | 2020 | % Change |
| 2021 | 2020 | % Change |
| Manufactured product |
|
|
|
|
|
|
|
|
|
|
|
| Net sales |
|
|
|
|
|
|
|
|
|
|
|
| Fertilizer | 269 | 172 | 56 |
| 428 | 542 | (21) |
| 628 | 317 | 98 |
| Industrial and feed | 132 | 94 | 40 |
| 192 | 166 | 16 |
| 689 | 563 | 22 |
|
| 401 | 266 | 51 |
| 620 | 708 | (12) |
| 648 | 375 | 73 |
| Cost of goods sold | 300 | 268 | 12 |
|
|
|
|
| 484 | 379 | 28 |
| Gross margin - manufactured | 101 | (2) | n/m |
|
|
|
|
| 164 | (4) | n/m |
| Gross margin - other 1 | 7 | 1 | 600 |
| Depreciation and amortization |
| 63 | 85 | (26) | ||
| Gross margin - total | 108 | (1) | n/m |
| Gross margin excluding depreciation |
|
|
| |||
| Expenses | 12 | 782 | (98) |
| and amortization - manufactured | 227 | 81 | 181 | |||
| EBIT | 96 | (783) | n/m |
|
|
|
|
|
|
|
|
| Depreciation and amortization | 39 | 60 | (35) |
|
|
|
|
|
|
|
|
| EBITDA | 135 | (723) | n/m |
|
|
|
|
|
|
|
|
| Adjustments 2 | - | 769 | (100) |
|
|
|
|
|
|
|
|
| Adjusted EBITDA | 135 | 46 | 193 |
|
|
|
|
|
|
|
|
| 1 Includes other phosphate and purchased products and is comprised of net sales of $47 million (2020 – $26 million) less cost of goods sold of $40 million (2020 – $25 million). | |||||||||||
| 2 See Note 2 to the interim financial statements. | |||||||||||
|
| Nine Months Ended September 30 | ||||||||||
| (millions of US dollars, except | Dollars |
| Tonnes (thousands) |
| Average per Tonne | ||||||
| as otherwise noted) | 2021 | 2020 | % Change |
| 2021 | 2020 | % Change |
| 2021 | 2020 | % Change |
| Manufactured product |
|
|
|
|
|
|
|
|
|
|
|
| Net sales |
|
|
|
|
|
|
|
|
|
|
|
| Fertilizer | 731 | 491 | 49 |
| 1,331 | 1,582 | (16) |
| 549 | 310 | 77 |
| Industrial and feed | 365 | 304 | 20 |
| 577 | 551 | 5 |
| 633 | 552 | 15 |
|
| 1,096 | 795 | 38 |
| 1,908 | 2,133 | (11) |
| 575 | 373 | 54 |
| Cost of goods sold | 853 | 779 | 9 |
|
|
|
|
| 448 | 366 | 22 |
| Gross margin - manufactured | 243 | 16 | n/m |
|
|
|
|
| 127 | 7 | n/m |
| Gross margin - other 1 | 15 | 4 | 275 |
| Depreciation and amortization |
| 59 | 84 | (30) | ||
| Gross margin - total | 258 | 20 | n/m |
| Gross margin excluding depreciation |
|
|
| |||
| Expenses | 26 | 799 | (97) |
| and amortization - manufactured | 186 | 91 | 104 | |||
| EBIT | 232 | (779) | n/m |
|
|
|
|
|
|
|
|
| Depreciation and amortization | 112 | 179 | (37) |
|
|
|
|
|
|
|
|
| EBITDA | 344 | (600) | n/m |
|
|
|
|
|
|
|
|
| Adjustments 2 | - | 769 | (100) |
|
|
|
|
|
|
|
|
| Adjusted EBITDA | 344 | 169 | 104 |
|
|
|
|
|
|
|
|
| 1 Includes other phosphate and purchased products and is comprised of net sales of $140 million (2020 – $87 million) less cost of goods sold of $125 million (2020 – $83 million). | |||||||||||
| 2 See Note 2 to the interim financial statements. | |||||||||||
- Adjusted EBITDA increased in the third quarter and first nine months of 2021 due to higher net realized selling prices which more than offset higher raw material costs and lower sales volumes.
- Sales volumes were lower in the third quarter of 2021 due to the timing of sales and a greater proportion of certain fertilizer and industrial products with a higher P 2 O 5 content. Sales volumes in the first nine months of 2021 were also impacted by lower inventory volumes at the beginning of 2021 compared to the same period in 2020.
- Net realized selling price increased in the third quarter and first nine months of 2021 as a result of higher fertilizer benchmark prices driven by robust global phosphate demand, tight inventories and higher global raw material costs. Industrial and feed prices also increased in the third quarter and first nine months of 2021, but to a lesser extent than fertilizer, due to a lag in price realizations relative to spot prices.
- Cost of goods sold per tonne increased in the third quarter and first nine months of 2021 due to significantly higher raw material input costs and a favorable non-cash inventory adjustment in the third quarter of 2020, partially offset by lower depreciation and amortization. Results for the first nine months of 2020 were also impacted by a $46 million favorable change in estimate related to an asset retirement obligation recorded in the second quarter of 2020.
Corporate and Others
| (millions of US dollars, except as otherwise | Three Months Ended September 30 |
| Nine Months Ended September 30 | ||||
| noted) | 2021 | 2020 | % Change |
| 2021 | 2020 | % Change |
| Sales 1 | - | 23 | (100) |
| - | 70 | (100) |
| Cost of goods sold | - | 20 | (100) |
| - | 63 | (100) |
| Gross margin | - | 3 | (100) |
| - | 7 | (100) |
| Selling expenses | (9) | (4) | 125 |
| (24) | (17) | 41 |
| General and administrative expenses | 58 | 66 | (12) |
| 182 | 191 | (5) |
| Share-based compensation expense | 64 | 29 | 121 |
| 125 | 9 | n/m |
| Impairment of assets | - | 5 | (100) |
| - | 5 | (100) |
| Other expenses | 30 | 67 | (55) |
| 141 | 154 | (8) |
| EBIT | (143) | (160) | (11) |
| (424) | (335) | 27 |
| Depreciation and amortization | 12 | 15 | (20) |
| 34 | 41 | (17) |
| EBITDA | (131) | (145) | (10) |
| (390) | (294) | 33 |
| Adjustments 2 | 89 | 74 | 20 |
| 232 | 92 | 152 |
| Adjusted EBITDA | (42) | (71) | (41) |
| (158) | (202) | (22) |
| 1 Primarily relates to our non-core Canadian business that was sold in 2020. | |||||||
| 2 See Note 2 to the interim financial statements. | |||||||
- Share-based compensation expense was higher in the third quarter and first nine months of 2021 compared to the same periods in 2020 due to an increase in our share price. We also had a higher number of share-based awards that vested in 2021.
- Other expenses were lower in the third quarter and first nine months of 2021 compared to the same periods in 2020 due to lower information technology project related costs and lower foreign exchange losses. This was partially offset by additional cloud computing related expenses recognized in the first nine months of 2021 from our change in accounting policy (refer to Note 3 to the interim financial statements).
Eliminations
Eliminations of gross margin between operating segments in the third quarter of 2021 were $(82) million compared to $(12) million for the third quarter of 2020 and $(90) million in the first nine months of 2021 compared to a $15 million gross margin recovery for the same period in 2020. Eliminations increased due to higher margin inventories held by our Retail segment. Eliminations are not part of the Corporate and Others segment.
Finance Costs, Income Tax Expense (Recovery) and Other Comprehensive (Loss) Income
| (millions of US dollars, except as otherwise | Three Months Ended September 30 |
| Nine Months Ended September 30 | ||||
| noted) | 2021 | 2020 | % Change |
| 2021 | 2020 | % Change |
| Finance costs | 122 | 129 | (5) |
| 367 | 401 | (8) |
| Income tax expense (recovery) | 209 | (264) | n/m |
| 615 | (45) | n/m |
| Other comprehensive (loss) income | (79) | 71 | n/m |
| 6 | (86) | n/m |
- Finance costs in the third quarter and first nine months of 2021 were lower compared to the same periods in 2020 due to lower interest rates and a lower short-term debt balance, more than offsetting a higher long-term debt balance resulting from the $1.5 billion in notes issued in the second quarter of 2020.
- Income tax expense in the third quarter and first nine months of 2021 was higher as a result of higher earnings before income taxes compared to the same periods in 2020. Income tax recoveries were recorded in 2020 due to an impairment of assets and discrete tax recoveries related to US legislative changes.
- Other comprehensive (loss) income is primarily driven by changes in the currency translation of our foreign operations and our investment in Sinofert Holdings Ltd. ("Sinofert"). The Australian dollar depreciated as at September 30, 2021 relative to June 30, 2021 and December 31, 2020 levels which led to translation losses in the third quarter and first nine months of 2021. This was partially offset by an increase in the fair value of our investment in Sinofert.
Liquidity and Capital Resources
Sources and Uses of Liquidity
We continued to manage our capital in accordance with our capital allocation strategy. We believe that our internally generated cash flow, supplemented by available borrowings under our existing financing sources, if necessary, will be sufficient to meet our anticipated capital expenditures and other cash requirements for the foreseeable future. Refer to the "Capital Structure and Management" section for details on our existing long-term debt and credit facilities.
Sources and Uses of Cash
| (millions of US dollars, except as otherwise | Three Months Ended September 30 |
| Nine Months Ended September 30 | ||||
| noted) | 2021 | 2020 | % Change |
| 2021 | 2020 | % Change |
| Cash (used in) provided by operating activities | (1,565) | (685) | 128 |
| 249 | 545 | (54) |
| Cash used in investing activities | (523) | (356) | 47 |
| (1,342) | (1,209) | 11 |
| Cash provided by financing activities | 757 | 85 | 791 |
| 117 | 465 | (75) |
| Effect of exchange rate changes on cash and cash equivalents | (20) | 6 | n/m |
| (35) | (7) | 400 |
| Decrease in cash and cash equivalents | (1,351) | (950) | 42 |
| (1,011) | (206) | 391 |
| Cash (used in) |
|
| Cash used in |
|
| Cash provided by |
|
Financial Condition Review
The following balance sheet categories contained variances that were considered significant:
|
| As at |
|
|
|
| ||
| (millions of US dollars, except as otherwise noted) | September 30, 2021 |
| December 31, 2020 |
| $ Change |
| % Change |
| Assets |
|
|
|
|
|
|
|
| Cash and cash equivalents | 443 |
| 1,454 |
| (1,011) |
| (70) |
| Receivables | 6,911 |
| 3,626 |
| 3,285 |
| 91 |
| Inventories | 4,674 |
| 4,930 |
| (256) |
| (5) |
| Prepaid expenses and other current assets | 654 |
| 1,460 |
| (806) |
| (55) |
| Other assets | 679 |
| 914 |
| (235) |
| (26) |
| Liabilities and Equity |
|
|
|
|
|
|
|
| Short-term debt | 1,255 |
| 159 |
| 1,096 |
| 689 |
| Payables and accrued charges | 6,930 |
| 8,058 |
| (1,128) |
| (14) |
| Share capital | 15,818 |
| 15,673 |
| 145 |
| 1 |
| Retained earnings | 7,735 |
| 6,606 |
| 1,129 |
| 17 |
- Explanations for changes in Cash and cash equivalents are in the "Sources and Uses of Cash" section.
- Receivables increased due to higher sales across all of our segments. This was a result of increased crop nutrient net realized selling prices and strong demand for crop inputs, seasonal Retail sales and higher Retail vendor rebates receivables. Certain income tax receivables previously classified as non-current are currently realizable within one year.
- Inventories decreased due to the seasonality of our Retail segment. Generally, we carry higher inventory levels at year-end and during the early part of the year in preparation for the upcoming planting and application seasons. Throughout the year, inventory levels decrease as we sell to our customers. As at September 30, 2021, we held higher than average levels of inventory compared to the same period in 2020 due to the higher cost to produce or purchase inventory and held higher volumes of Retail inventory to meet anticipated demand.
- Prepaid expenses and other current assets decreased due to the drawdown of prepaid inventory where Retail typically prepays for products at year-end and takes possession of inventory throughout the year.
- Other assets decreased due to a reclassification of certain income tax receivables as current receivables, which will be realized within one year.
- Short-term debt increased from commercial paper issuances as part of our seasonal working capital management.
- Payables and accrued charges decreased due to the seasonality of our Retail segment. Similar to the movement of our inventories and prepaid expenses, we generally enter into vendor arrangements at year-end. Throughout the year, we settle our vendor obligations and customer prepayments decrease as drawdowns occur. As at September 30, 2021, we had higher payables balances compared to the same period in 2020 due to rising inventory costs, customer prepayments and higher income tax payable from increased earnings.
- Share capital increased from exercise of stock options partially offset by shares repurchased.
- Retained earnings increased as net earnings in the first nine months of 2021 exceeded dividends declared.
Capital Structure and Management
Principal Debt Instruments
As part of the normal course of business, we closely monitor our liquidity position. We use a combination of cash generated from operations and short-term and long-term debt to finance our operations. We were in compliance with our debt covenants and did not have any changes to our credit ratings in the nine months ended September 30, 2021.
|
| As at September 30, 2021 | |||
|
|
|
| Outstanding and Committed | |
| (millions of US dollars) | Rate of Interest (%) | Total Facility Limit | Short-term debt | Long-term debt |
| Credit facilities |
|
|
|
|
| Unsecured revolving term credit facility | n/a | 4,500 | - | - |
| Uncommitted revolving demand facility | n/a | 500 | - | - |
| Other credit facilities 1 | 1.8 - 11.4 | 635 | 128 | 156 |
| Other short-term debt | n/a |
| 88 | - |
| Commercial Paper | 0.2 - 0.3 |
| 1,039 | - |
| Total |
|
| 1,255 | 156 |
| 1 Other credit facilities are unsecured and consist of South American facilities with debt of $261 million and interest rates ranging from 1.8 percent to 11.4 percent and other facilities with debt of $23 million and interest rates ranging from 2.3 percent to 3.9 percent. | ||||
We also have a commercial paper program, which is limited to the availability of backup funds under the $4,500 million unsecured revolving term credit facility and excess cash invested in highly liquid securities.
We extended the maturity date of the unsecured revolving term credit facility from 2023 to 2026 in the second quarter of 2021. There was no change to the total facility limit or the significant agreement terms from those we disclosed in our 2020 Annual Report.
Our long-term debt consists primarily of notes. See the "Capital Structure and Management" section of our 2020 Annual Report for information on balances, rates and maturities for our notes. We expect to reduce our long-term debt by approximately $2 billion in the next six months by using cash on hand and proceeds from the issuance of commercial paper.
Outstanding Share Data
|
| As at October 29, 2021 |
| Common shares | 570,785,966 |
| Options to purchase common shares | 7,182,599 |
For more information on our capital structure and management, see Note 24 to our 2020 annual financial statements.
Quarterly Results
| (millions of US dollars, except as otherwise noted) | Q3 2021 | Q2 2021 | Q1 2021 | Q4 2020 | Q3 2020 | Q2 2020 | Q1 2020 | Q4 2019 |
| Sales 1 | 6,024 | 9,763 | 4,658 | 4,052 | 4,227 | 8,431 | 4,198 | 3,462 |
| Net earnings (loss) | 726 | 1,113 | 133 | 316 | (587) | 765 | (35) | (48) |
| Net earnings (loss) attributable to equity holders of Nutrien | 717 | 1,108 | 127 | 316 | (587) | 765 | (35) | (48) |
| Adjusted EBITDA | 1,642 | 2,215 | 806 | 768 | 670 | 1,721 | 508 | 664 |
| Net earnings (loss) per share attributable to equity holders of Nutrien |
|
|
|
|
|
|
|
|
| Basic | 1.26 | 1.94 | 0.22 | 0.55 | (1.03) | 1.34 | (0.06) | (0.08) |
| Diluted | 1.25 | 1.94 | 0.22 | 0.55 | (1.03) | 1.34 | (0.06) | (0.08) |
| 1 Certain immaterial figures have been reclassified in the first three quarters of 2020. | ||||||||
Seasonality in our business results from increased demand for products during the planting season. Crop input sales are generally higher in the spring and fall application seasons. Crop nutrient inventories are normally accumulated leading up to each application season. Our cash collections generally occur after the application season is complete, while customer prepayments made to us are concentrated in December and January and inventory prepayments paid to our suppliers are typically concentrated in the period from November to January. Feed and industrial sales are more evenly distributed throughout the year.
In the third quarter of 2020, earnings were impacted by an $823 million non-cash impairment of assets primarily in the Phosphate segment as a result of lower forecasted global phosphate prices. In the fourth quarter of 2020, earnings were impacted by a $250 million net gain on disposal of our investment in Misr Fertilizers Production Company S.A.E. ("MOPCO").
Critical Accounting Estimates
Our significant accounting policies are disclosed in our 2020 Annual Report. We have discussed the development, selection and application of our key accounting policies, and the critical accounting estimates and assumptions they involve, with the audit committee of the Board. Our critical accounting estimates are discussed on page 53 of our 2020 Annual Report. There were no significant changes in the nine months ended September 30, 2021 to our critical accounting estimates.
Controls and Procedures
Management is responsible for establishing and maintaining adequate internal control over financial reporting, as defined in Rules 13a-15(f) and 15d-15(f) under the Securities Exchange Act of 1934, as amended, and National Instrument 52-109 Certification of Disclosure in Issuers' Annual and Interim Filings . Internal control over financial reporting is designed to provide reasonable assurance regarding the reliability of financial reporting and preparation of financial statements for external purposes in accordance with IFRS. Any system of internal control over financial reporting, no matter how well designed, has inherent limitations. Therefore, even those systems determined to be effective can provide only reasonable assurance with respect to financial statement preparation and presentation.
There has been no change in our internal control over financial reporting during the three months ended September 30, 2021 that has materially affected, or is reasonably likely to materially affect, our internal control over financial reporting.
Forward-Looking Statements
Certain statements and other information included in this document, including within the "Financial Outlook and Guidance" section, constitute "forward-looking information" or "forward-looking statements" (collectively, "forward-looking statements") under applicable securities laws (such statements are often accompanied by words such as "anticipate", "forecast", "expect", "believe", "may", "will", "should", "estimate", "intend" or other similar words). All statements in this document, other than those relating to historical information or current conditions, are forward-looking statements, including, but not limited to: Nutrien's business strategies, plans, prospects and opportunities; Nutrien's full-year guidance, including expectations regarding our adjusted net earnings per share and adjusted EBITDA (consolidated and by segment); expectations regarding our growth and capital allocation intentions and strategies; capital spending expectations for 2021; expectations regarding our ability to reduce our long term debt; expectations regarding performance of our operating segments in 2021, including our operating segment market outlooks and market conditions for 2021, and the anticipated supply and demand for our products and services, expected market and industry conditions with respect to crop nutrient application rates, planted acres, crop mix, prices and the impact of import and export volumes; Nutrien's ability to develop innovative and sustainable solutions; the negotiation of sales contracts; expected benefits from our brownfield expansion projects; and acquisitions and divestitures. These forward-looking statements are subject to a number of assumptions, risks and uncertainties, many of which are beyond our control, which could cause actual results to differ materially from such forward-looking statements. As such, undue reliance should not be placed on these forward-looking statements.
All of the forward-looking statements are qualified by the assumptions that are stated or inherent in such forward-looking statements, including the assumptions referred to below and elsewhere in this document. Although we believe that these assumptions are reasonable, having regard to our experience and our perception of historical trends, this list is not exhaustive of the factors that may affect any of the forward-looking statements and the reader should not place an undue reliance on these assumptions and such forward-looking statements. Current conditions, economic and otherwise, render assumptions, although reasonable when made, subject to greater uncertainty. The additional key assumptions that have been made include, among other things, assumptions with respect to our ability to successfully complete, integrate and realize the anticipated benefits of our already completed and future acquisitions and divestitures, and that we will be able to implement our standards, controls, procedures and policies in respect of any acquired businesses and to realize the expected synergies; that future business, regulatory and industry conditions will be within the parameters expected by us, including with respect to prices, margins, demand, supply, product availability, supplier agreements, availability and cost of labor and interest, exchange and effective tax rates; assumptions with respect to global economic conditions and the accuracy of our market outlook expectations for 2021 and in the future; our expectations regarding the impacts, direct and indirect, of the COVID-19 pandemic on our business, customers, business partners, employees, supply chain, other stakeholders and the overall economy; the adequacy of our cash generated from operations and our ability to access our credit facilities or capital markets for additional sources of financing; our ability to identify suitable candidates for acquisitions and divestitures and negotiate acceptable terms; our ability to maintain investment grade ratings and achieve our performance targets; our ability to successfully negotiate sales contracts; and our ability to successfully implement new initiatives and programs.
Events or circumstances that could cause actual results to differ materially from those in the forward-looking statements include, but are not limited to: general global economic, market and business conditions; failure to complete announced and future acquisitions or divestitures at all or on the expected terms and within the expected timeline; climate change and weather conditions, including impacts from regional flooding and/or drought conditions; crop planted acreage, yield and prices; the supply and demand and price levels for our products; governmental and regulatory requirements and actions by governmental authorities, including changes in government policy (including tariffs, trade restrictions and climate change initiatives), government ownership requirements, changes in environmental, tax and other laws or regulations and the interpretation thereof; political risks, including civil unrest, actions by armed groups or conflict and malicious acts including terrorism; the occurrence of a major environmental or safety incident; innovation and cybersecurity risks related to our systems, including our costs of addressing or mitigating such risks; counterparty and sovereign risk; delays in completion of turnarounds at our major facilities; interruptions of or constraints in availability of key inputs, including natural gas and sulfur; any significant impairment of the carrying amount of certain assets; risks related to reputational loss; certain complications that may arise in our mining processes; the ability to attract, engage and retain skilled employees and strikes or other forms of work stoppages; the COVID-19 pandemic, including variants of the COVID-19 virus and the efficiency and distribution of vaccines, and its resulting effects on economic conditions, restrictions imposed by public health authorities or governments, including government-imposed vaccine mandates, fiscal and monetary responses by governments and financial institutions and disruptions to global supply chains; and other risk factors detailed from time to time in Nutrien reports filed with the Canadian securities regulators and the SEC in the United States.
The purpose of our expected adjusted net earnings per share, adjusted EBITDA (consolidated and by segment) and sustaining capital expenditures guidance ranges, are to assist readers in understanding our expected and targeted financial results, and this information may not be appropriate for other purposes.
The forward-looking statements in this document are made as of the date hereof and Nutrien disclaims any intention or obligation to update or revise any forward-looking statements in this document as a result of new information or future events, except as may be required under applicable Canadian securities legislation or applicable US federal securities laws.
Terms and Definitions
For the definitions of certain financial and non-financial terms used in this document, as well as a list of abbreviated company names and sources, see the "Terms and Definitions" section of our 2020 Annual Report. All references to per share amounts pertain to diluted net earnings (loss) per share, "n/m" indicates information that is not meaningful, and all financial amounts are stated in millions of US dollars, unless otherwise noted.
About Nutrien
Nutrien is the world's largest provider of crop inputs and services, playing a critical role in helping growers increase food production in a sustainable manner. We produce and distribute approximately 27 million tonnes of potash, nitrogen and phosphate products world-wide. With this capability and our leading agriculture retail network, we are well positioned to supply the needs of our customers. We operate with a long-term view and are committed to working with our stakeholders as we address our economic, environmental and social priorities. The scale and diversity of our integrated portfolio provides a stable earnings base, multiple avenues for growth and the opportunity to return capital to shareholders.
Selected financial data for download can be found in our data tool at www.nutrien.com/investors/interactive-datatool
Such data is not incorporated by reference herein.
Nutrien will host a Conference Call on Tuesday, November 2, 2021 at 10:00 am Eastern Time.
- In order to expedite access to our conference call, each participant will be required to pre-register for the event:
- Online: https://www.directeventreg.com/registration/event/7287304 .
- Via Phone: 1-888-869-1189 Conference ID 7287304.
- Once the registration is complete, a confirmation will be sent providing the dial in number and both the Direct Event Passcode and your unique Registrant ID to join this call. For security reasons, please do not share your information with anyone else.
- Live Audio Webcast: Visit https://www.nutrien.com/investors/events/2021-q3-earnings-conference-call
Appendix A - Selected Additional Financial Data
| Selected Retail measures | Three Months Ended September 30 |
| Nine Months Ended September 30 | ||
|
| 2021 | 2020 |
| 2021 | 2020 |
| Proprietary products margin as a percentage of product line margin (%) |
|
|
|
|
|
| Crop nutrients | 26 | 33 |
| 24 | 27 |
| Crop protection products | 41 | 43 |
| 41 | 40 |
| Seed | 48 | n/m |
| 45 | 43 |
| All products 1 | 27 | 24 |
| 27 | 27 |
| Crop nutrients sales volumes (tonnes - thousands) |
|
|
|
|
|
| North America | 1,112 | 1,159 |
| 7,729 | 7,683 |
| International | 898 | 741 |
| 2,833 | 2,364 |
| Total | 2,010 | 1,900 |
| 10,562 | 10,047 |
| Crop nutrients selling price per tonne |
|
|
|
|
|
| North America | 602 | 413 |
| 510 | 423 |
| International | 585 | 407 |
| 464 | 356 |
| Total | 595 | 411 |
| 498 | 407 |
| Crop nutrients gross margin per tonne |
|
|
|
|
|
| North America | 147 | 116 |
| 127 | 102 |
| International | 95 | 61 |
| 67 | 47 |
| Total | 124 | 94 |
| 111 | 89 |
| 1 Certain immaterial figures have been reclassified for the three months ended September 30, 2020. | |||||
|
|
|
|
|
|
|
| Financial performance measures |
|
|
|
| 2021 |
| Retail adjusted EBITDA to sales ("Retail adjusted EBITDA margin") (%) 1 |
|
| 11 | ||
| Retail adjusted average working capital to sales (%) 1, 2 |
|
|
| 12 | |
| Retail adjusted average working capital to sales excluding Nutrien Financial (%) 1, 2 |
|
| (1) | ||
| Retail cash operating coverage ratio (%) 1, 2 |
|
|
| 59 | |
| Retail normalized comparable store sales (%) 2 |
|
|
| 5 | |
| Retail adjusted EBITDA per US selling location (thousands of US dollars) 1, 2 |
|
| 1,362 | ||
| Nutrien Financial net interest margin (%) 1, 2 |
|
|
| 6.4 | |
| 1 Rolling four quarters ended September 30, 2021. | |||||
| 2 See the "Non-IFRS Financial Measures" section. | |||||
| Nutrien Financial | As at September 30, 2021 | ||||||
| (millions of US dollars) | Current | past due | 31-90 days | >90 days | Gross | Allowance 1 | Net |
| North America | 2,351 | 47 | 36 | 62 | 2,496 | (28) | 2,468 |
| International | 258 | 15 | 17 | 64 | 354 | (2) | 352 |
| Nutrien Financial receivables | 2,609 | 62 | 53 | 126 | 2,850 | (30) | 2,820 |
| 1 Bad debt expense on the above receivables for the nine months ended September 30, 2021 was $9 million (2020 - $20 million) in the Retail segment. | |||||||
| Selected Nitrogen measures | Three Months Ended September 30 |
| Nine Months Ended September 30 | ||
|
| 2021 | 2020 |
| 2021 | 2020 |
| Sales volumes (tonnes - thousands) |
|
|
|
|
|
| Fertilizer | 1,320 | 1,426 |
| 4,450 | 5,010 |
| Industrial and feed | 1,201 | 977 |
| 3,440 | 3,111 |
| Net sales (millions of US dollars) |
|
|
|
|
|
| Fertilizer | 533 | 280 |
| 1,503 | 1,108 |
| Industrial and feed | 440 | 161 |
| 1,025 | 559 |
| Net selling price per tonne |
|
|
|
|
|
| Fertilizer | 404 | 196 |
| 338 | 221 |
| Industrial and feed | 366 | 166 |
| 298 | 180 |
| Production measures | Three Months Ended September 30 | Nine Months Ended September 30 | |||
|
| 2021 | 2020 | 2021 | 2020 | |
| Potash production (Product tonnes - thousands) | 3,199 | 3,430 | 10,149 | 9,811 | |
| Potash shutdown weeks 1 | 10 | 4 | 14 | 38 | |
| Ammonia production - total 2 | 1,414 | 1,413 | 4,355 | 4,479 | |
| Ammonia production - adjusted 2, 3 | 856 | 1,009 | 2,863 | 3,067 | |
| Ammonia operating rate (%) 3 | 77 | 91 | 87 | 93 | |
| P 2 O 5 production (P 2 O 5 tonnes - thousands) | 384 | 354 | 1,109 | 1,083 | |
| P 2 O 5 operating rate (%) | 90 | 83 | 87 | 85 | |
| 1 Represents weeks of full production shutdown, excluding the impact of any periods of reduced operating rates and planned routine annual maintenance shutdowns and announced workforce reductions. | |||||
| 2 All figures are provided on a gross production basis in thousands of product tonnes. | |||||
| 3 Excludes Trinidad and Joffre. | |||||
Appendix B - Non-IFRS Financial Measures
We use both IFRS and certain non-IFRS financial measures to assess performance. Non-IFRS financial measures are numerical measures of a company's historical or future financial performance, financial position or cash flow that are not specified, defined or determined under IFRS, and are not presented in our interim financial statements. Non-IFRS measures either exclude amounts that are included in, or include amounts that are excluded from, the most directly comparable measure specified, defined or determined in accordance with IFRS. In evaluating these measures, investors should consider that the methodology applied in calculating such measures may differ among companies and analysts.
Management believes the non-IFRS financial measures provide transparent and useful supplemental information to help investors evaluate our financial performance, financial condition and liquidity using the same measures as management. These non-IFRS financial measures should not be considered as a substitute for, or superior to, measures of financial performance prepared in accordance with IFRS.
The following section outlines our non-IFRS financial measures, their definitions, and why management uses each measure. It includes reconciliations to the most directly comparable IFRS measures. Except as otherwise described herein, our non-IFRS financial measures are calculated on a consistent basis from period to period and are adjusted for specific items in each period, as applicable. As non-recurring or unusual items arise, we generally exclude these items in our calculation of the applicable non-IFRS financial measure.
Adjusted EBITDA (Consolidated)
Most directly comparable IFRS financial measure: Net earnings (loss).
Definition: Adjusted EBITDA is calculated as net earnings (loss) before finance costs, income taxes, depreciation and amortization, certain integration and restructuring related costs, share-based compensation, impairment of assets, certain foreign exchange gain/loss (net of related derivatives), COVID-19 related expenses, cloud computing transition adjustment, loss on disposal of business, and net gain on disposal of investment in MOPCO. COVID-19 related expenses primarily consist of increased cleaning and sanitization costs, the purchase of personal protective equipment, discretionary supplemental employee costs and costs related to construction delays from access limitations and other government restrictions. Cloud computing transition adjustment relates to cloud computing costs in prior years that no longer qualify for capitalization based on an agenda decision issued by the IFRS Interpretations Committee in April 2021. In 2021, we amended our calculation of adjusted EBITDA to adjust for the impact of restructuring and related costs and cloud computing transition adjustment. There were no similar expenses in the comparative period.
Why we use the measure and why it is useful to investors: It is not impacted by long-term investment and financing decisions, but rather focuses on the performance of our day-to-day operations. It provides a measure of our ability to service debt and to meet other payment obligations.
|
| Three Months Ended September 30 |
| Nine Months Ended September 30 | ||
| (millions of US dollars) | 2021 | 2020 |
| 2021 | 2020 |
| Net earnings (loss) | 726 | (587) |
| 1,972 | 143 |
| Finance costs | 122 | 129 |
| 367 | 401 |
| Income tax expense (recovery) | 209 | (264) |
| 615 | (45) |
| Depreciation and amortization | 489 | 500 |
| 1,454 | 1,490 |
| EBITDA | 1,546 | (222) |
| 4,408 | 1,989 |
| Integration and restructuring related costs | 8 | 10 |
| 47 | 38 |
| Share-based compensation expense | 64 | 29 |
| 125 | 9 |
| Impairment of assets | 7 | 823 |
| 12 | 823 |
| COVID-19 related expenses | 16 | 11 |
| 34 | 30 |
| Foreign exchange loss, net of related derivatives | 1 | 13 |
| 1 | 4 |
| Loss on disposal of business | - | 6 |
| - | 6 |
| Cloud computing transition adjustment | - | - |
| 36 | - |
| Adjusted EBITDA | 1,642 | 670 |
| 4,663 | 2,899 |
Adjusted EBITDA (Consolidated), Adjusted Net Earnings Per Share and Sustaining Capital Expenditures Guidance
Adjusted EBITDA, adjusted net earnings per share and sustaining capital expenditures guidance are forward-looking non-IFRS financial measures. We do not provide a reconciliation of such forward-looking measures to the most directly comparable financial measures calculated and presented in accordance with IFRS due to unknown variables and the uncertainty related to future results. These unknown variables may include unpredictable transactions of significant value that may be inherently difficult to determine, without unreasonable efforts. Guidance for adjusted EBITDA and adjusted net earnings per share excludes the impacts of integration and restructuring related costs, share-based compensation, certain foreign exchange gain/loss (net of related derivatives), COVID-19 related expenses, and cloud computing transition adjustment. Guidance for sustaining capital expenditures includes anticipated expenditures required to sustain operations at existing levels and includes major repairs and maintenance and plant turnarounds.
Adjusted Net Earnings and Adjusted Net Earnings Per Share
Most directly comparable IFRS financial measure: Net earnings (loss) and net earnings (loss) per share.
Definition: Net earnings (loss) before certain integration and restructuring related costs, share-based compensation, certain foreign exchange gain/loss (net of related derivatives), COVID-19 related expenses (including those recorded under finance costs for managing our liquidity position in response to the COVID-19 pandemic in 2020), cloud computing transition adjustment, loss on disposal of business, net gain on disposal of investment in MOPCO and impairment of assets, net of tax. We generally apply the annual forecasted effective tax rate to our adjustments during the year and, at year-end, we apply the actual effective tax rate. If the effective tax rate is significantly different from our forecasted effective tax rate due to adjustments or discrete tax impacts, we apply a tax rate that excludes those items. For material adjustments, we apply a tax rate specific to the adjustment. In 2021, we amended our calculation of adjusted net earnings to adjust for the impact of restructuring and related costs and cloud computing transition adjustment. There were no similar expenses in the comparative period.
Why we use the measure and why it is useful to investors: Focuses on the performance of our day-to-day operations excluding the effects of non-operating items.
|
| Three Months Ended |
| Nine Months Ended | ||||||||
|
|
|
|
|
| Per |
|
|
|
|
| Per |
| (millions of US dollars, except as otherwise | Increases |
|
|
| Diluted |
| Increases |
|
|
| Diluted |
| noted) | (Decreases) |
| Post-Tax |
| Share |
| (Decreases) |
| Post-Tax |
| Share |
| Net earnings attributable to equity holders of Nutrien |
|
| 717 |
| 1.25 |
|
|
| 1,952 |
| 3.41 |
| Adjustments: |
|
|
|
|
|
|
|
|
|
|
|
| Integration and restructuring related costs | 8 |
| 6 |
| 0.01 |
| 47 |
| 35 |
| 0.06 |
| Share-based compensation expense | 64 |
| 48 |
| 0.09 |
| 125 |
| 94 |
| 0.16 |
| Impairment of assets | 7 |
| 5 |
| 0.01 |
| 12 |
| 9 |
| 0.02 |
| COVID-19 related expenses | 16 |
| 12 |
| 0.02 |
| 34 |
| 26 |
| 0.05 |
| Foreign exchange loss, net of related derivatives | 1 |
| 1 |
| - |
| 1 |
| 1 |
| - |
| Cloud computing transition adjustment | - |
| - |
| - |
| 36 |
| 27 |
| 0.05 |
| Adjusted net earnings |
|
| 789 |
| 1.38 |
|
|
| 2,144 |
| 3.75 |
Free Cash Flow and Free Cash Flow Including Changes in Non-Cash Operating Working Capital
Most directly comparable IFRS financial measure: Cash from operations before working capital changes.
Definition: Cash from operations before working capital changes less sustaining capital expenditures. We also calculate a similar measure that includes changes in non-cash operating working capital.
Why we use the measure and why it is useful to investors: For evaluation of liquidity and financial strength. These are also useful as indicators of our ability to service debt, meet other payment obligations and make strategic investments. These do not represent residual cash flow available for discretionary expenditures.
|
| Three Months Ended September 30 |
| Nine Months Ended September 30 | ||
| (millions of US dollars) | 2021 | 2020 |
| 2021 | 2020 |
| Cash from operations before working capital changes | 1,187 | 483 |
| 3,544 | 2,145 |
| Sustaining capital expenditures | (325) | (203) |
| (793) | (511) |
| Free cash flow | 862 | 280 |
| 2,751 | 1,634 |
| Changes in non-cash operating working capital | (2,752) | (1,168) |
| (3,295) | (1,600) |
| Free cash flow including changes in non-cash operating working capital | (1,890) | (888) |
| (544) | 34 |
Potash Cash Cost of Product Manufactured ("COPM")
Most directly comparable IFRS financial measure: Cost of goods sold ("COGS") for the Potash segment.
Definition: Potash COGS for the period excluding depreciation and amortization expense and inventory and other adjustments divided by the production tonnes for the period.
Why we use the measure and why it is useful to investors: To assess operational performance. Potash cash COPM excludes the effects of production from other periods and long-term investment decisions, supporting a focus on the performance of our day-to-day operations.
|
| Three Months Ended September 30 |
| Nine Months Ended September 30 | ||
| (millions of US dollars, except as otherwise noted) | 2021 | 2020 |
| 2021 | 2020 |
| Total COGS - Potash | 372 | 303 |
| 980 | 878 |
| Change in inventory | (58) | 4 |
| (42) | (28) |
| Other adjustments | (1) | - |
| (7) | (5) |
| COPM | 313 | 307 |
| 931 | 845 |
| Depreciation and amortization included in COPM | (101) | (124) |
| (315) | (305) |
| Cash COPM | 212 | 183 |
| 616 | 540 |
| Production tonnes (tonnes - thousands) | 3,199 | 3,430 |
| 10,149 | 9,811 |
| Potash cash COPM per tonne | 66 | 53 |
| 61 | 55 |
Ammonia Controllable Cash COPM
Most directly comparable IFRS financial measure: COGS for the Nitrogen segment.
Definition: The total of COGS for the Nitrogen segment excluding depreciation and amortization expense included in COGS, cash COGS for products other than ammonia, other adjustments, and natural gas and steam costs, divided by net ammonia production tonnes.
Why we use the measure and why it is useful to investors: To assess operational performance. Ammonia controllable cash COPM excludes the effects of production from other periods, the costs of natural gas and steam, and long-term investment decisions, supporting a focus on the performance of our day-to-day operations.
|
| Three Months Ended September 30 |
| Nine Months Ended September 30 | ||
| (millions of US dollars, except as otherwise noted) | 2021 | 2020 |
| 2021 | 2020 |
| Total COGS - Nitrogen | 695 | 482 |
| 2,068 | 1,708 |
| Depreciation and amortization in COGS | (105) | (113) |
| (347) | (395) |
| Cash COGS for products other than ammonia | (380) | (287) |
| (1,221) | (1,017) |
| Ammonia |
|
|
|
|
|
| Total cash COGS before other adjustments | 210 | 82 |
| 500 | 296 |
| Other adjustments 1 | (36) | (11) |
| (66) | (46) |
| Total cash COPM | 174 | 71 |
| 434 | 250 |
| Natural gas and steam costs | (137) | (45) |
| (329) | (164) |
| Controllable cash COPM | 37 | 26 |
| 105 | 86 |
| Production tonnes (net tonnes 2 - thousands) | 706 | 557 |
| 2,011 | 1,945 |
| Ammonia controllable cash COPM per tonne | 53 | 47 |
| 52 | 44 |
| 1 Includes changes in inventory balances and other adjustments. | |||||
| 2 Ammonia tonnes available for sale, as not upgraded to other Nitrogen products. | |||||
Gross Margin Excluding Depreciation and Amortization Per Tonne - Manufactured
Most directly comparable IFRS financial measure: Gross margin.
Definition: Gross margin from manufactured products per tonne less depreciation and amortization per tonne. Reconciliations are provided in the "Segment Results" section.
Why we use the measure and why it is useful to investors: Focuses on the performance of our day-to-day operations, which excludes the effects of items that primarily reflect the impact of long-term investment and financing decisions.
Retail Adjusted Average Working Capital to Sales and Retail Adjusted Average Working Capital to Sales Excluding Nutrien Financial
Most directly comparable IFRS financial measure: (Current assets minus current liabilities for Retail) divided by Retail sales.
Definition: Retail adjusted average working capital divided by Retail adjusted sales for the last four rolling quarters. We exclude in our calculations the working capital and sales of certain acquisitions during the first year following the acquisition. We amended our calculation to adjust for the sales of certain recently acquired businesses. We also look at this metric excluding the sales and working capital of Nutrien Financial.
Why we use the measure and why it is useful to investors: To evaluate operational efficiency. A lower or higher percentage represents increased or decreased efficiency, respectively. The metric excluding Nutrien Financial shows the impact that the working capital of Nutrien Financial has on the ratio.
|
| Rolling four quarters ended September 30, 2021 | ||||||||
| (millions of US dollars, except as otherwise noted) | Q4 2020 |
| Q1 2021 |
| Q2 2021 |
| Q3 2021 |
| Average/Total |
| Working capital | 1,157 |
| 1,630 |
| 1,348 |
| 3,883 |
|
|
| Working capital from certain recent acquisitions | - |
| - |
| - |
| - |
|
|
| Adjusted working capital | 1,157 |
| 1,630 |
| 1,348 |
| 3,883 |
| 2,005 |
| Nutrien Financial working capital | (1,392) |
| (1,221) |
| (3,072) |
| (2,820) |
|
|
| Adjusted working capital excluding Nutrien Financial | (235) |
| 409 |
| (1,724) |
| 1,063 |
| (121) |
|
|
|
|
|
|
|
|
|
|
|
| Sales | 2,618 |
| 2,972 |
| 7,537 |
| 3,347 |
|
|
| Sales from certain recent acquisitions | - |
| - |
| - |
| - |
|
|
| Adjusted sales | 2,618 |
| 2,972 |
| 7,537 |
| 3,347 |
| 16,474 |
| Nutrien Financial revenue | (37) |
| (25) |
| (59) |
| (54) |
|
|
| Adjusted sales excluding Nutrien Financial | 2,581 |
| 2,947 |
| 7,478 |
| 3,293 |
| 16,299 |
|
|
|
|
|
|
|
|
|
|
|
| Adjusted average working capital to sales (%) |
|
|
|
|
|
|
|
| 12 |
| Adjusted average working capital to sales excluding Nutrien Financial (%) |
|
|
| (1) | |||||
Nutrien Financial Net Interest Margin
Most directly comparable IFRS financial measure: Nutrien Financial gross margin divided by average Nutrien Financial receivables.
Definition: Nutrien Financial revenue less deemed interest expense divided by average Nutrien Financial receivables outstanding for the last four rolling quarters.
Why we use the measure and why it is useful to investors: Used by credit rating agencies and other users to evaluate financial performance of Nutrien Financial.
|
| Rolling four quarters ended September 30, 2021 | ||||||||
| (millions of US dollars, except as otherwise noted) | Q4 2020 |
| Q1 2021 |
| Q2 2021 |
| Q3 2021 |
| Total/Average |
| Nutrien Financial revenue | 37 |
| 25 |
| 59 |
| 54 |
|
|
| Deemed interest expense 1 | (14) |
| (6) |
| (8) |
| (10) |
|
|
| Net interest | 23 |
| 19 |
| 51 |
| 44 |
| 137 |
|
|
|
|
|
|
|
|
|
|
|
| Average Nutrien Financial receivables | 1,392 |
| 1,221 |
| 3,072 |
| 2,820 |
| 2,126 |
| Nutrien Financial net interest margin (%) |
|
|
|
|
|
|
|
| 6.4 |
| 1 Average borrowing rate applied to the notional debt required to fund the portfolio of receivables from customers monitored and serviced by Nutrien Financial. | |||||||||
Retail Cash Operating Coverage Ratio
Most directly comparable IFRS financial measure: Retail operating expenses as a percentage of Retail gross margin.
Definition: Retail operating expenses, excluding depreciation and amortization expense, divided by Retail gross margin excluding depreciation and amortization expense in cost of goods sold, for the last four rolling quarters.
Why we use the measure and why it is useful to investors: To understand the costs and underlying economics of our Retail operations and to assess our Retail operating performance and ability to generate free cash flow.
|
| Rolling four quarters ended September 30, 2021 | ||||||||
| (millions of US dollars, except as otherwise noted) | Q4 2020 |
| Q1 2021 |
| Q2 2021 |
| Q3 2021 |
| Total |
| Operating expenses 1 | 768 |
| 721 |
| 938 |
| 808 |
| 3,235 |
| Depreciation and amortization in operating expenses | (177) |
| (175) |
| (166) |
| (180) |
| (698) |
| Operating expenses excluding depreciation and amortization | 591 |
| 546 |
| 772 |
| 628 |
| 2,537 |
|
|
|
|
|
|
|
|
|
|
|
| Gross margin | 885 |
| 652 |
| 1,858 |
| 917 |
| 4,312 |
| Depreciation and amortization in cost of goods sold | 3 |
| 2 |
| 3 |
| 2 |
| 10 |
| Gross margin excluding depreciation and amortization | 888 |
| 654 |
| 1,861 |
| 919 |
| 4,322 |
| Cash operating coverage ratio (%) |
|
|
|
|
|
|
|
| 59 |
| 1 Includes Retail expenses below gross margin including selling expenses, general and administrative expenses and other (income) expenses. | |||||||||
Retail Adjusted EBITDA per US Selling Location
Most directly comparable IFRS financial measure: Retail US adjusted EBITDA.
Definition: Total Retail US adjusted EBITDA for the last four rolling quarters, adjusted for acquisitions in those quarters, divided by the number of US locations that have generated sales in the last four rolling quarters, adjusted for acquired locations.
Why we use the measure and why it is useful to investors: To assess our US Retail operating performance. This measure includes locations we have owned for more than 12 months.
|
| Rolling four quarters ended September 30, 2021 | ||||||||
| (millions of US dollars, except as otherwise noted) | Q4 2020 |
| Q1 2021 |
| Q2 2021 |
| Q3 2021 |
| Total |
| Adjusted US EBITDA | 177 |
| 29 |
| 847 |
| 146 |
| 1,199 |
| Adjustments for acquisitions |
|
|
|
|
|
|
|
| (5) |
| Adjusted US EBITDA adjusted for acquisitions |
|
|
|
|
|
|
|
| 1,194 |
| Number of US selling locations adjusted for acquisitions |
|
|
|
|
|
|
|
| 877 |
| Adjusted EBITDA per US selling location (thousands of US dollars) |
|
|
|
|
|
|
| 1,362 | |
Retail Normalized Comparable Store Sales
Most directly comparable IFRS financial measure: Retail sales from comparable base as a component of total Retail sales.
Definition: Prior year comparable store sales adjusted for published potash, nitrogen and phosphate benchmark prices and foreign exchange rates used in the current year. We retain sales of closed locations in the comparable base if the closed location is in close proximity to an existing location, unless we plan to exit the market area or are unable to economically or logistically serve it. We do not adjust for temporary closures, expansions or renovations of stores.
Why we use the measure and why it is useful to investors: To evaluate sales growth by adjusting for fluctuations in commodity prices and foreign exchange rates. Includes locations we have owned for more than 12 months.
|
| Nine Months Ended September 30 |
| (millions of US dollars, except as otherwise noted) | 2021 |
| Sales from comparable base |
|
| Current period | 13,671 |
| Prior period 1 | 11,783 |
| Comparable store sales (%) | 16 |
| Prior period normalized for benchmark prices and foreign exchange rates 1 | 12,988 |
| Normalized comparable store sales (%) | 5 |
| 1 Restated by $384 million to reflect the impacts of the Australian livestock export business divestiture and a change in revenue recognition treatment as a result of certain contract term revisions. | |
Condensed Consolidated Financial Statements
Unaudited in millions of US dollars except as otherwise noted
Condensed Consolidated Statements of Earnings (Loss)
|
|
| Three Months Ended |
| Nine Months Ended | ||||
|
|
| September 30 |
| September 30 | ||||
|
| Note | 2021 |
| 2020 |
| 2021 |
| 2020 |
|
|
|
|
| Note 1 |
|
|
| Note 1 |
| SALES | 2 | 6,024 |
| 4,227 |
| 20,445 |
| 16,856 |
| Freight, transportation and distribution |
| 220 |
| 204 |
| 653 |
| 653 |
| Cost of goods sold |
| 3,639 |
| 3,004 |
| 13,589 |
| 12,129 |
| GROSS MARGIN |
| 2,165 |
| 1,019 |
| 6,203 |
| 4,074 |
| Selling expenses |
| 749 |
| 676 |
| 2,287 |
| 2,081 |
| General and administrative expenses |
| 110 |
| 107 |
| 329 |
| 312 |
| Provincial mining taxes |
| 128 |
| 58 |
| 293 |
| 163 |
| Share-based compensation expense |
| 64 |
| 29 |
| 125 |
| 9 |
| Impairment of assets | 2 | 7 |
| 823 |
| 12 |
| 823 |
| Other expenses | 3 | 50 |
| 48 |
| 203 |
| 187 |
| EARNINGS (LOSS) BEFORE FINANCE COSTS AND INCOME TAXES | 1,057 |
| (722) |
| 2,954 |
| 499 | |
| Finance costs |
| 122 |
| 129 |
| 367 |
| 401 |
| EARNINGS (LOSS) BEFORE INCOME TAXES |
| 935 |
| (851) |
| 2,587 |
| 98 |
| Income tax expense (recovery) | 4 | 209 |
| (264) |
| 615 |
| (45) |
| NET EARNINGS (LOSS) |
| 726 |
| (587) |
| 1,972 |
| 143 |
| Attributable to |
|
|
|
|
|
|
|
|
| Equity holders of Nutrien |
| 717 |
| (587) |
| 1,952 |
| 143 |
| Non-controlling interest |
| 9 |
| - |
| 20 |
| - |
| NET EARNINGS (LOSS) |
| 726 |
| (587) |
| 1,972 |
| 143 |
|
|
|
|
|
|
|
|
|
|
| NET EARNINGS (LOSS) PER SHARE ATTRIBUTABLE TO EQUITY HOLDERS OF NUTRIEN ("EPS") | ||||||||
| Basic |
| 1.26 |
| (1.03) |
| 3.42 |
| 0.25 |
| Diluted |
| 1.25 |
| (1.03) |
| 3.41 |
| 0.25 |
| Weighted average shares outstanding for basic EPS |
| 570,627,000 |
| 569,146,000 |
| 570,216,000 |
| 569,818,000 |
| Weighted average shares outstanding for diluted EPS |
| 572,224,000 |
| 569,146,000 |
| 571,735,000 |
| 569,818,000 |
|
|
|
|
|
|
|
|
|
|
Condensed Consolidated Statements of Comprehensive Income (Loss)
|
| Three Months Ended |
| Nine Months Ended | ||||
|
| September 30 |
| September 30 | ||||
| (Net of related income taxes) | 2021 |
| 2020 |
| 2021 |
| 2020 |
| NET EARNINGS (LOSS) | 726 |
| (587) |
| 1,972 |
| 143 |
| Other comprehensive (loss) income |
|
|
|
|
|
|
|
| Items that will not be reclassified to net earnings (loss): |
|
|
|
|
|
|
|
| Net actuarial gain on defined benefit plans | - |
| - |
| - |
| 3 |
| Net fair value gain (loss) on investments | 46 |
| (4) |
| 116 |
| (25) |
| Items that have been or may be subsequently reclassified to net earnings (loss): |
|
|
|
|
|
|
|
| (Loss) gain on currency translation of foreign operations | (124) |
| 69 |
| (129) |
| (52) |
| Other | (1) |
| 6 |
| 19 |
| (12) |
| OTHER COMPREHENSIVE (LOSS) INCOME | (79) |
| 71 |
| 6 |
| (86) |
| COMPREHENSIVE INCOME (LOSS) | 647 |
| (516) |
| 1,978 |
| 57 |
| Attributable to |
|
|
|
|
|
|
|
| Equity holders of Nutrien | 638 |
| (516) |
| 1,959 |
| 57 |
| Non-controlling interest | 9 |
| - |
| 19 |
| - |
| COMPREHENSIVE INCOME (LOSS) | 647 |
| (516) |
| 1,978 |
| 57 |
|
|
|
|
|
|
|
|
|
| (See Notes to the Condensed Consolidated Financial Statements) | |||||||
Condensed Consolidated Statements of Cash Flows
|
|
| Three Months Ended |
| Nine Months Ended | ||||
|
|
| September 30 |
| September 30 | ||||
|
| Note | 2021 |
| 2020 |
| 2021 |
| 2020 |
|
|
|
|
|
|
|
|
|
|
| OPERATING ACTIVITIES |
|
|
|
|
|
|
|
|
| Net earnings (loss) |
| 726 |
| (587) |
| 1,972 |
| 143 |
| Adjustments for: |
|
|
|
|
|
|
|
|
| Depreciation and amortization |
| 489 |
| 500 |
| 1,454 |
| 1,490 |
| Share-based compensation expense |
| 64 |
| 29 |
| 125 |
| 9 |
| Impairment of assets | 2 | 7 |
| 823 |
| 12 |
| 823 |
| Recovery of deferred income tax |
| (87) |
| (161) |
| (97) |
| (99) |
| Cloud computing transition adjustment | 3 | - |
| - |
| 36 |
| - |
| Other long-term assets, liabilities and miscellaneous |
| (12) |
| (121) |
| 42 |
| (221) |
| Cash from operations before working capital changes |
| 1,187 |
| 483 |
| 3,544 |
| 2,145 |
| Changes in non-cash operating working capital: |
|
|
|
|
|
|
|
|
| Receivables |
| (266) |
| 692 |
| (3,101) |
| (1,455) |
| Inventories |
| 130 |
| 407 |
| 193 |
| 1,153 |
| Prepaid expenses and other current assets |
| (133) |
| (77) |
| 865 |
| 936 |
| Payables and accrued charges |
| (2,483) |
| (2,190) |
| (1,252) |
| (2,234) |
| CASH (USED IN) PROVIDED BY OPERATING ACTIVITIES |
| (1,565) |
| (685) |
| 249 |
| 545 |
| INVESTING ACTIVITIES |
|
|
|
|
|
|
|
|
| Capital expenditures 1 |
| (474) |
| (285) |
| (1,215) |
| (1,014) |
| Business acquisitions, net of cash acquired |
| (30) |
| (43) |
| (70) |
| (216) |
| Other |
| (19) |
| (28) |
| (57) |
| 21 |
| CASH USED IN INVESTING ACTIVITIES |
| (523) |
| (356) |
| (1,342) |
| (1,209) |
| FINANCING ACTIVITIES |
|
|
|
|
|
|
|
|
| Transaction costs related to debt |
| - |
| - |
| (7) |
| (15) |
| Proceeds from short-term debt, net |
| 1,040 |
| 397 |
| 1,037 |
| 601 |
| Proceeds from long-term debt |
| 81 |
| 14 |
| 89 |
| 1,520 |
| Repayment of long-term debt |
| - |
| - |
| (5) |
| (507) |
| Repayment of principal portion of lease liabilities |
| (78) |
| (69) |
| (242) |
| (203) |
| Dividends paid to Nutrien's shareholders | 6 | (261) |
| (257) |
| (779) |
| (771) |
| Repurchase of common shares | 6 | (148) |
| - |
| (150) |
| (160) |
| Issuance of common shares |
| 125 |
| - |
| 188 |
| - |
| Other |
| (2) |
| - |
| (14) |
| - |
| CASH PROVIDED BY FINANCING ACTIVITIES |
| 757 |
| 85 |
| 117 |
| 465 |
| EFFECT OF EXCHANGE RATE CHANGES ON CASH AND CASH EQUIVALENTS |
| (20) |
| 6 |
| (35) |
| (7) |
| DECREASE IN CASH AND CASH EQUIVALENTS |
| (1,351) |
| (950) |
| (1,011) |
| (206) |
| CASH AND CASH EQUIVALENTS – BEGINNING OF PERIOD |
| 1,794 |
| 1,415 |
| 1,454 |
| 671 |
| CASH AND CASH EQUIVALENTS – END OF PERIOD |
| 443 |
| 465 |
| 443 |
| 465 |
| Cash and cash equivalents comprised of: |
|
|
|
|
|
|
|
|
| Cash |
| 315 |
| 328 |
| 315 |
| 328 |
| Short-term investments |
| 128 |
| 137 |
| 128 |
| 137 |
|
|
| 443 |
| 465 |
| 443 |
| 465 |
| SUPPLEMENTAL CASH FLOWS INFORMATION |
|
|
|
|
|
|
|
|
| Interest paid |
| 81 |
| 85 |
| 319 |
| 334 |
| Income taxes paid |
| 212 |
| 27 |
| 356 |
| 92 |
| Total cash outflow for leases |
| 91 |
| 78 |
| 299 |
| 266 |
| 1 Includes additions to property, plant and equipment and intangible assets for the three months ended September 30, 2021 of $445 and $29 (2020 - $266 and $19), respectively, and for the nine months ended September 30, 2021 of $1,148 and $67 (2020 - $927 and $87), respectively. | ||||||||
|
| ||||||||
| (See Notes to the Condensed Consolidated Financial Statements) | ||||||||
Condensed Consolidated Statements of Changes in Shareholders' Equity
|
|
|
|
| Accumulated Other Comprehensive (Loss) Income ("AOCI") |
|
|
|
| |||||||||||||||||||||
|
|
|
|
|
| Net |
|
|
|
|
| |||||||||||||||||||
|
|
|
|
|
| Actuarial | Loss on |
|
|
| Equity |
|
| |||||||||||||||||
|
|
|
|
| Net Fair Value | Gain on | Currency |
|
|
| Holders | Non- |
| |||||||||||||||||
|
| Number of |
|
| (Loss) Gain | Defined | Translation |
|
|
| of | Controlling |
| |||||||||||||||||
|
| Common | Share | Contributed | on | Benefit | of Foreign |
| Total | Retained | Nutrien | Interest | Total | |||||||||||||||||
|
| Shares | Capital | Surplus | Investments | Plans 1 | Operations | Other | AOCI | Earnings | (Note 1) | (Note 1) | Equity | |||||||||||||||||
| BALANCE – DECEMBER 31, 2019 | 572,942,809 | 15,771 | 248 | (29) | - | (204) | (18) | (251) | 7,101 | 22,869 | 38 | 22,907 | |||||||||||||||||
| Net earnings | - | - | - | - | - | - | - | - | 143 | 143 | - | 143 | |||||||||||||||||
| Other comprehensive (loss) income | - | - | - | (25) | 3 | (52) | (12) | (86) | - | (86) | - | (86) | |||||||||||||||||
| Shares repurchased (Note 6) | (3,832,580) | (105) | (55) | - | - | - | - | - | - | (160) | - | (160) | |||||||||||||||||
| Dividends declared | - | - | - | - | - | - | - | - | (770) | (770) | - | (770) | |||||||||||||||||
| Effect of share-based | |||||||||||||||||||||||||||||
| compensation including | |||||||||||||||||||||||||||||
| issuance of common shares | 35,706 | 1 | 10 | - | - | - | - | - | - | 11 | - | 11 | |||||||||||||||||
| Transfer of net loss on | |||||||||||||||||||||||||||||
| cash flow hedges | - | - | - | - | - | - | 13 | 13 | - | 13 | - | 13 | |||||||||||||||||
| Transfer of net actuarial gain | |||||||||||||||||||||||||||||
| on defined benefit plans | - | - | - | - | (3) | - | - | (3) | 3 | - | - | - | |||||||||||||||||
| BALANCE – SEPTEMBER 30, 2020 | 569,145,935 | 15,667 | 203 | (54) | - | (256) | (17) | (327) | 6,477 | 22,020 | 38 | 22,058 | |||||||||||||||||
| BALANCE – DECEMBER 31, 2020 | 569,260,406 | 15,673 | 205 | (36) | - | (62) | (21) | (119) | 6,606 | 22,365 | 38 | 22,403 | |||||||||||||||||
| Net earnings | - | - | - | - | - | - | - | - | 1,952 | 1,952 | 20 | 1,972 | |||||||||||||||||
| Other comprehensive income (loss) | - | - | - | 116 | - | (128) | 19 | 7 | - | 7 | (1) | 6 | |||||||||||||||||
| Shares repurchased (Note 6) | (2,460,097) | (68) | (46) | - | - | - | - | - | (36) | (150) | - | (150) | |||||||||||||||||
| Dividends declared | - | - | - | - | - | - | - | - | (786) | (786) | - | (786) | |||||||||||||||||
| Non-controlling interest transactions | - | - | - | - | - | - | - | - | (1) | (1) | (14) | (15) | |||||||||||||||||
| Effect of share-based | |||||||||||||||||||||||||||||
| compensation including | |||||||||||||||||||||||||||||
| issuance of common shares | 4,166,620 | 213 | (12) | - | - | - | - | - | - | 201 | - | 201 | |||||||||||||||||
| Transfer of net gain on | |||||||||||||||||||||||||||||
| cash flow hedges | - | - | - | - | - | - | (10) | (10) | - | (10) | - | (10) | |||||||||||||||||
| Share cancellation (Note 6) | (210,173) | - | - | - | - | - | - | - | - | - | - | - | |||||||||||||||||
| BALANCE – SEPTEMBER 30, 2021 | 570,756,756 | 15,818 | 147 | 80 | - | (190) | (12) | (122) | 7,735 | 23,578 | 43 | 23,621 | |||||||||||||||||
| 1 Any amounts incurred during a period were transferred to retained earnings at each period-end. Therefore, no balance exists at the beginning or end of period. | |||||||||||||||||||||||||||||
|
|
|
|
|
|
|
|
|
|
|
|
|
| |||||||||||||||||
| (See Notes to the Condensed Consolidated Financial Statements) | |||||||||||||||||||||||||||||
Condensed Consolidated Balance Sheets
|
|
| September 30 |
| December 31 | ||
| As at | Note | 2021 |
| 2020 |
| 2020 |
|
|
|
|
| Note 1 |
| Note 1 |
| ASSETS |
|
|
|
|
|
|
| Current assets |
|
|
|
|
|
|
| Cash and cash equivalents |
| 443 |
| 465 |
| 1,454 |
| Receivables |
| 6,911 |
| 5,087 |
| 3,626 |
| Inventories |
| 4,674 |
| 3,829 |
| 4,930 |
| Prepaid expenses and other current assets |
| 654 |
| 500 |
| 1,460 |
|
|
| 12,682 |
| 9,881 |
| 11,470 |
| Non-current assets |
|
|
|
|
|
|
| Property, plant and equipment |
| 19,704 |
| 19,308 |
| 19,660 |
| Goodwill |
| 12,220 |
| 12,179 |
| 12,198 |
| Other intangible assets |
| 2,349 |
| 2,352 |
| 2,388 |
| Investments |
| 682 |
| 809 |
| 562 |
| Other assets |
| 679 |
| 742 |
| 914 |
| TOTAL ASSETS |
| 48,316 |
| 45,271 |
| 47,192 |
| LIABILITIES |
|
|
|
|
|
|
| Current liabilities |
|
|
|
|
|
|
| Short-term debt |
| 1,255 |
| 1,644 |
| 159 |
| Current portion of long-term debt |
| 46 |
| - |
| 14 |
| Current portion of lease liabilities |
| 281 |
| 230 |
| 249 |
| Payables and accrued charges |
| 6,930 |
| 5,239 |
| 8,058 |
|
|
| 8,512 |
| 7,113 |
| 8,480 |
| Non-current liabilities |
|
|
|
|
|
|
| Long-term debt |
| 10,094 |
| 10,041 |
| 10,047 |
| Lease liabilities |
| 896 |
| 847 |
| 891 |
| Deferred income tax liabilities | 4 | 3,043 |
| 3,053 |
| 3,149 |
| Pension and other post-retirement benefit liabilities |
| 451 |
| 446 |
| 454 |
| Asset retirement obligations and accrued environmental costs |
| 1,523 |
| 1,575 |
| 1,597 |
| Other non-current liabilities |
| 176 |
| 138 |
| 171 |
| TOTAL LIABILITIES |
| 24,695 |
| 23,213 |
| 24,789 |
| SHAREHOLDERS' EQUITY |
|
|
|
|
|
|
| Share capital | 6 | 15,818 |
| 15,667 |
| 15,673 |
| Contributed surplus |
| 147 |
| 203 |
| 205 |
| Accumulated other comprehensive loss |
| (122) |
| (327) |
| (119) |
| Retained earnings |
| 7,735 |
| 6,477 |
| 6,606 |
| Equity holders of Nutrien |
| 23,578 |
| 22,020 |
| 22,365 |
| Non-controlling interest |
| 43 |
| 38 |
| 38 |
| TOTAL SHAREHOLDERS' EQUITY |
| 23,621 |
| 22,058 |
| 22,403 |
| TOTAL LIABILITIES AND SHAREHOLDERS' EQUITY |
| 48,316 |
| 45,271 |
| 47,192 |
|
|
|
|
|
|
|
|
| (See Notes to the Condensed Consolidated Financial Statements) | ||||||
Notes to the Condensed Consolidated Financial Statements
As at and for the Three and Nine Months Ended September 30, 2021
NOTE 1 BASIS OF PRESENTATION
Nutrien Ltd. (collectively with its subsidiaries, known as "Nutrien", "we", "us", "our" or "the Company") is the world's largest provider of crop inputs and services. Nutrien plays a critical role in helping growers around the globe increase food production in a sustainable manner.
These unaudited interim condensed consolidated financial statements ("interim financial statements") are based on International Financial Reporting Standards ("IFRS") as issued by the International Accounting Standards Board and have been prepared in accordance with International Accounting Standard 34, "Interim Financial Reporting". The accounting policies and methods of computation used in preparing these interim financial statements are consistent with those used in the preparation of our 2020 annual consolidated financial statements except as disclosed in Note 3. These interim financial statements include the accounts of Nutrien and its subsidiaries; however, they do not include all disclosures normally provided in annual consolidated financial statements and should be read in conjunction with our 2020 annual consolidated financial statements.
Certain immaterial 2020 figures have been reclassified in the condensed consolidated statements of earnings, condensed consolidated statements of changes in shareholders' equity, condensed consolidated balance sheets and segment information.
In management's opinion, the interim financial statements include all adjustments necessary to fairly present such information in all material respects. Interim results are not necessarily indicative of the results expected for any other interim period or the fiscal year.
We prepare our interim financial statements in accordance with IFRS, which requires us to make judgments, assumptions and estimates in applying accounting policies. We have assessed our accounting estimates and other matters that require the use of forecasted financial information for the impacts arising from the novel coronavirus ("COVID-19") pandemic. The future assessment of these estimates, including expectations about the severity, duration and scope of the COVID-19 pandemic, could differ materially in future reporting periods. As a result of the COVID-19 pandemic, we incurred directly attributable and incremental COVID-19 related expenses in other expenses (Note 3).
These interim financial statements were authorized by the audit committee of the Board of Directors for issue on November 1, 2021.
NOTE 2 SEGMENT INFORMATION
The Company has four reportable operating segments: Nutrien Ag Solutions ("Retail"), Potash, Nitrogen and Phosphate. The Retail segment distributes crop nutrients, crop protection products, seed and merchandise, and it provides services directly to growers through a network of farm centers in North America, South America and Australia. The Potash, Nitrogen and Phosphate segments are differentiated by the chemical nutrient contained in the products that each produce.
|
|
| Three Months Ended September 30, 2021 | ||||||||||||
|
|
|
|
|
|
|
|
|
|
| Corporate |
|
|
|
|
|
|
| Retail |
| Potash |
| Nitrogen |
| Phosphate |
| and Others |
| Eliminations |
| Consolidated |
| Sales | – third party | 3,336 |
| 1,188 |
| 1,037 |
| 463 |
| - |
| - |
| 6,024 |
|
| – intersegment | 11 |
| 107 |
| 162 |
| 39 |
| - |
| (319) |
| - |
| Sales | – total | 3,347 |
| 1,295 |
| 1,199 |
| 502 |
| - |
| (319) |
| 6,024 |
| Freight, transportation and distribution | - |
| 107 |
| 98 |
| 54 |
| - |
| (39) |
| 220 | |
| Net sales | 3,347 |
| 1,188 |
| 1,101 |
| 448 |
| - |
| (280) |
| 5,804 | |
| Cost of goods sold | 2,430 |
| 372 |
| 695 |
| 340 |
| - |
| (198) |
| 3,639 | |
| Gross margin | 917 |
| 816 |
| 406 |
| 108 |
| - |
| (82) |
| 2,165 | |
| Selling expenses | 746 |
| 3 |
| 7 |
| 2 |
| (9) |
| - |
| 749 | |
| General and administrative expenses | 45 |
| 1 |
| 3 |
| 3 |
| 58 |
| - |
| 110 | |
| Provincial mining taxes | - |
| 128 |
| - |
| - |
| - |
| - |
| 128 | |
| Share-based compensation expense | - |
| - |
| - |
| - |
| 64 |
| - |
| 64 | |
| Impairment of assets | - |
| 7 |
| - |
| - |
| - |
| - |
| 7 | |
| Other expenses (income) | 17 |
| 7 |
| (11) |
| 7 |
| 30 |
| - |
| 50 | |
| Earnings (loss) before finance costs and income taxes | 109 |
| 670 |
| 407 |
| 96 |
| (143) |
| (82) |
| 1,057 | |
| Depreciation and amortization | 182 |
| 131 |
| 125 |
| 39 |
| 12 |
| - |
| 489 | |
| EBITDA 1 | 291 |
| 801 |
| 532 |
| 135 |
| (131) |
| (82) |
| 1,546 | |
| Integration and restructuring related costs | - |
| - |
| - |
| - |
| 8 |
| - |
| 8 | |
| Share-based compensation expense | - |
| - |
| - |
| - |
| 64 |
| - |
| 64 | |
| Impairment of assets | - |
| 7 |
| - |
| - |
| - |
| - |
| 7 | |
| COVID-19 related expenses | - |
| - |
| - |
| - |
| 16 |
| - |
| 16 | |
| Foreign exchange loss, net of related derivatives | - |
| - |
| - |
| - |
| 1 |
| - |
| 1 | |
| Adjusted EBITDA | 291 |
| 808 |
| 532 |
| 135 |
| (42) |
| (82) |
| 1,642 | |
| Assets – at September 30, 2021 | 21,389 |
| 12,412 |
| 10,464 |
| 1,503 |
| 3,094 |
| (546) |
| 48,316 | |
| 1 EBITDA is calculated as net earnings (loss) before finance costs, income taxes, and depreciation and amortization. | ||||||||||||||
|
|
| Three Months Ended September 30, 2020 | ||||||||||||
|
|
|
|
|
|
|
|
|
|
| Corporate |
|
|
|
|
|
|
| Retail |
| Potash |
| Nitrogen |
| Phosphate |
| and Others |
| Eliminations |
| Consolidated |
| Sales | – third party | 2,734 |
| 634 |
| 524 |
| 312 |
| 23 |
| - |
| 4,227 |
|
| – intersegment | 8 |
| 63 |
| 103 |
| 40 |
| - |
| (214) |
| - |
| Sales | – total | 2,742 |
| 697 |
| 627 |
| 352 |
| 23 |
| (214) |
| 4,227 |
| Freight, transportation and distribution | - |
| 106 |
| 87 |
| 60 |
| - |
| (49) |
| 204 | |
| Net sales | 2,742 |
| 591 |
| 540 |
| 292 |
| 23 |
| (165) |
| 4,023 | |
| Cost of goods sold | 2,059 |
| 303 |
| 482 |
| 293 |
| 20 |
| (153) |
| 3,004 | |
| Gross margin | 683 |
| 288 |
| 58 |
| (1) |
| 3 |
| (12) |
| 1,019 | |
| Selling expenses | 669 |
| 3 |
| 7 |
| 1 |
| (4) |
| - |
| 676 | |
| General and administrative expenses | 34 |
| 2 |
| 3 |
| 2 |
| 66 |
| - |
| 107 | |
| Provincial mining taxes | - |
| 58 |
| - |
| - |
| - |
| - |
| 58 | |
| Share-based compensation expense | - |
| - |
| - |
| - |
| 29 |
| - |
| 29 | |
| Impairment of assets | - |
| 22 |
| 27 |
| 769 |
| 5 |
| - |
| 823 | |
| Other (income) expenses | (12) |
| (1) |
| (16) |
| 10 |
| 67 |
| - |
| 48 | |
| (Loss) earnings before finance costs and income taxes | (8) |
| 204 |
| 37 |
| (783) |
| (160) |
| (12) |
| (722) | |
| Depreciation and amortization | 170 |
| 124 |
| 131 |
| 60 |
| 15 |
| - |
| 500 | |
| EBITDA | 162 |
| 328 |
| 168 |
| (723) |
| (145) |
| (12) |
| (222) | |
| Integration and restructuring related costs | - |
| - |
| - |
| - |
| 10 |
| - |
| 10 | |
| Share-based compensation expense | - |
| - |
| - |
| - |
| 29 |
| - |
| 29 | |
| Impairment of assets | - |
| 22 |
| 27 |
| 769 |
| 5 |
| - |
| 823 | |
| COVID-19 related expenses | - |
| - |
| - |
| - |
| 11 |
| - |
| 11 | |
| Foreign exchange loss, net of related derivatives | - |
| - |
| - |
| - |
| 13 |
| - |
| 13 | |
| Loss on disposal of business | - |
| - |
| - |
| - |
| 6 |
| - |
| 6 | |
| Adjusted EBITDA | 162 |
| 350 |
| 195 |
| 46 |
| (71) |
| (12) |
| 670 | |
| Assets – at December 31, 2020 ¹ | 20,526 |
| 11,707 |
| 10,077 |
| 1,388 |
| 3,917 |
| (423) |
| 47,192 | |
| 1 In 2021, certain assets related to transportation, distribution and logistics were reclassified under Corporate and Others as these are centrally managed. Comparative figures have been restated to reflect this change. Depreciation expense related to these assets are allocated to the rest of the segments based on usage. | ||||||||||||||
|
|
| Nine Months Ended September 30, 2021 | ||||||||||||
|
|
|
|
|
|
|
|
|
|
| Corporate |
|
|
|
|
|
|
| Retail |
| Potash |
| Nitrogen |
| Phosphate |
| and Others |
| Eliminations |
| Consolidated |
| Sales | – third party | 13,818 |
| 2,663 |
| 2,740 |
| 1,224 |
| - |
| - |
| 20,445 |
|
| – intersegment | 38 |
| 258 |
| 629 |
| 171 |
| - |
| (1,096) |
| - |
| Sales | – total | 13,856 |
| 2,921 |
| 3,369 |
| 1,395 |
| - |
| (1,096) |
| 20,445 |
| Freight, transportation and distribution | - |
| 305 |
| 329 |
| 159 |
| - |
| (140) |
| 653 | |
| Net sales | 13,856 |
| 2,616 |
| 3,040 |
| 1,236 |
| - |
| (956) |
| 19,792 | |
| Cost of goods sold | 10,429 |
| 980 |
| 2,068 |
| 978 |
| - |
| (866) |
| 13,589 | |
| Gross margin | 3,427 |
| 1,636 |
| 972 |
| 258 |
| - |
| (90) |
| 6,203 | |
| Selling expenses | 2,276 |
| 8 |
| 22 |
| 5 |
| (24) |
| - |
| 2,287 | |
| General and administrative expenses | 125 |
| 6 |
| 8 |
| 8 |
| 182 |
| - |
| 329 | |
| Provincial mining taxes | - |
| 293 |
| - |
| - |
| - |
| - |
| 293 | |
| Share-based compensation expense | - |
| - |
| - |
| - |
| 125 |
| - |
| 125 | |
| Impairment of assets | - |
| 7 |
| 5 |
| - |
| - |
| - |
| 12 | |
| Other expenses (income) | 66 |
| 19 |
| (36) |
| 13 |
| 141 |
| - |
| 203 | |
| Earnings (loss) before finance costs and income taxes | 960 |
| 1,303 |
| 973 |
| 232 |
| (424) |
| (90) |
| 2,954 | |
| Depreciation and amortization | 528 |
| 371 |
| 409 |
| 112 |
| 34 |
| - |
| 1,454 | |
| EBITDA | 1,488 |
| 1,674 |
| 1,382 |
| 344 |
| (390) |
| (90) |
| 4,408 | |
| Integration and restructuring related costs | 8 |
| - |
| - |
| - |
| 39 |
| - |
| 47 | |
| Share-based compensation expense | - |
| - |
| - |
| - |
| 125 |
| - |
| 125 | |
| Impairment of assets | - |
| 7 |
| 5 |
| - |
| - |
| - |
| 12 | |
| COVID-19 related expenses | - |
| - |
| - |
| - |
| 34 |
| - |
| 34 | |
| Foreign exchange loss, net of related derivatives | - |
| - |
| - |
| - |
| 1 |
| - |
| 1 | |
| Cloud computing transition adjustment | 1 |
| 2 |
| - |
| - |
| 33 |
| - |
| 36 | |
| Adjusted EBITDA | 1,497 |
| 1,683 |
| 1,387 |
| 344 |
| (158) |
| (90) |
| 4,663 | |
| Assets – at September 30, 2021 | 21,389 |
| 12,412 |
| 10,464 |
| 1,503 |
| 3,094 |
| (546) |
| 48,316 | |
|
|
| Nine Months Ended September 30, 2020 | ||||||||||||
|
|
|
|
|
|
|
|
|
|
| Corporate |
|
|
|
|
|
|
| Retail |
| Potash |
| Nitrogen |
| Phosphate |
| and Others |
| Eliminations |
| Consolidated |
| Sales | – third party | 12,140 |
| 1,798 |
| 1,925 |
| 923 |
| 70 |
| - |
| 16,856 |
|
| – intersegment | 27 |
| 191 |
| 481 |
| 146 |
| - |
| (845) |
| - |
| Sales | – total | 12,167 |
| 1,989 |
| 2,406 |
| 1,069 |
| 70 |
| (845) |
| 16,856 |
| Freight, transportation and distribution | - |
| 293 |
| 335 |
| 187 |
| - |
| (162) |
| 653 | |
| Net sales | 12,167 |
| 1,696 |
| 2,071 |
| 882 |
| 70 |
| (683) |
| 16,203 | |
| Cost of goods sold | 9,316 |
| 878 |
| 1,708 |
| 862 |
| 63 |
| (698) |
| 12,129 | |
| Gross margin | 2,851 |
| 818 |
| 363 |
| 20 |
| 7 |
| 15 |
| 4,074 | |
| Selling expenses | 2,068 |
| 7 |
| 19 |
| 4 |
| (17) |
| - |
| 2,081 | |
| General and administrative expenses | 102 |
| 5 |
| 7 |
| 7 |
| 191 |
| - |
| 312 | |
| Provincial mining taxes | - |
| 161 |
| 1 |
| - |
| 1 |
| - |
| 163 | |
| Share-based compensation expense | - |
| - |
| - |
| - |
| 9 |
| - |
| 9 | |
| Impairment of assets | - |
| 22 |
| 27 |
| 769 |
| 5 |
| - |
| 823 | |
| Other expenses (income) | 36 |
| 4 |
| (25) |
| 19 |
| 153 |
| - |
| 187 | |
| Earnings (loss) before finance costs and income taxes | 645 |
| 619 |
| 334 |
| (779) |
| (335) |
| 15 |
| 499 | |
| Depreciation and amortization | 488 |
| 329 |
| 453 |
| 179 |
| 41 |
| - |
| 1,490 | |
| EBITDA | 1,133 |
| 948 |
| 787 |
| (600) |
| (294) |
| 15 |
| 1,989 | |
| Integration and restructuring related costs | - |
| - |
| - |
| - |
| 38 |
| - |
| 38 | |
| Share-based compensation expense | - |
| - |
| - |
| - |
| 9 |
| - |
| 9 | |
| Impairment of assets | - |
| 22 |
| 27 |
| 769 |
| 5 |
| - |
| 823 | |
| COVID-19 related expenses | - |
| - |
| - |
| - |
| 30 |
| - |
| 30 | |
| Foreign exchange loss, net of related derivatives | - |
| - |
| - |
| - |
| 4 |
| - |
| 4 | |
| Loss on disposal of business | - |
| - |
| - |
| - |
| 6 |
| - |
| 6 | |
| Adjusted EBITDA | 1,133 |
| 970 |
| 814 |
| 169 |
| (202) |
| 15 |
| 2,899 | |
| Assets – at December 31, 2020 | 20,526 |
| 11,707 |
| 10,077 |
| 1,388 |
| 3,917 |
| (423) |
| 47,192 | |
During the three and nine months ended September 30, 2020, we recorded an impairment to our property, plant and equipment of $545 and $215 at our Aurora and White Springs cash-generating units ("CGUs"), respectively, due to lower long-term forecasted global phosphate prices. The Aurora CGU recoverable value was based on fair value less costs of disposal (a level 3 measurement) using after-tax discounted cash flows (using a five-year projection and a terminal year thereafter to the expected mine life), while the White Springs CGU recoverable value was based on value in use using pre-tax discounted cash flows until the end of the mine life. For additional information relating to the impairment see Note 13 of the 2020 annual consolidated financial statements.
During the nine months ended September 30, 2021, we recorded $12 (2020 – $63) of impairment losses relating to other non-current assets.
Presented below is revenue from contracts with customers disaggregated by product line or geographic location for each reportable segment.
|
| Three Months Ended |
| Nine Months Ended | ||||
|
| September 30 |
| September 30 | ||||
|
| 2021 |
| 2020 |
| 2021 |
| 2020 |
| Retail sales by product line |
|
|
|
|
|
|
|
| Crop nutrients | 1,194 |
| 780 |
| 5,255 |
| 4,092 |
| Crop protection products | 1,469 |
| 1,328 |
| 5,220 |
| 4,774 |
| Seed | 140 |
| 103 |
| 1,819 |
| 1,638 |
| Merchandise | 265 |
| 234 |
| 763 |
| 703 |
| Nutrien Financial | 54 |
| 36 |
| 138 |
| 92 |
| Services and other | 276 |
| 296 |
| 784 |
| 951 |
| Nutrien Financial elimination 1 | (51) |
| (35) |
| (123) |
| (83) |
|
| 3,347 |
| 2,742 |
| 13,856 |
| 12,167 |
| Potash sales by geography |
|
|
|
|
|
|
|
| Manufactured product |
|
|
|
|
|
|
|
| North America | 590 |
| 358 |
| 1,446 |
| 1,002 |
| Offshore 2 | 705 |
| 339 |
| 1,475 |
| 987 |
|
| 1,295 |
| 697 |
| 2,921 |
| 1,989 |
| Nitrogen sales by product line |
|
|
|
|
|
|
|
| Manufactured product |
|
|
|
|
|
|
|
| Ammonia | 401 |
| 129 |
| 994 |
| 576 |
| Urea | 339 |
| 214 |
| 985 |
| 780 |
| Solutions, nitrates and sulfates | 326 |
| 177 |
| 852 |
| 606 |
| Other nitrogen and purchased products | 133 |
| 107 |
| 538 |
| 444 |
|
| 1,199 |
| 627 |
| 3,369 |
| 2,406 |
| Phosphate sales by product line |
|
|
|
|
|
|
|
| Manufactured product |
|
|
|
|
|
|
|
| Fertilizer | 306 |
| 216 |
| 836 |
| 622 |
| Industrial and feed | 146 |
| 105 |
| 405 |
| 342 |
| Other phosphate and purchased products | 50 |
| 31 |
| 154 |
| 105 |
|
| 502 |
| 352 |
| 1,395 |
| 1,069 |
| 1 Represents elimination for the interest and service fees charged by Nutrien Financial to Retail branches. | |||||||
| 2 Relates to Canpotex Limited ("Canpotex") (Note 8). | |||||||
NOTE 3 OTHER EXPENSES (INCOME)
|
| Three Months Ended |
| Nine Months Ended | ||||
|
| September 30 |
| September 30 | ||||
|
| 2021 |
| 2020 |
| 2021 |
| 2020 |
| Integration and restructuring related costs | 8 |
| 10 |
| 47 |
| 38 |
| Foreign exchange loss, net of related derivatives | 1 |
| 14 |
| 4 |
| 1 |
| Earnings of equity-accounted investees | (21) |
| (23) |
| (43) |
| (46) |
| Bad debt expense (recovery) | 7 |
| (18) |
| 22 |
| 9 |
| COVID-19 related expenses | 16 |
| 11 |
| 34 |
| 30 |
| Loss on disposal of business | - |
| 6 |
| - |
| 6 |
| Cloud computing transition adjustment | - |
| - |
| 36 |
| - |
| Other expenses | 39 |
| 48 |
| 103 |
| 149 |
|
| 50 |
| 48 |
| 203 |
| 187 |
In the second quarter of 2021, the IFRS Interpretations Committee published a final agenda decision clarifying how to recognize certain configuration and customization expenditures related to cloud computing with retrospective application. Costs that do not meet the capitalization criteria should be expensed as incurred. We changed our accounting policy to align with the interpretation and previously capitalized costs that no longer qualify for capitalization were expensed in the current period since they were not material.
NOTE 4 INCOME TAXES
A separate estimated average annual effective income tax rate was determined for each taxing jurisdiction and applied individually to the interim period pre-tax earnings for each jurisdiction.
|
| Three Months Ended |
| Nine Months Ended | ||||
|
| September 30 |
| September 30 | ||||
|
| 2021 |
| 2020 |
| 2021 |
| 2020 |
| Income tax expense (recovery) | 209 |
| (264) |
| 615 |
| (45) |
| Actual effective tax rate on earnings (loss) (%) | 23 |
| 26 |
| 24 |
| 14 |
| Actual effective tax rate including discrete items (%) | 22 |
| 31 |
| 24 |
| (47) |
| Discrete tax adjustments that impacted the tax rate | (10) |
| (48) |
| (13) |
| (59) |
Income tax balances within the condensed consolidated balance sheets were comprised of the following:
| Income Tax Assets and Liabilities | Balance Sheet Location | As at September 30, 2021 |
| As at December 31, 2020 |
| Income tax assets |
|
|
|
|
| Current | Receivables | 343 |
| 83 |
| Non-current | Other assets | 88 |
| 305 |
| Deferred income tax assets | Other assets | 233 |
| 242 |
| Total income tax assets |
| 664 |
| 630 |
| Income tax liabilities |
|
|
|
|
| Current | Payables and accrued charges | 418 |
| 48 |
| Non-current | Other non-current liabilities | 43 |
| 40 |
| Deferred income tax liabilities | Deferred income tax liabilities | 3,043 |
| 3,149 |
| Total income tax liabilities | 3,504 |
| 3,237 |
NOTE 5 FINANCIAL INSTRUMENTS
Fair Value
Estimated fair values for financial instruments are designed to approximate amounts for which the instruments could be exchanged in a current arm's-length transaction between knowledgeable, willing parties. The valuation policies and procedures for financial reporting purposes are determined by our finance department. There have been no changes to our valuation methods presented in Note 10 of the 2020 annual consolidated financial statements and those valuation methods have been applied in these interim financial statements.
The following table presents our fair value hierarchy for financial instruments carried at fair value on a recurring basis or measured at amortized cost:
|
| September 30, 2021 |
| December 31, 2020 | ||||||||||
|
| Carrying |
|
|
|
|
|
|
| Carrying |
|
|
|
|
| Financial assets (liabilities) measured at | Amount |
| Level 1 1 |
| Level 2 1 |
| Level 3 |
| Amount |
| Level 1 1 |
| Level 2 1 |
| Fair value on a recurring basis |
|
|
|
|
|
|
|
|
|
|
|
|
|
| Cash and cash equivalents | 443 |
| - |
| 443 |
| - |
| 1,454 |
| - |
| 1,454 |
| Derivative instrument assets | 29 |
| - |
| 29 |
| - |
| 45 |
| - |
| 45 |
| Other current financial assets - marketable securities 2 | 226 |
| 32 |
| 194 |
| - |
| 161 |
| 24 |
| 137 |
| Investments at FVTOCI 3 | 279 |
| 269 |
| - |
| 10 |
| 153 |
| 153 |
| - |
| Derivative instrument liabilities | (23) |
| - |
| (23) |
| - |
| (48) |
| - |
| (48) |
| Amortized cost |
|
|
|
|
|
|
|
|
|
|
|
|
|
| Current portion of long-term debt |
|
|
|
|
|
|
|
|
|
|
|
|
|
| Fixed and floating rate debt | (46) |
| - |
| (46) |
| - |
| (14) |
| - |
| (14) |
| Long-term debt |
|
|
|
|
|
|
|
|
|
|
|
|
|
| Notes and debentures | (9,984) |
| (5,368) |
| (6,059) |
| - |
| (9,994) |
| (3,801) |
| (7,955) |
| Fixed and floating rate debt | (110) |
| - |
| (110) |
| - |
| (53) |
| - |
| (53) |
| 1 During the periods ended September 30, 2021 and December 31, 2020, there were no transfers between Level 1 and Level 2 for financial instruments measured at fair value on a recurring basis. | |||||||||||||
| 2 Marketable securities consist of equity and fixed income securities. We determine the fair value of equity securities based on the bid price of identical instruments in active markets. We value fixed income securities using quoted prices of instruments with similar terms and credit risk. | |||||||||||||
| 3 Investments at fair value through other comprehensive income ("FVTOCI") is primarily comprised of shares in Sinofert Holdings Ltd. | |||||||||||||
NOTE 6 SHARE CAPITAL
Share repurchase programs
|
|
|
|
|
| Maximum |
| Maximum |
| Number of |
|
| Commencement |
|
|
| Shares for |
| Shares for |
| Shares |
|
| Date |
| Expiry |
| Repurchase |
| Repurchase (%) |
| Repurchased |
| 2019 Normal Course Issuer Bid | February 27, 2019 |
| February 26, 2020 |
| 42,164,420 |
| 7 |
| 33,256,668 |
| 2020 Normal Course Issuer Bid | February 27, 2020 |
| February 26, 2021 |
| 28,572,458 |
| 5 |
| 710,100 |
| 2021 Normal Course Issuer Bid 1 | March 1, 2021 |
| February 28, 2022 |
| 28,468,448 |
| 5 |
| 2,460,097 |
| 1 The 2021 normal course issuer bid will expire earlier than the date above if we acquire the maximum number of common shares allowable or otherwise decide not to make any further repurchases. | |||||||||
Purchases under the normal course issuer bids were, or may be, made through open market purchases at market prices as well as by other means permitted by applicable securities regulatory authorities, including private agreements.
The following table summarizes our share repurchase activities during the period:
|
| Three Months Ended |
| Nine Months Ended | ||||
|
| September 30 |
| September 30 | ||||
|
| 2021 |
| 2020 |
| 2021 |
| 2020 |
| Number of common shares repurchased for cancellation | 2,427,369 |
| - |
| 2,460,097 |
| 3,832,580 |
| Average price per share (US dollars) | 61.18 |
| - |
| 61.07 |
| 41.96 |
| Total cost | 148 |
| - |
| 150 |
| 160 |
Dividends declared
We declared a dividend per share of $0.46 (2020 – $0.45) during the three months ended September 30, 2021, payable on October 15, 2021 to shareholders of record on September 30, 2021 and total dividends of $1.38 (2020 – $1.35) during the nine months ended September 30, 2021.
Share cancellation
Effective September 1, 2021, we cancelled 210,173 shares due to the expiration of the period when legacy companies' (Potash Corporation of Saskatchewan Inc. and Agrium Inc.) shares could be exchanged under the plan of arrangement, wherein Nutrien became the parent company of the legacy companies.
NOTE 7 SEASONALITY
Seasonality in our business results from increased demand for products during planting season. Crop input sales are generally higher in spring and fall application seasons. Crop nutrient inventories are normally accumulated leading up to each application season. The results of this seasonality have a corresponding effect on receivables from customers and rebates receivables, inventories, prepaid expenses and other current assets and trade payables. Our short-term debt also fluctuates during the year to meet working capital needs. Our cash collections generally occur after the application season is complete, while customer prepayments made to us are typically concentrated in December and January and inventory prepayments paid to our suppliers are typically concentrated in the period from November to January. Feed and industrial sales are more evenly distributed throughout the year.
NOTE 8 RELATED PARTY TRANSACTIONS
We sell potash outside Canada and the United States exclusively through Canpotex. Canpotex sells potash to buyers in export markets pursuant to term and spot contracts at agreed upon prices. Our revenue is recognized at the amount received from Canpotex representing proceeds from their sale of potash, less net costs of Canpotex. Sales to Canpotex are shown in Note 2.
| As at | September 30, 2021 |
| December 31, 2020 |
| Receivables from Canpotex | 593 |
| 122 |
View source version on businesswire.com: https://www.businesswire.com/news/home/20211101005946/en/
Investor Relations:
Jeff Holzman
Vice President, Investor Relations
(306) 933-8545
Investors@nutrien.com
Tim Mizuno
Director, Investor Relations
(306) 933-8548
Media Relations:
Megan Fielding
Vice President, Brand & Culture Communications
(403) 797-3015
Contact us at: www.nutrien.com