The Conversation (0)

Sarama Resources Ltd. (" Sarama " or the " Company ") is pleased to announce a significant increase in mineral resources for its 100%-owned (12) Sanutura Project (the " Project ") in south-west Burkina Faso. This follows an updated interpretation and re-estimation of mineral resources at the Bondi Deposit, located to the north of the Project's main Tankoro Deposit
The Sanutura Project is an advanced-stage exploration project covering approximately 1,500km² (refer Figure 1) that hosts a significant, well-defined mineral resource base and a suite of exploration targets.
The updated mineral resource estimate at the Project (refer Table 1) now stands at:
This represents a significant increase over the 2020 mineral resource estimate of 0.6Moz Au (Indicated) and 1.9Moz Au (Inferred) (2) (refer Appendix B) and highlights the scale of the Project and the valuable contribution of the Bondi Deposit.
The combined oxide and transition component of the mineral resource now totals 0.2Moz gold (indicated) plus 0.8Moz gold (inferred) (4) , illustrating the ability to provide early plant feed to support a potential staged mine development.
Re-interpretation and improved modelling of the Bondi Deposit has identified several higher-grade shoots within the mineral resource and will greatly assist in exploration targeting. This, combined with compelling regional targets at the Zanawa and Malbus Prospects are expected to deliver further increases to the mineral resource base.
Highlights
Sarama's President and CEO, Andrew Dinning commented:
"We are very pleased with the significant increase to the mineral resource estimate for Sarama's 100%-owned Sanutura Project. This resource update marks the completion of a significant amount of technical work on historical exploration data and gives clear direction for future exploration where the Company is seeking to materially increase the Project's mineral resource.
The inclusion of the Bondi Deposit to the Project's mineral resource base provides a significant increase in high-grade, free-milling material and has the potential to materially improve start-up economics for the Project. In addition, the overall increase in the oxide and free-milling component to 0.2Moz Au (Indicated) plus 1.1Moz Au (Inferred) (6) has a material impact on the project development picture and our next key step will be to pursue the compelling exploration targets we have identified across the Project. These targets (8,9,10) , when combined with the current mineral resources, give us an exploration target in excess of 3-3.5 million ounces of gold.
The Project is being positioned as a long-life, multi-stage asset that can be built and paid for well before we have exploited the oxide resource and one which provides significant optionality and leverage to the gold price and remains key to the development of the southern Houndé Belt."
Mineral Resource Estimate
The independent mineral resource estimate for Sarama's 100%-owned Sanutura Project was undertaken by Cube Consulting Pty Ltd (Perth, Western Australia) and features an extensive update to the interpretation and estimation of mineral resources at the Bondi Deposit, a key component of the Project. The update incorporates data from all exploration activities at the deposit, which have occurred over the period 2003 - 2018.
The updated mineral resource for the Sanutura Project is:
This is comprised of mineral resources for the Tankoro Deposit of 9.4Mt @ 1.9g/t Au for 0.6Moz Au (Indicated) and 43.6Mt @ 1.4g/t Au for 1.9Moz (Inferred) and the Bondi Deposit of 9.2Mt @ 1.5g/t Au for 0.5Moz (Inferred)(refer Appendix A, Table A1).
Table 1 summarises the updated mineral resource for the Project and Appendix A contains detailed breakdowns as well as notes outlining the methodology used for interpretation, estimation and classification.
The mineral resource features a higher-grade component of 6.3Mt @ 2.5g/t Au for 0.5Moz Au (Indicated) plus 29.8Mt @ 1.9g/t Au for 1.8Moz Au (Inferred) (3) which reflects the presence of numerous higher-grade zones within the mineralised systems. These zones are typically located in areas of structural complexity with an associated increase in the volume of the package of stacked lodes, which the Company would seek to leverage to provide early plant feed in a potential mine development. Figure 4 illustrates the core areas of the MM and MC Prospects at the Tankoro Deposit which feature higher-grade mineralisation in structurally complex settings.
An increase in the oxide and transition components of the mineral resource to 3.2Mt @ 1.6g/t Au for 0.2Moz Au (Indicated) plus 23.4Mt @ 1.1g/t Au for 0.8Moz Au (Inferred) (4,5) has been delivered by the update and Sarama will specifically target this type of material in future drilling programs to provide early plant feed for a potential staged mine development.
Significant quantities of modelled mineralisation remain unclassified and the subject of future drilling campaigns with the intent of converting into mineral resources.
Table 1 - Mineral Resources (A,B) - Sanutura Project
| Geological Classification | Material Type (C,D) | Reporting Cut-off Grade (E,F) | Tonnage Above Cut-off Grade | Average Grade Above Cut-off Grade | Contained Gold Above Cut-off Grade | Metal Contribution |
g/t Au | Mt | g/t Au | koz Au | % | ||
| Indicated | Oxide (OP) | 0.2 | 2.5 | 1.5 | 123 | 21% |
| Transition (OP) | 0.3 | 0.7 | 1.7 | 38 | 6% | |
| Fresh (OP) | 0.5 | 6.1 | 2.1 | 409 | 70% | |
|
|
|
|
| ||
| Sub-total (OP) |
| 9.3 | 1.9 | 570 | 98% | |
|
|
|
|
| ||
|
|
|
|
| ||
| Fresh (UG) | 1.6 | 0.1 | 2.4 | 11 | 2% | |
|
|
|
|
| ||
|
|
|
|
| ||
| Total Indicated |
| 9.4 | 1.9 | 582 | 100% | |
|
|
|
|
| ||
|
|
|
|
| ||
|
|
|
|
| ||
| Inferred | Oxide (OP) | 0.2 | 18.9 | 1.1 | 638 | 27% |
| Transition (OP) | 0.3 | 4.4 | 1.2 | 172 | 6% | |
| Fresh (OP) | 0.3 & 0.5 (F) | 25.9 | 1.5 | 1,222 | 52% | |
|
|
|
|
| ||
| Sub-total (OP) |
| 49.2 | 1.3 | 2,032 | 87% | |
|
|
|
|
| ||
|
|
|
|
| ||
| Fresh (UG) | 1.5 & 1.6 | 3.5 | 2.8 | 314 | 13% | |
|
|
|
|
| ||
|
|
|
|
| ||
| Total Inferred |
| 52.7 | 1.4 | 2,344 | 100% | |
|
|
|
|
|
Table Notes
Tankoro Deposit
The mineral resource for the Tankoro Deposit (refer Figures 2 & 4) is principally contained in an extensive package of mineralised lenses, presenting as gold-quartz veinlets and disseminated gold-pyrite within quartz-feldspar-porphyry dykes and sediment-hosted quartz veins. The package is interpreted to extend over a semi-continuous strike length of approximately 16km in a trend that spans approximately 1.4km across the strike (refer Figure 2). A large portion of the mineral resource has only been drill-tested to approximately 70m depth, however drilling of certain higher-grade zones has shown the system to extend to 550m depth where it remains open. The mineralized corridor, as presently defined by drilling, lies within a 30km-long, gold-in-soil geochemical anomaly that remains a key focus for ongoing exploration.
A second mineralised trend in the east of the Project area makes a minor contribution to the mineral resource estimate. This trend is also defined by a large gold-in-soil geochemical anomaly extending for 30km and features gold mineralisation hosted in quartz veins which have typically been drilled to a depth of 30-50m. The under-explored nature of the trend highlights the potential of the Project to host mineralisation of significance outside the historically well-drilled areas in the west and several zones within the trend will be targeted in upcoming exploration programs.
Bondi Deposit
The mineral resource for the Bondi Deposit (refer Figures 3 & 5) is contained in a series of mineralised lenses primarily hosted in a regionally extensive, sub-vertical shear zone system. The mineralisation typically presents as gold-quartz veins and veinlets within a range of lithological host units forming sub-vertical, semi-continuous lenses. These lenses strike N-S to NNE with several closely-spaced parallel lenses combining to form a mineralised package spanning up to 50m across the strike. The mineralised system extends for approximately 6km along strike and in its central area, features a proliferation of structurally-controlled minor lodes striking in a NNW to N-S direction. At its widest point in this area the mineralised package spans approximately 500m across.
Drilling at the deposit is extensive, with the central zone being largely informed by holes at 25m x 25-50m spacing in the near-surface, open-pittable areas. Drilling in a high-grade central zone has extended to a vertical depth of approximately 300m with the mineralisation remaining open. For a large part of the mineral resource, the drilling only extends to 150m below surface and in many areas only 50m below surface.
Exploration Targets
Gold mineralisation, within 5km of the Bondi Deposit occurs in a diverse range of geological settings and deposit types, has been intersected in recent drill programs. This includes disseminated gold associated with E-trending structural features, within and proximal to, intermediate intrusive units (eg. Zanawa Prospect; refer Sarama's news release of 20 September 2018), high-grade gold-quartz veins cutting fractured mafic volcanic rocks and gold-quartz veinlets associated with a regional shear zone.
More than 30 exploration targets have been identified by Sarama within the larger Sanutura Project area from soil geochemical surveys, IP geophysical surveys, airborne magnetic survey interpretation and historical drilling and these targets will be further explored with a view to establishing multiple satellite feed deposits.
In addition to the stated mineral resources, the Tankoro Deposit has a primary exploration target of a further 3.5-4.3Mt @ 1.2-1.4g/t Au for 135-190koz Au (8) , consisting of modelled and estimated mineralisation contained within the open pit shell and underground blockouts. A secondary exploration target of 12.0-14.7Mt @ 1.2-1.4g/t for 0.5-0.7Moz Au (9) has been modelled and estimated outside the constraining mining shapes. The Bondi Deposit has a primary exploration target of 2.5-3.1Mt @ 0.9-1.1g/t Au for 70-100koz Au (10) , consisting of modelled and estimated mineralisation contained within the open pit shell and underground blockouts.
While the potential quantity and grade of these exploration targets is conceptual in nature and there has been insufficient exploration to define a mineral resource and it is uncertain if further exploration will result in the target being delineated as a mineral resource, they present viable exploration targets for the Company to pursue.
For further information on the Company's activities, please contact:
Andrew Dinning or Paul Schmiede
e: info@saramaresources.com
t: +61 (0) 8 9363 7600
The Company will prepare and file a technical report under National Instrument 43-101 within 45 days of the date of this news release.
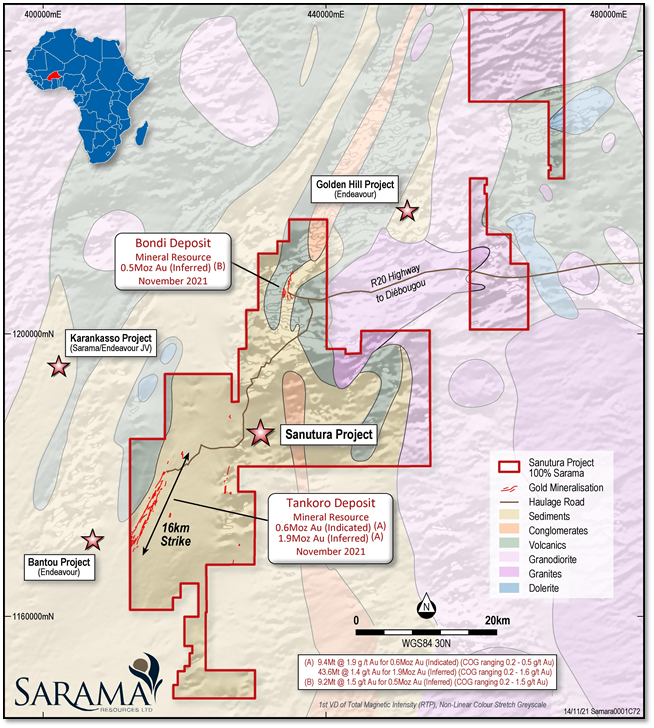
Figure 1 - Sanutura Project Location
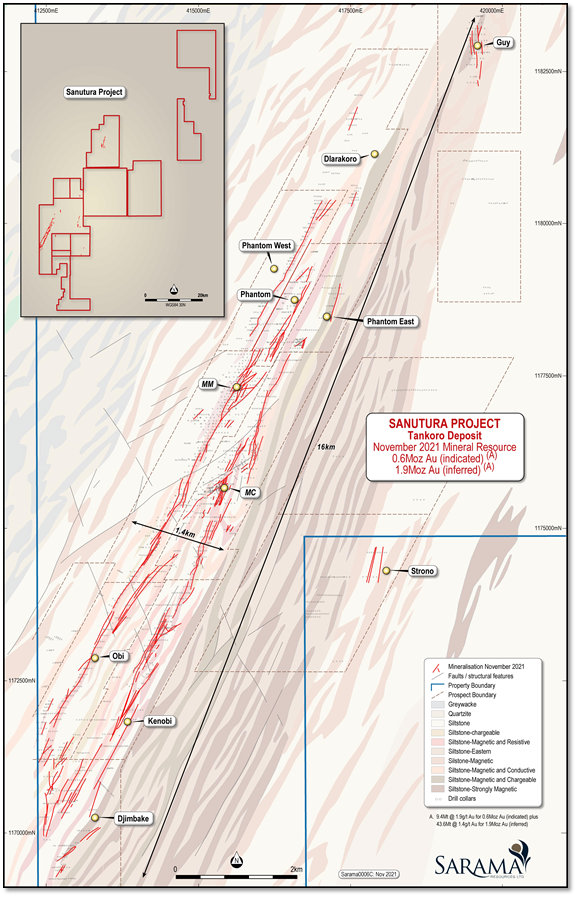
Figure 2 - Tankoro Deposit - Western Corridor Mineralisation & Geology Plan
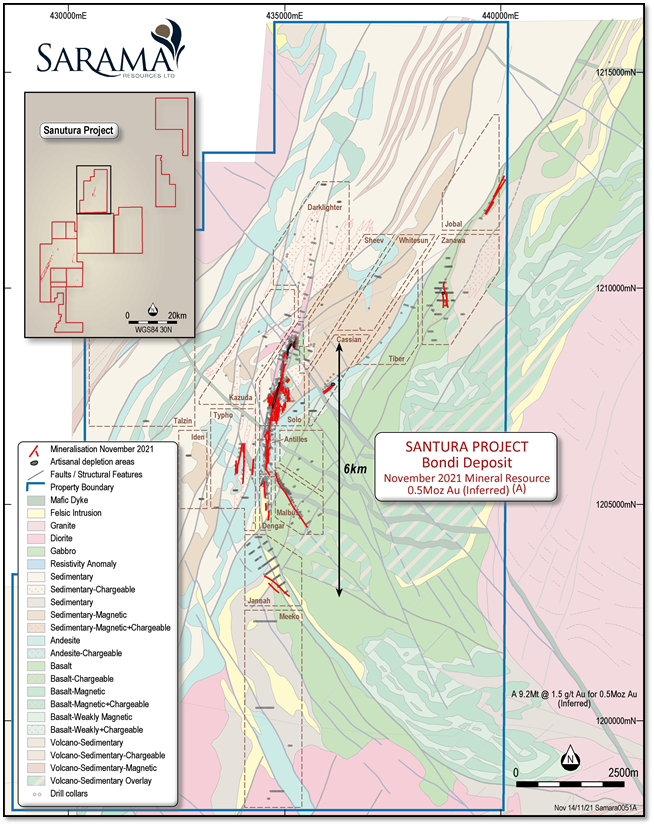
Figure 3 - Bondi Deposit - Mineralisation and Geology Plan
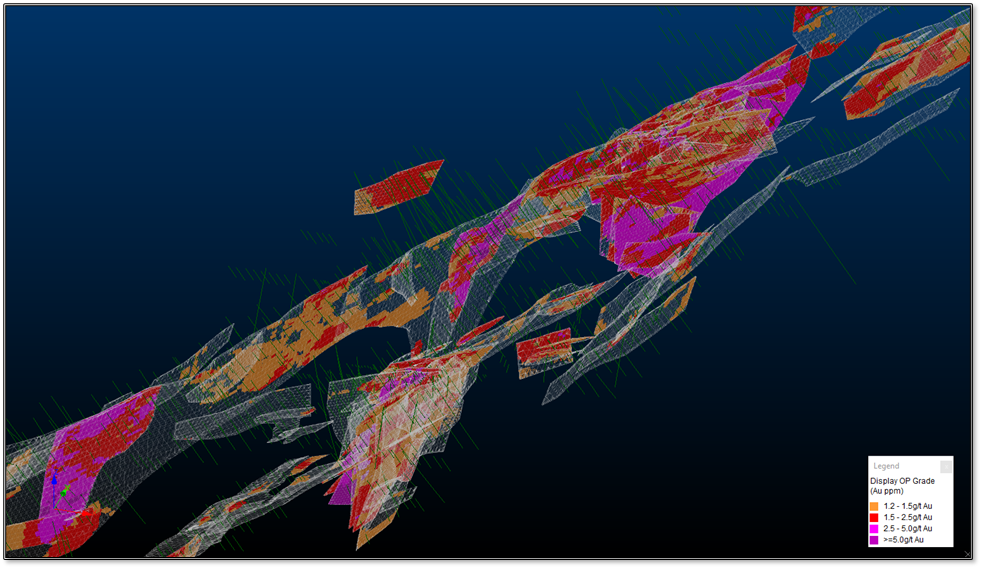
Figure 4 - Higher-Grade Zones Within the Tankoro Deposit (Model Filtered >1.2g/t Au), 3D View to NW from Above, MM & MC Prospects
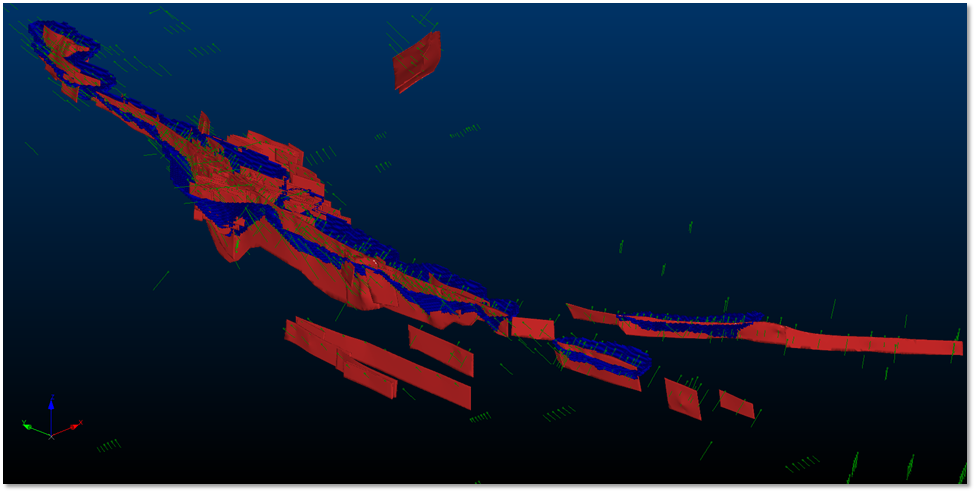
Figure 5 - Bondi Deposit - Main Mineralisation and Constraining Pit Shell (US$1800/oz), 3D View to NE from Above
ABOUT SARAMA RESOURCES LTD
Sarama Resources Ltd ( TSX-V: SWA ) is a West African focused gold explorer and developer with substantial landholdings in south-west Burkina Faso. Sarama is focused on maximising the value of its strategic assets and advancing its key projects towards development.
Sarama's 100%-owned (12) Sanutura Project is principally located within the prolific Houndé Greenstone Belt in south-west Burkina Faso and is the exploration and development focus of the Company. The project hosts the Tankoro and Bondi Deposits which have a combined mineral resource of 0.6Moz gold (indicated) and 2.3Moz gold (inferred) (1) .
Together, the deposits present a potential mine development opportunity featuring an initial, long-life CIL project which may be established and paid for by the significant oxide mineral resource base.
Sarama has built further optionality into its portfolio including a 600km² exploration position in the highly prospective Banfora Belt in south-western Burkina Faso. The Koumandara Project hosts several regional-scale structural features and trends of gold-in-soil anomalism extending for over 40km along strike.
Sarama also holds an approximate 18% participating interest in the Karankasso Project Joint Venture (" JV ") which is situated adjacent to the Company's Sanutura Project in Burkina Faso and is a JV between Sarama and Endeavour Mining Corp (" Endeavour ") in which Endeavour is the operator of the JV. In February 2020, an updated mineral resource estimate of 709koz gold (11) was declared for the Karankasso Project JV.
The Company's Board and management team have a proven track record in Africa and a strong history in the discovery and development of large-scale gold deposits. Sarama is well positioned to build on its current success with a sound strategy to surface and maximise the value of its property portfolio.
FOOTNOTES
CAUTION REGARDING FORWARD LOOKING INFORMATION
Information in this news release that is not a statement of historical fact constitutes forward-looking information. Such forward-looking information includes, but is not limited to, the updated mineral resource estimate, statements regarding the Company's future exploration and development plans, the potential for the Sanutura and Karankasso Projects to host economic mineralisation, the potential for open pit and underground mining at the Sanutura Project, the potential to expand the present oxide component of the existing estimated mineral resources at the Sanutura Project, the reliability of the historical exploration work and estimates for artisanal mining depletion at the Bondi Deposit, the potential for the receipt of regulatory approvals and the timing and prospects for the re-issuance of the Tankoro Exploration Permit by the Government of Burkina Faso. Actual results, performance or achievements of the Company may vary from the results suggested by such forward-looking statements due to known and unknown risks, uncertainties and other factors. Such factors include, among others, that the business of exploration for gold and other precious minerals involves a high degree of risk and is highly speculative in nature; mineral resources are not mineral reserves, they do not have demonstrated economic viability, and there is no certainty that they can be upgraded to mineral reserves through continued exploration; few properties that are explored are ultimately developed into producing mines; geological factors; the actual results of current and future exploration; changes in project parameters as plans continue to be evaluated, as well as those factors disclosed in the Company's publicly filed documents.
There can be no assurance that any mineralisation that is discovered will be proven to be economic, or that future required regulatory licensing or approvals will be obtained. However, the Company believes that the assumptions and expectations reflected in the forward-looking information are reasonable. Assumptions have been made regarding, among other things, the Company's ability to carry on its exploration activities, the sufficiency of funding, the timely receipt of required approvals, the price of gold and other precious metals, that the Company will not be affected by adverse political events, the ability of the Company to operate in a safe, efficient and effective manner and the ability of the Company to obtain further financing as and when required and on reasonable terms. Readers should not place undue reliance on forward-looking information.
Sarama does not undertake to update any forward-looking information, except as required by applicable laws.
Neither TSX Venture Exchange nor its Regulation Services Provider (as that term is defined in policies of the TSX Venture Exchange) accepts responsibility for the adequacy or accuracy of this release.
QUALIFIED PERSONS' STATEMENT
Scientific or technical information in this disclosure that relates to the preparation of the mineral resource estimate for the Sanutura Project is based on information compiled or approved by Paul Schmiede. Paul Schmiede is an employee of Sarama Resources Ltd and is a Fellow in good standing of the Australasian Institute of Mining and Metallurgy. Paul Schmiede has sufficient experience which is relevant to the commodity, style of mineralisation under consideration and activity which he is undertaking to qualify as a Qualified Person under National Instrument 43-101. Paul Schmiede consents to the inclusion in this news release of the information, in the form and context in which it appears.
Scientific or technical information in this disclosure that relates to the metallurgical testwork at the Bondi Deposit is based on information compiled or approved by Paul Schmiede. Paul Schmiede is an employee of Sarama Resources Ltd and is a Fellow in good standing of the Australasian Institute of Mining and Metallurgy. Paul Schmiede has sufficient experience which is relevant to the commodity, style of mineralisation under consideration and activity which he is undertaking to qualify as a Qualified Person under National Instrument 43-101. Paul Schmiede consents to the inclusion in this news release of the information, in the form and context in which it appears.
Scientific or technical information in this disclosure that relates to tank-based and oxidative metallurgical testwork and mineral processing is based on information compiled or approved by Fred Kock. Fred Kock is an employee of Orway Mineral Consultants Pty Ltd and is considered to be independent of Sarama Resources Ltd. Fred Kock is a Fellow in good standing of the Australasian Institute of Mining and Metallurgy and has sufficient experience which is relevant to the commodity, style of mineralisation under consideration and activity which he is undertaking to qualify as a Qualified Person under National Instrument 43-101. Fred Kock consents to the inclusion in this news release of the information, in the form and context in which it appears.
Scientific or technical information in this disclosure that relates to exploration activities at the Sanutura Project is based on information compiled or approved by Guy Scherrer. Guy Scherrer is an employee of Sarama Resources Ltd and is a member in good standing of the Ordre des Géologues du Québec and has sufficient experience which is relevant to the commodity, style of mineralisation under consideration and activity which he is undertaking to qualify as a Qualified Person under National Instrument 43-101. Guy Scherrer consents to the inclusion in this disclosure of the information, in the form and context in which it appears.
Scientific or technical information in this disclosure that relates to the quotation of the Karankasso Project's mineral resource estimate and exploration activities is based on information compiled by Paul Schmiede. Paul Schmiede is an employee of Sarama Resources Ltd and is a Fellow in good standing of the Australasian Institute of Mining and Metallurgy. Paul Schmiede has sufficient experience which is relevant to the commodity, style of mineralisation under consideration and activity which he is undertaking to qualify as a Qualified Person under National Instrument 43-101. Paul Schmiede consents to the inclusion in this disclosure of the information, in the form and context in which it appears. Paul Schmiede and Sarama have not independently verified Semafo's (now Endeavour's) mineral resource estimate and take no responsibility for its accuracy.
APPENDIX A - MINERAL RESOURCE ESTIMATION
Tankoro Deposit
Bondi Deposit
1. The mineral resource estimate was undertaken by Cube Consulting Pty Ltd, a minerals industry consultancy based in Perth, Western Australia, which is independent of Sarama.
2. The 4 prospect areas that are the subject of this mineral resource are located on the Djarkadougou 2 exploration property and the validated mineral resource drilling database contained the following drillhole physicals that were used directly in the modelling of the mineral inventory: 14 air-core (" AC ") drillholes (531m), 689 reverse-circulation (" RC ") drillholes (49,021m) and 86 diamond drillholes (17,503m).
3. The mineral resource estimate used only diamond, RC drilling data. Information from the AC holes were used to guide the interpretation of the mineralised lodes, but they were not incorporated in the estimation process.
4. The drilling was completed in several phases by Sarama (July 2017 - July 2018) and Orezone Gold Corporation (" Orezone ") (January 2003 - February 2016).
5. Drilling on the property was undertaken along a range of conjugate orientations, predominantly 90°+270° and 110°+290°, and to a lesser extent 60°+240°, according to the observed and interpreted strike of mineralisation. A range of drill-line spacings were used depending on geological complexity and the intent of the drill programs. Interpretations of mineralisation were made with drill fence spacing varying from approximately 25m to 250m, however areas of excessive drill spacing remain geologically ‘unclassified' and do not contribute to the mineral resource. Within the lodes contributing to the mineral resource, drill spacing varies from 25-100m and is typically 25m.
6. Collars for drillholes used in the mineral resource estimate have been surveyed using several different methods over various different exploration phases. In general, the collars were surveyed using either a differential GPS or total station systems. Minor check surveys on historical drill collars have been undertaken by Sarama using a differential GPS system which is considered to provide a location accuracy of
7. Downhole surveys have been conducted on the majority of diamond and RC holes using either magnetic single-shot or gyro multi-shot electronic survey instruments. Some downhole surveys were conducted on AC drillholes.
8. Geological logging of drillholes includes state of weathering, lithology, alteration, mineralogy, structural defects and groundwater conditions. All drillhole logging data was compiled into a master drilling database.
9. AC and RC drilling was logged and sampled over regular 1m intervals for the entire hole, whilst diamond holes were logged and sampled over varying intervals (average 1.3m sample length) according to geological observations. In the case of diamond drilling, samples submitted for assay were half-core. In the case of regional AC drilling, some sampled intervals were composited over 2m for initial assaying. Some early (May 2003) RC drilling was sampled over regular 2m intervals.
10. Diamond drilling within the database for the Djarkadougou 2 Property had core recovery data available for approximately 8,570m with a length-weighted average of 95%. Sample weight data is available for 7,530m of AC drilling within the database for the Djarkadougou 2 Property and had an average sample collection rate of 19kg/m. Sample weight data is available for 59,600m of RC drilling within the database for the Djarkadougou 2 Property and had an average sample collection rate of 27kg/m. Sample recovery and quality was not generally assessed, in part due to incomplete drilling and sampling records.
11. AC and RC sample splitting was performed at Sarama's and Orezone's preparation facilities in Burkina Faso. In the case of wet AC and RC drilling by Sarama, full samples were dried by wood-fire prior to splitting (Orezone's procedures are unknown). Diamond core sawing was also undertaken at Sarama's and Orezone's preparation facilities.
12. Sampling and sample submission were conducted in accordance with a quality assurance/quality control program which includes the use of certified and uncertified reference materials for diamond, RC and AC drilling and field duplicates for AC and RC drilling. Ancillary field split, crush duplicate and lab pulp duplicate data was available for certain samples.
13. All drilling samples are securely bagged at the preparation facility and assigned sample identification numbers prior to their transport to assay laboratories in Burkina Faso, Mali and Ghana operated by SGS SA, Transworld, Bigs Global, ALS Limited and Abilab.
14. Gold content was determined by a several methods (with lower detection limit of at least 0.01 g/t Au) including:
15. The prevalence of partial gold contents for samples in the database (originating from the Orezone era), prompted an extensive QAQC review by Sarama in Q1-Q3 2021. The review examined the performance of all assay lab + methodology combinations and reviewed assay repeatability and accuracy and extent of determination of total gold content for the head samples. In general, the review concluded that sample preparation by Orezone was likely to be of an acceptable standard, however the extensive use of uncertified reference materials (with likely poor manufacture and resultant erratic gold content) prohibits the definitive assessment of both sample preparation and lab analytical accuracy and repeatability. The review also concluded that the use of partial leaching of gold is less than ideal, particularly for samples within the interpreted mineralised lodes.
Given the assay dataset consists of full and partially determined gold content samples, it was decided to identify a ‘pass subset' - comprised of full, or near full, gold content samples for use in a resource estimate. The following general process was adopted by Sarama to produce this subset:
Sarama then selected ‘pass subset' samples were then cross-referenced with those samples comprising the interpreted mineralised lodes (interpretation process outlined below). Composite intervals of samples intersecting the interpreted mineralised lodes that were not fully comprised of samples in the ‘pass subset' were further assessed as to the materiality of the ‘non-passing' samples. ‘Non-pass' samples within the mineralised lode's composite interval were included in the ‘pass subset' if one of the 3 conditions were satisfied:
The resulting ‘pass subset' was then used by Cube to perform geostatistical analysis and the estimation.
16. Structure, lithology, alteration, mineralisation, weathering and surface topography surfaces were interpreted in 3D by Cube using Seequent Leapfrog Geo TM and GEOVIA Surpac TM software.
17. Mineralised lode interpretations generally honour a 0.30 g/t Au lower cut-off to define the mineralised interval within a drillhole. Lithological, structural and alteration information was also incorporated in the interpretation of the mineralised lodes. The interpretation was typically extended past the last drillhole intercept by
18. Additional criteria of a minimum 2m downhole interval length, and the minimisation of internal dilution were considered during the interpretation of the mineralised domains. However, internal dilution was incorporated where required to preserve the overall continuity of the mineralised domains.
19. The vertical extent of the reported mineral resources varies across the individual prospects with approximate vertical depths as follows: Solo - 320m, Antilles - 125m, Malbus - 65m and Dengar - 55m.
20. Cube extracted 4,900 density measurements from the database provided by Sarama. Cube was not provided with information relating to the nature of the samples collected for density as well as methodology used to obtain the measurements and as such has taken the density data at face value. The samples were coded by weathering status and statistical analysis was carried out for each weathering domain. An average density value was assigned to each domain however a multimodal population was observed for the fresh sample population, suggesting that future geological modelling should be carried out to properly assign the density in the fresh zone.
21. The drillhole database was coded by the interpreted mineralised lodes and assessment of the raw assay interval lengths was carried out which determined a common sample length of 1m.
22. The samples were composited to 1m downhole using the best fit method in Surpac, with a minimum threshold of 50%, meaning a minimum allowable composite size of 0.5m. A very small proportion (0.4%) of the samples did not satisfy these criteria, which are mainly associated with low Au grade value. Removal of these samples do not constitute a material risk to the estimate.
23. The composited samples were subsequently coded by the QA-QC status extracted from Sarama's "Q1-Q3 2021 QA-QC assessment", where most importantly samples that were flagged as "FAIL" during this assessment were not incorporated in the estimation process.
24. Statistical analysis of the composited Au grade per mineralised lodes was conducted. Domains with high coefficient of variation (i.e. greater than 1.5), had grade caps applied. The capping thresholds were determined through analysis of the histogram, log probability plots of the domains of interest as well as the spatial location of the outliers. Local distance restrictions were also applied for selected domains where gold grade above a given threshold is not extrapolated past a chosen distance (around 30m), in order to mitigate the smearing of high grade into poorly informed areas.
25. Variogram analysis was carried out using Supervisor software, on the major Domain 1001 as this domain best informed domain and is representative of the main mineralisation style. Gold assays within Domain 1001 consist of a combination of total gold assays and partial gold assays. The variogram analysis was carried out on the total gold assays only in order to avoid additional variability introduced from using a mixture of data. Normal score transformation was applied to the data prior to the analysis in order to mitigate the effect of outliers and to assist identification of the underlying structure of the gold variable. The resulting variogram models were back-transformed into real space for use in the estimation process.
26. An omnidirectional variogram in the plane of mineralisation was defined for Domain 1001. This model was also used to determine the appropriate estimation parameters for grade interpolation into the block model. The variogram model for Domain 1001 was applied to the other domains, where the sill was adjusted to the variance of the domain of interest.
27. GEOVIA Surpac TM software was used to perform the grade estimation into two separate block models (one for the western mineralised trend and one for the eastern mineralised trend within the Bondi Deposit). The ordinary-kriging (" OK ") methodology was used for both areas. All block estimates were based on grade interpolation into parent cells with dimensions of 12.5mE x 12.5mN x 5mRL and sub-blocked to 1.5625mE x 3.125mN x 1.25mRL for Bondi West. For Bondi East, the parent cell sizes are 20mE x 60mN x 20mRL and sub-blocked to 5mE x 3.75mN x 2.5mRL. The parent blocks sizes approximate half the average drillhole spacing in both areas.
28. Gold grades were estimated in the block model using a single pass approach with a 300m search ellipse, a minimum number of samples of 6 and maximum number of samples of 16. For poorly informed domains, the minimum number of samples was relaxed to the number of samples inside the domain if less than 6. Most of the blocks in the interpreted mineralised lodes were estimated using a single pass. Only two domains out of 129 domains had un-estimated blocks after the first pass and these blocks were assigned the estimated mean gold grade for the corresponding domain.
29. Validation of the estimate was carried out by visually comparing the block estimate with the drillhole data. Statistical comparison of the gold grades between the declustered capped composites and the OK estimate were computed on domain-by-domain basis. The differences are within acceptable ranges of the classification of the resource. Swath plots in the Northing, Easting and RL directions were also generated using varying slicing width (25-50m) and there is no observed significant bias between the capped composite / declustered capped composite and the gold grade estimate at a local scale. A check estimate using Inverse Distance Squared (" ID 2") methodology was also carried out and overall, there is a difference of less than 2% between the two estimation methodologies, which is considered to be immaterial to the estimate.
30. The block model was classified as ‘inferred' and ‘unclassified' according to geological and estimate confidence. Consideration was given to data density, geological and grade continuity, drill spacing, drill quality, material type, assay reliability assessment, suitability of estimation methodology and local estimation bias.
31. Artisanal mining is noted to have occurred at the Solo, Cassian and Zanawa Prospects. Depletion of mineralisation by this artisanal mining was reflected in the block model by coding affected blocks with open pit and underground depletion factors.
The depletion factors were used to inform the determination of the mineralised areas to have reasonable prospects of eventual economic extraction (" RPoEEE ").
32. Modelled mineralisation was assessed for likelihood to have RPoEEE by generating open pit optimisation shells and underground mining blockouts. Open pit optimisations, based on the Lerchs-Grossmann algorithm, were conducted using GEOVIA Whittle TM software with assumed input parameters for gold price, metallurgical recovery, operating costs and pit wall angles. The US$1800/oz shell was selected to constrain the modelled mineralisation for reporting purposes. Modelled mineralisation in fresh material located beneath the extent of the open pit shell was assessed for potential suitability for underground mining using cut-off grade, strike and dip continuity, minimum mining width, minimum stope height, spatial distribution of blocks and pit/underground interaction criteria. 3D wireframes were generated on a lode-by-lode basis for modelled blocks meeting all criteria. Blocks captured within either the open pit or underground constraining mining shapes were flagged.
33. Blocks flagged by the mining shape constraints were interrogated by a range of cut-off grades (by material type, by potential mining style) to report final mineral resources. The inputs for the calculation of the reporting cut-off grades reflected those inputs used for the generation of the constraining mining shapes. Mineralised material categorised geologically as ‘unclassified' was excluded from the reporting of mineral resources.
34. The resulting mineral resource estimate is compliant with the requirements of Canadian National Instrument 43-101, 2016 (" NI-43-101 ") and the Australasian Code for Reporting of Exploration Results, Mineral Resources and Ore Reserves, 2012 (" The JORC Code ").
35. The final block model included the estimated mineralised domains with attributes for prospect, weathering type, density, estimation domain code, geological classification, constraining flag for open pit and underground mining shapes and a flag for mineral resource.
Tonnage-grade curves were generated for a range of reporting cut-off grades, material types and by prospect.
Table A1 - Mineral Resources by Prospect (A-E)
| Prospect | Indicated Mineral Resources | Inferred Mineral Resources | ||||||
|---|---|---|---|---|---|---|---|---|
kt | g/t Au | koz Au | kt | g/t Au | koz Au | |||
| Tankoro Deposit | ||||||||
| MM | 6,055 | 2.1 | 437 | 19,056 | 1.6 | 990 | ||
| MC | 2,512 | 1.4 | 113 | 9,240 | 1.3 | 389 | ||
| Obi | 168 | 2.1 | 11 | 4,483 | 0.8 | 122 | ||
| Kenobi | 493 | 1.0 | 16 | 4,341 | 0.9 | 126 | ||
| Djimbake | - | - | - | 817 | 0.8 | 22 | ||
| Phantom | 172 | 0.9 | 5 | 2,152 | 1.4 | 96 | ||
| Phantom West | - | - | - | 1,425 | 1.5 | 67 | ||
| Phantom East | - | - | - | 587 | 2.1 | 39 | ||
| Guy | - | - | - | 920 | 0.7 | 20 | ||
| Dlarakoro | - | - | - | 424 | 1.5 | 21 | ||
| Legbenege | - | - | - | 108 | 0.8 | 3 | ||
| Poggle | - | - | - | 29 | 0.6 | 1 | ||
|
|
|
|
|
| |||
| Sub-Total | 9,399 | 1.9 | 582 | 43,581 | 1.4 | 1,894 | ||
|
|
|
|
|
| |||
|
|
|
|
|
| |||
| Bondi Deposit |
|
|
|
|
|
| ||
| Solo | - | - | - | 6,585 | 1.7 | 367 | ||
| Antilles | - | - | - | 2,117 | 0.9 | 62 | ||
| Malbus | - | - | - | 224 | 1.9 | 14 | ||
| Dengar | - | - | - | 233 | 0.9 | 7 | ||
|
|
|
|
|
| |||
| Sub-Total | - | - | - | 9,190 | 1.5 | 454 | ||
|
|
|
|
|
| |||
| Total Project Mineral Resources | 9,399 | 1.9 | 582 | 52,740 | 1.4 | 2,344 | ||
|
|
|
|
|
| |||
Table Notes
Table A2.1 - Sensitivity of Mineral Resource Estimate (A,B) Grade & Tonnage to Cut-Off Grade - Tankoro Deposit (All Prospects)
| Oxide | Transition | Fresh | |||||||
Cut-Off Grade | Tonnage | Average Grade | Contained Gold | Tonnage | Average Grade | Contained Gold | Tonnage | Average Grade | Contained Gold |
| OP Indicated(C,D) | Mt | g/t Au | koz Au | Mt | g/t Au | koz Au | Mt | g/t Au | koz Au |
0 | 2.5 | 1.5 | 124 | 0.7 | 1.7 | 38 | 6.7 | 2.0 | 417 |
0.2 | 2.5 | 1.5 | 123 | 0.7 | 1.7 | 38 | 6.7 | 2.0 | 417 |
0.3 | 2.5 | 1.5 | 123 | 0.7 | 1.7 | 38 | 6.6 | 2.0 | 417 |
0.4 | 2.5 | 1.6 | 123 | 0.7 | 1.7 | 37 | 6.4 | 2.0 | 415 |
0.5 | 2.4 | 1.6 | 122 | 0.7 | 1.7 | 37 | 6.1 | 2.1 | 409 |
1.0 | 1.6 | 2.0 | 102 | 0.4 | 2.3 | 31 | 4.1 | 2.7 | 362 |
1.5 | 0.9 | 2.6 | 72 | 0.3 | 3.0 | 24 | 2.9 | 3.4 | 312 |
| OP Inferred(C,D) | |||||||||
0 | 16.7 | 1.0 | 548 | 3.3 | 1.1 | 115 | 20.5 | 1.4 | 929 |
0.2 | 16.7 | 1.0 | 548 | 3.3 | 1.1 | 115 | 20.5 | 1.4 | 929 |
0.3 | 16.5 | 1.0 | 546 | 3.3 | 1.1 | 115 | 20.5 | 1.4 | 929 |
0.4 | 15.9 | 1.1 | 540 | 3.3 | 1.1 | 114 | 20.3 | 1.4 | 927 |
0.5 | 14.9 | 1.1 | 524 | 3.2 | 1.1 | 113 | 20.1 | 1.4 | 923 |
1.0 | 6.0 | 1.6 | 311 | 1.4 | 1.6 | 69 | 13.7 | 1.7 | 763 |
1.5 | 2.5 | 2.2 | 178 | 0.5 | 2.2 | 35 | 6.3 | 2.3 | 472 |
| UG Indicated(C,D) | Mt | g/t Au | koz Au | Mt | g/t Au | koz Au | Mt | g/t Au | koz Au |
0 | - | - | - | - | - | - | 0.3 | 1.4 | 15 |
1.6 | - | - | - | - | - | - | 0.1 | 2.4 | 11 |
2.5 | - | - | - | - | - | - | 0.1 | 3.0 | 5 |
3.5 | - | - | - | - | - | - | - | - | - |
5.0 | - | - | - | - | - | - | - | - | - |
|
|
|
|
|
|
|
|
|
|
| UG Inferred(C,D) |
|
|
|
|
|
|
|
|
|
0 | - | - | - | - | - | - | 4.5 | 2.3 | 330 |
1.6 | - | - | - | - | - | - | 3.4 | 2.8 | 305 |
2.5 | - | - | - | - | - | - | 1.9 | 3.4 | 207 |
3.5 | - | - | - | - | - | - | 0.5 | 4.8 | 84 |
5.0 | - | - | - | - | - | - | 0.2 | 5.9 | 37 |
Table Notes
Table A2.2 - Sensitivity of Mineral Resource Estimate (A,B) Grade & Tonnage to Cut-Off Grade - Bondi Deposit (All Prospects)
| Oxide | Transition | Fresh | |||||||
Cut-Off Grade | Tonnage | Average Grade | Contained Gold | Tonnage | Average Grade | Contained Gold | Tonnage | Average Grade | Contained Gold |
| OP Indicated(C,D) | Mt | g/t Au | koz Au | Mt | g/t Au | koz Au | Mt | g/t Au | koz Au |
0 | - | - | - | - | - | - | - | - | - |
0.2 | - | - | - | - | - | - | - | - | - |
0.3 | - | - | - | - | - | - | - | - | - |
0.4 | - | - | - | - | - | - | - | - | - |
0.5 | - | - | - | - | - | - | - | - | - |
1.0 | - | - | - | - | - | - | - | - | - |
1.5 | - | - | - | - | - | - | - | - | - |
| OP Inferred(C,D) | |||||||||
0 | 2,134 | 1.2 | 85 | 1,144 | 1.6 | 57 | 5,893 | 1.6 | 299 |
0.2 | 2,130 | 1.2 | 85 | 1,141 | 1.6 | 57 | 5,875 | 1.6 | 299 |
0.3 | 2,021 | 1.3 | 85 | 1,118 | 1.6 | 57 | 5,777 | 1.6 | 298 |
0.4 | 1,861 | 1.4 | 83 | 1,071 | 1.6 | 57 | 5,622 | 1.6 | 297 |
0.5 | 1,632 | 1.5 | 79 | 996 | 1.7 | 56 | 5,294 | 1.7 | 292 |
1.0 | 862 | 2.2 | 62 | 582 | 2.4 | 46 | 3,475 | 2.2 | 249 |
1.5 | 480 | 3.0 | 47 | 367 | 3.2 | 37 | 2,243 | 2.8 | 199 |
|
|
|
|
|
|
|
|
|
|
| UG Indicated(C,D) | Mt | g/t Au | koz Au | Mt | g/t Au | koz Au | Mt | g/t Au | koz Au |
0 | - | - | - | - | - | - | - | - | - |
1.6 | - | - | - | - | - | - | - | - | - |
2.5 | - | - | - | - | - | - | - | - | - |
3.5 | - | - | - | - | - | - | - | - | - |
5.0 | - | - | - | - | - | - | - | - | - |
|
|
|
|
|
|
|
|
|
|
| UG Inferred(C,D) | |||||||||
0 | - | - | - | - | - | - | 156 | 2.1 | 10 |
1.6 | - | - | - | - | - | - | 129 | 2.2 | 9 |
2.5 | - | - | - | - | - | - | 28 | 2.8 | 3 |
3.5 | - | - | - | - | - | - | - | - | - |
5.0 | - | - | - | - | - | - | - | - | - |
Table Notes
APPENDIX B - 2020 MINERAL RESOURCE ESTIMATE
Table B.1 - 2020 Mineral Resources (A-F) - Sanutura Project (Tankoro Deposit Only)
| Geological Classification | Material Type (C,D) | Reporting Cut-off Grade(E) | Tonnage Above Cut-off Grade | Average Grade Above Cut-off Grade | Contained Gold Above Cut-off Grade | Metal Contribution |
g/t Au | Mt | g/t Au | koz Au | % | ||
| Indicated | Oxide (OP) | 0.2 | 2.5 | 1.5 | 123 | 21% |
| Transition (OP) | 0.3 | 0.7 | 1.7 | 38 | 6% | |
| Fresh (OP) | 0.5 | 6.1 | 2.1 | 409 | 70% | |
|
|
|
|
| ||
| Sub-total (OP) |
| 9.3 | 1.9 | 570 | 98% | |
|
|
|
|
| ||
|
|
|
|
| ||
| Fresh (UG) | 1.6 | 0.1 | 2.4 | 11 | 2% | |
|
|
|
|
| ||
|
|
|
|
| ||
| Total Indicated |
| 9.4 | 1.9 | 582 | 100% | |
|
|
|
|
| ||
|
|
|
|
| ||
|
|
|
|
| ||
| Inferred | Oxide (OP) | 0.2 | 16.8 | 1.0 | 551 | 29% |
| Transition (OP) | 0.3 | 3.3 | 1.1 | 115 | 6% | |
| Fresh (OP) | 0.3-0.5(F) | 20.1 | 1.4 | 924 | 49% | |
|
|
|
|
| ||
| Sub-total (OP) |
| 40.2 | 1.2 | 1,589 | 84% | |
|
|
|
|
| ||
|
|
|
|
| ||
| Fresh (UG) | 1.6 | 3.4 | 2.8 | 305 | 16% | |
|
|
|
|
| ||
|
|
|
|
| ||
| Total Inferred |
| 43.6 | 1.4 | 1,894 | 100% | |
Table Notes
SOURCE: Sarama Resources Ltd.
News Provided by ACCESSWIRE via QuoteMedia