The Conversation (0)
Hudbay Minerals Inc. ("Hudbay" or the "company") (TSX, NYSE: HBM) today released its second quarter 2024 financial results. All amounts are in U.S. dollars, unless otherwise noted. All production and cost amounts reflect the Copper Mountain mine on a 100% basis, with Hudbay owning a 75% interest in the mine.
"The continued execution of our operational plans in the second quarter has positioned us well to achieve our 2024 production guidance, and our exposure to gold by-products and strong cost control have allowed us to improve our 2024 cash cost guidance," said Peter Kukielski, President and Chief Executive Officer. "Our strong and diversified operating base continues to generate free cash flow driven in part by efficient milling performance in Peru and Manitoba. We are also continuing to execute our British Columbia stabilization plans and planned stripping programs in Peru and British Columbia to unlock higher copper and gold grades in the near-term. This has led to robust EBITDA generation over the past 12 months, which together with our recent successful equity offering, has allowed us to significantly accelerate our deleveraging efforts and transform our balance sheet. We are now even better positioned to continue to advance our many growth initiatives to unlock significant upside potential in our pipeline and further enhance our copper and gold exposure."
Delivered In-line Second Quarter Operating and Financial Results; Production Guidance Reaffirmed and Cash Cost Guidance Improved
- Achieved consolidated copper production of 28,578 tonnes and gold production of 58,614 ounces in the second quarter of 2024, in line with quarterly production cadence expectations for 2024.
- Enhanced operating platform delivered a 32% increase in copper production and a 20% increase in gold production over the second quarter of 2023 ii , reflecting the benefits of a larger diversified operating platform with the addition of Copper Mountain and the continued execution of operational efficiencies across the business.
- Strong cost control with consolidated cash cost i and sustaining cash cost i per pound of copper produced, net of by-product credits i , in the second quarter of 2024 of $1.14 and $2.65, respectively, in alignment with the cadence of costs expected in 2024.
- Reaffirmed full year 2024 consolidated production guidance for all metals including 137,000 to 176,000 tonnes of copper and 263,000 to 319,000 ounces of gold as the company expects stronger production in the second half of 2024 in accordance with the mine production profile.
- Improved 2024 annual operating cost guidance with decreased consolidated cash cost i guidance range of $0.90 to $1.10 per pound, a result of meaningful exposure to gold by-product credits and continued strong cost control.
- Peru operations continued to benefit from strong mill throughput, averaging approximately 85,000 tonnes per day in the second quarter despite a planned semi-annual mill maintenance shutdown. The Pampacancha stripping program to advance to higher grades later this year is well underway. The reduced mining from Pampacancha resulted in 19,217 tonnes of copper and 10,672 ounces of gold produced in the second quarter of 2024, in line with quarterly cadence expectations. Peru cash cost per pound of copper produced, net of by-product credits i , in the second quarter was $1.78, an expected increase from the first quarter given lower planned production levels, and a 17% decrease compared to the second quarter of 2023.
- Manitoba operations produced 43,488 ounces of gold in the second quarter of 2024 as New Britannia continues to operate well above nameplate capacity and budgeted throughput levels. Manitoba cash cost per ounce of gold produced, net of by-product credits i , was $771 during the second quarter of 2024, similar to the first quarter, and a decrease of 30% compared to the same quarter last year.
- British Columbia operations produced 6,719 tonnes of copper at a cash cost per pound of copper produced, net of by-product credits i , of $2.67 in the second quarter. Cash cost improved by 23% over the first quarter, reflecting ongoing operational stabilization efforts as mine stripping activities are accelerated and mill improvement initiatives are underway at Copper Mountain.
- Achieved revenue of $425.5 million and operating cash flow before change in non-cash working capital of $122.0 million in the second quarter of 2024.
- Second quarter net loss attributable to owners and loss per share attributable to owners were $16.6 million and $0.05, respectively. After adjusting for items on a pre-tax basis such as a non-cash gain of $2.7 million related to a quarterly revaluation of the company's closed site environmental reclamation provision, a $10.7 million revaluation loss related to the gold prepayment liability, unrealized strategic gold and copper hedges and investments and a $2.1 million write-down of PP&E, among other items, second quarter adjusted earnings i per share attributable to owners was nil.
- Net loss attributable to owners of $16.6 million in the second quarter was meaningfully impacted by tax expense of $20.8 million despite having earnings before tax of only $0.4 million. The elevated tax expense was due to mining taxes that are calculated based on taxable mining profits in each operating jurisdiction, the limited deductibility of certain expenses and foreign exchange fluctuations on deferred tax balances.
- Adjusted EBITDA i was $145.0 million during the second quarter of 2024.
- Cash and cash equivalents and short-term investments increased by $274.0 million to $523.8 million during the first half of 2024 due to a successful equity offering and strong operating cash flows bolstered by higher copper and gold prices, enabling a $405.9 million reduction in net debt i during the first half of 2024.
Accelerated Deleveraging and Transformed Balance Sheet
- Hudbay's unique copper and gold diversification in Peru and North America provides exposure to higher copper and gold prices and attractive free cash flow generation.
- Achieved trailing 12 month adjusted EBITDA i of $824.3 million, a substantial increase from $407.1 million for the 12 months ending June 30, 2023.
- Completed successful equity offering on May 24, 2024 for gross proceeds of $402.5 million and net proceeds of $386.2 million, net of transaction costs, to accelerate growth and deleveraging.
- Significantly accelerated deleveraging efforts. Repaid all $90.0 million of advances outstanding on the senior secured credit facilities during the second quarter of 2024 and made open market purchases of approximately $34.1 million of the company's senior unsecured notes in June 2024, at a discount. Long-term debt reduced to $1,155.6 million at June 30, 2024 from $1,278.6 million at March 31, 2024.
- Reduced net debt i to $631.8 million in the second quarter of 2024, reflecting a reduction of $405.9 million over the first half of 2024.
- The increase in cash and reduction in long-term debt significantly reduced net debt to adjusted EBITDA i to 0.8x at June 30, 2024 compared to 1.6x at the end of 2023. Achieved the targeted 1.2x net debt to adjusted EBITDA i ratio outlined in the three prerequisites plan (the "3-P plan") for advancing Copper World well ahead of schedule.
- Deleveraging efforts continued into the third quarter of 2024 with an additional $48.5 million of open market purchases of the company's senior unsecured notes in July and August.
- Scheduled to complete the final payment under the gold prepay liability in August 2024, which was the financing instrument used to fund the refurbishment of the New Britannia gold mill. The elimination of the gold prepay will further increase the company's exposure to higher gold production in Snow Lake.
- Total liquidity substantially increased by 65% to $948.5 million at June 30, 2024 from $573.7 million at the end of 2023.
Continued Execution of Growth Initiatives to Further Enhance Copper and Gold Exposure
- Successfully ratified multi-year agreements with the unions representing members of Hudbay's workforce in Peru and Manitoba, with no disruption to operations, demonstrating the company's focus on working closely with its employees and community stakeholders to ensure aligned economic and social benefits.
- Stripping program for the next mining phase at Pampacancha is underway and is expected to lead to significantly higher copper and gold grades in the fourth quarter of 2024, which together with maintaining strong operating performance at Constancia is expected to continue to generate meaningful free cash flow in Peru.
- The New Britannia mill continued to exceed expectations, driving higher gold production in Manitoba. The mill achieved record throughput levels of nearly 2,100 tonnes per day in June and averaged 1,850 tonnes per day in the second quarter, exceeding its original design capacity of 1,500 tonnes per day and its 2024 budgeted capacity of 1,800 tonnes per day due to the successful implementation of process improvement initiatives and effective preventative maintenance measures.
- Post-acquisition plans to stabilize the Copper Mountain operations remain in progress with a focus on mining fleet ramp-up activities, accelerated stripping and increasing mill reliability. Higher mill availability of 94% and better-than-planned copper recoveries of 82% were achieved in the second quarter of 2024.
- The development of an access drift to the 1901 deposit in Snow Lake remains on track to reach mineralization in early 2025 and is intended to enable confirmation of the optimal mining method for the deposit and underground drilling to further evaluate the orebody and upgrade inferred gold resources to reserves.
- Continued to progress the 3-P plan for sanctioning Copper World, with transformed balance sheet nearing targeted levels and remaining key state permits progressing on track and expected in 2024.
- Drill permitting for highly prospective Maria Reyna and Caballito properties near Constancia continues to advance through the multi-step regulatory process with the environmental impact assessment application approved for Maria Reyna in June and the Caballito application progressing through the review stage.
- Results from the winter 2024 exploration program in Snow Lake confirm two mineralized zones located 400 metres northwest of Lalor with an intersection of 9 metres grading 2.88% copper and 6.27 grams per tonne gold. Also identified follow-up targets for a summer 2024 drill program to test new geophysical anomalies, complete follow-up drilling at Lalor Northwest and complete regional drilling at the Snow Lake satellite properties.
- Continuing to advance Flin Flon tailings reprocessing opportunities through metallurgical test work and early economic evaluation to assess the possibility of producing critical minerals and precious metals while reducing the environmental footprint.
- Published 2023 annual sustainability report in June 2024, demonstrating meaningful progress towards achieving Hudbay's long-term sustainability goals and commitments with many 2023 activities focused on "our people, our communities and our planet".
Summary of Second Quarter Results
Consolidated copper production of 28,578 tonnes in the second quarter of 2024 declined from the first quarter of 2024 but was in line with mine plan expectations. Consolidated gold production of 58,614 ounces in the second quarter declined from the strong levels achieved in the first quarter but was in line with mine plan expectations. Production was impacted by lower planned grades in Peru and Manitoba, a planned semi-annual mill maintenance shutdown in Peru and the execution of planned stripping programs at Pampacancha and Copper Mountain to access higher grades.
In the second quarter of 2024, consolidated cash cost per pound of copper produced, net of by-product credits i , was $1.14, compared to $0.16 in the first quarter of 2024. This change was mainly the result of lower gold by-product credits from lower gold sales volumes as well as lower copper production. Consolidated sustaining cash cost per pound of copper produced, net of by-product credits i , was $2.65 in the second quarter of 2024 compared to $1.32 in the prior quarter, due to the same reasons outlined above as well as higher sustaining capital expenditures in line with company guidance expectations.
During the second quarter of 2024, cash generated from operating activities of $138.5 million was relatively unchanged from the first quarter of 2024. Operating cash flow before change in non-cash working capital of $122.0 million in the second quarter of 2024 was lower than the first quarter. Operating cash flow before change in non-cash working capital was impacted by lower planned production levels, partially offset by higher realized metal prices and continued strong operational cost performance across the business. It was also impacted by lower copper sales volumes in Peru and lower zinc sales volumes in Manitoba due to timing of shipments. These cash flows benefited from effective working capital management as the company reduced stockpile while collecting on its receivables. Adjusted EBITDA i was $145.0 million in the second quarter compared to $214.2 million in the first quarter of 2024 and was impacted by the same factors affecting operating cash flow as noted above.
Net loss attributable to owners and loss per share attributable to owners in the second quarter of 2024 were $16.6 million and $0.05, respectively, compared to net earnings attributable to owners and earnings per share attributable to owners of $59.4 million and $0.17, respectively, in the first quarter 2024. Net loss attributable to owners of $16.6 million was meaningfully impacted by tax expense of $20.8 million despite having earnings before tax of only $0.4 million in the quarter. The elevated tax expense was due to mining taxes that are calculated based on taxable mining profits in each operating jurisdiction, the limited deductibility of certain expenses and foreign exchange fluctuations on deferred tax balances. Adjusted net earnings attributable to owners i and adjusted net earnings per share attributable to owners i in the second quarter of 2024 were $0.1 million and nil per share, respectively, after adjusting for a $10.7 million revaluation loss related to the gold prepayment liability and revaluation of the company's strategic gold and copper hedges and investments, an $8.8 million revaluation of share-based compensation due to a higher share price and a $2.1 million write-down of PP&E, among other items.
As at June 30, 2024, total liquidity was $948.5 million, including $483.8 million in cash and cash equivalents, $40.0 million in short-term investments as well as undrawn availability of $424.7 million under the company's revolving credit facilities. Net debt i declined substantially by $362.4 million during the second quarter of 2024 to $631.8 million as part of the company's efforts to deleverage the balance sheet. This was driven by the free cash flow generation from the operations and the equity offering which contributed cash of $386.2 million, net of transaction and issuance costs. Some of these funds were utilized to repay all $90.0 million of debt outstanding on the senior secured credit facilities as at March 31, 2024 and to repurchase and retire approximately $34.1 million of the company's senior unsecured notes. As a result, Hudbay has made significant progress towards achieving the deleveraging targets outlined in the 3-P plan for sanctioning Copper World.
| Consolidated Financial Condition ($000s) | Jun. 30, 2024 | Mar. 31, 2024 | Dec. 31, 2023 | |
| Cash and cash equivalents and short-term investments | 523,767 | 284,385 | 249,794 | |
| Total long-term debt | 1,155,575 | 1,278,587 | 1,287,536 | |
| Net debt 1 | 631,808 | 994,202 | 1,037,742 | |
| Working capital 2 | 423,088 | 200,850 | 135,913 | |
| Total assets | 5,442,422 | 5,231,283 | 5,312,634 | |
| Equity 3 | 2,482,545 | 2,107,532 | 2,096,811 | |
| Net debt to adjusted EBITDA 1,4 | 0.8 | 1.3 | 1.6 | |
| 1 Net debt and net debt to adjusted EBITDA are non-IFRS financial performance measures with no standardized definition under IFRS. For further information, please see the "Non-IFRS Financial Performance Measures" section of this news release. 2 Working capital is determined as total current assets less total current liabilities as defined under IFRS and disclosed on the consolidated interim financial statements. 3 Equity attributable to owners of the company. 4 Net debt to adjusted EBITDA for the 12 month period. | ||||
| Consolidated Financial Performance | Three Months Ended | |||||
| Jun. 30, 2024 | Mar. 31, 2024 | Jun. 30, 2023 3 | ||||
| Revenue | $000s | 425,520 | 524,989 | 312,166 | ||
| Cost of sales | $000s | 347,893 | 373,035 | 289,273 | ||
| Earnings (loss) before tax | $000s | 441 | 67,750 | (30,731 | ) | |
| Net (loss) earnings | $000s | (20,377 | ) | 18,535 | (14,932 | ) |
| Net (loss) earnings attributable to owners | $000s | (16,583 | ) | 22,358 | (14,932 | ) |
| Basic earnings (loss) per share 1 | $/share | (0.05 | ) | 0.06 | (0.05 | ) |
| Adjusted earnings (loss) per share 1,2 | $/share | 0.00 | 0.17 | (0.07 | ) | |
| Operating cash flow before change in non-cash working capital | $ millions | 122.0 | 147.5 | 55.9 | ||
| Adjusted EBITDA 2 | $ millions | 145.0 | 214.2 | 81.2 | ||
| 1 Attributable to owners of the company. 2 Adjusted earnings (loss) per share attributable to owners and adjusted EBITDA are non-IFRS financial performance measures with no standardized definition under IFRS. For further information, please see the "Non-IFRS Financial Performance Measures" section. 3 Following completion of the Copper Mountain acquisition on June 20, 2023, the company's financial performance has not been materially affected by Copper Mountain's operations with no revenues or corresponding cost of sales recorded during the 10-day stub period from the date of acquisition to the end of the second quarter of 2023. | ||||||
| Consolidated Production and Cost Performance 1 | Three Months Ended | |||||
| Jun. 30, 2024 | Mar. 31, 2024 | June. 30, 2023 | ||||
| Contained metal in concentrate and doré produced 2 | ||||||
| Copper | tonnes | 28,578 | 34,749 | 21,715 | ||
| Gold | ounces | 58,614 | 90,392 | 48,996 | ||
| Silver | ounces | 738,707 | 947,917 | 612,310 | ||
| Zinc | tonnes | 8,087 | 8,798 | 8,758 | ||
| Molybdenum | tonnes | 369 | 397 | 414 | ||
| Payable metal sold | ||||||
| Copper | tonnes | 25,799 | 33,608 | 23,078 | ||
| Gold 3 | ounces | 61,295 | 108,081 | 47,533 | ||
| Silver 3 | ounces | 667,036 | 1,068,848 | 805,448 | ||
| Zinc | tonnes | 5,133 | 6,119 | 8,641 | ||
| Molybdenum | tonnes | 347 | 415 | 314 | ||
| Consolidated cash cost per pound of copper produced 4 | ||||||
| Cash cost | $/lb | 1.14 | 0.16 | 1.60 | ||
| Sustaining cash cost | $/lb | 2.65 | 1.03 | 2.73 | ||
| All-in sustaining cash cost | $/lb | 3.07 | 1.32 | 2.98 | ||
| 1 Includes 100% of Copper Mountain mine production. Hudbay owns 75% of Copper Mountain mine. As Copper Mountain was acquired on June 20, 2023, the production for the three months ended June 30, 2023 represents the 10-day stub period following the acquisition through to the end of the second quarter of 2023. | ||||||
| 2 Metal reported in concentrate is prior to deductions associated with smelter contract terms. | ||||||
| 3 Includes total payable gold and silver in concentrate and in doré sold. | ||||||
| 4 Cash cost, sustaining cash cost and all-in sustaining cash cost per pound of copper produced, net of by-product credits, are non-IFRS financial performance measures with no standardized definition under IFRS. For further information, please see the "Non-IFRS Financial Performance Measures" section of this news release. | ||||||
Production Guidance Reaffirmed and Cash Cost Guidance Improved
Hudbay has reaffirmed its full year 2024 consolidated production guidance for all metals, including 137,000 to 176,000 tonnes of copper and 263,000 to 319,000 ounces of gold as the company anticipates stronger production in the second half of 2024 in accordance with the mine production profile. The company expects 2024 consolidated copper production to be below the midpoint of the guidance range, while 2024 consolidated gold production is expected to be above the midpoint of the guidance range. This is a result of a combination of lower-than-expected grades and timing impacts from heavy rains in Peru, as well as the ongoing ramp-up of stabilization efforts at Copper Mountain, offset by the continued strong operational performance in Manitoba driven by New Britannia performance and grades exceeding the company's expectations.
The company is improving its 2024 annual consolidated cash cost guidance range to $0.90 to $1.10 per pound from the original guidance range of $1.05 to $1.25 per pound, as a result of meaningful exposure to gold by-product credits and continued strong cost control. Hudbay has reaffirmed all other 2024 guidance metrics.
Peru Operations Review
| Peru Operations | Three Months Ended | |||||
| Jun. 30, 2024 | Mar. 31, 2024 | Jun. 30, 2023 | ||||
| Constancia ore mined 1 | tonnes | 5,277,654 | 2,559,547 | 3,647,399 | ||
| Copper | % | 0.29 | 0.31 | 0.31 | ||
| Gold | g/tonne | 0.03 | 0.04 | 0.04 | ||
| Silver | g/tonne | 2.50 | 2.79 | 2.49 | ||
| Molybdenum | % | 0.01 | 0.01 | 0.01 | ||
| Pampacancha ore mined 1 | tonnes | 1,288,789 | 2,214,354 | 2,408,495 | ||
| Copper | % | 0.41 | 0.56 | 0.36 | ||
| Gold | g/tonne | 0.20 | 0.32 | 0.34 | ||
| Silver | g/tonne | 3.83 | 4.64 | 2.81 | ||
| Molybdenum | % | 0.02 | 0.02 | 0.02 | ||
| Total ore mined | tonnes | 6,566,443 | 4,773,901 | 6,055,894 | ||
| Strip ratio 4 | 1.74 | 1.95 | 1.74 | |||
| Ore milled | tonnes | 7,718,962 | 8,077,962 | 7,223,048 | ||
| Copper | % | 0.30 | 0.36 | 0.31 | ||
| Gold | g/tonne | 0.07 | 0.15 | 0.09 | ||
| Silver | g/tonne | 2.85 | 3.48 | 2.78 | ||
| Molybdenum | % | 0.01 | 0.01 | 0.01 | ||
| Copper recovery | % | 83.1 | 84.9 | 80.0 | ||
| Gold recovery | % | 61.4 | 73.4 | 61.1 | ||
| Silver recovery | % | 63.9 | 70.7 | 65.1 | ||
| Molybdenum recovery | % | 46.3 | 43.2 | 40.5 | ||
| Contained metal in concentrate | ||||||
| Copper | tonnes | 19,217 | 24,576 | 17,682 | ||
| Gold | ounces | 10,672 | 29,144 | 12,998 | ||
| Silver | ounces | 450,833 | 639,718 | 419,642 | ||
| Molybdenum | tonnes | 369 | 397 | 414 | ||
| Payable metal sold | ||||||
| Copper | tonnes | 16,806 | 23,754 | 21,207 | ||
| Gold | ounces | 13,433 | 42,677 | 14,524 | ||
| Silver | ounces | 400,302 | 753,707 | 671,532 | ||
| Molybdenum | tonnes | 347 | 415 | 314 | ||
| Combined unit operating cost 2,3 | $/tonne | 12.68 | 10.92 | 14.07 | ||
| Cash cost 3 | $/lb | 1.78 | 0.43 | 2.14 | ||
| Sustaining cash cost 3 | $/lb | 2.61 | 1.06 | 3.06 | ||
| 1 Reported tonnes and grade for ore mined are estimates based on mine plan assumptions and may not reconcile fully to ore milled. | ||||||
| 2 Reflects combined mine, mill and general and administrative ("G&A") costs per tonne of ore milled. Reflects the deduction of expected capitalized stripping costs. | ||||||
| 3 Combined unit costs, cash cost and sustaining cash cost per pound of copper produced, net of by-product credits, are non-IFRS financial performance measures with no standardized definition under IFRS. For further information, please see the "Non-IFRS Financial Performance Measures" section of this news release. | ||||||
| 4 Strip ratio is calculated as waste mined divided by ore mined. | ||||||
During the second quarter of 2024, the Peru operations produced 19,217 tonnes of copper, 10,672 ounces of gold, 450,833 ounces of silver and 369 tonnes of molybdenum. Production was lower than the first quarter of 2024 primarily due to planned lower grades as the company executes a stripping program at Pampacancha to advance to the next mining phase, as further discussed below, in addition to a planned semi-annual mill maintenance shutdown in the second quarter. The company is on track to achieve its 2024 production guidance for all metals in Peru.
Total ore mined in the second quarter of 2024 increased by 38% compared to the first quarter and was in line with the mine plan. Ore mined from Pampacancha during the second quarter decreased to 1.3 million tonnes compared with 2.2 million tonnes in the first quarter of 2024 as a result of higher capitalized stripping activities. Mining efforts at Pampacancha are focused on continuing the stripping program to advance to the next mining phase and the company is on track to resume mining in higher copper and gold grade areas later in the year.
The Peru operations continue to benefit from strong mill throughput, averaging approximately 87,000 tonnes processed per day year-to-date. Ore milled during the second quarter of 2024 was 4% lower than the first quarter due to the scheduled semi-annual mill maintenance shutdown. Ore milled included supplemental ore feed from stockpiles during the quarter as the team advances pit stripping activities. Milled copper and gold grades of 0.30% and 0.07 grams per tonne, respectively, decreased in the second quarter of 2024 compared to the first quarter due to lower amounts of high-grade copper and gold from Pampacancha, in addition to lower grades from the processing of stockpiled ore. Recoveries of copper and gold during the second quarter of 2024 were 83% and 61%, respectively, and were in line with metallurgical models.
Combined mine, mill and G&A unit operating costs i in the second quarter were $12.68 per tonne, 16% higher than the first quarter of 2024 primarily due to higher milling costs and lower throughput associated with the planned semi-annual mill maintenance shutdown.
Payable copper metal sold in the second quarter of 2024 was lower than the first quarter due to lower copper production and a 10,000 wet metric tonne copper concentrate shipment that remained unsold at the end of the second quarter and was recognized as revenue early in the third quarter of 2024.
Cash cost per pound of copper produced, net of by-product credits i , in the second quarter of 2024 was $1.78, an increase from the $0.43 achieved in the first quarter of 2024 due to lower planned copper production, higher milling costs and lower by-product credits, partly offset by lower treatment and refining charges. Full year cash costs are expected to be within the 2024 guidance range.
Sustaining cash cost per pound of copper produced, net of by-product credits i , was $2.61 for the second quarter, higher than the first quarter of 2024 of $1.06, primarily due to the same factors affecting cash cost.
During the quarter, the Peruvian Ministry of Energy and Mines approved a regulatory change, Supreme Decree 011-2024-EM, to allow mining companies in Peru to increase throughput by up to 10% above permitted levels. Previously, the regulation only allowed for an increase of up to 5%. As such, the company is evaluating the potential to increase future production at Constancia.
Manitoba Operations Review
| Manitoba Operations | Three Months Ended | |||||
| Jun. 30, 2024 | Mar. 31, 2024 | Jun. 30, 2023 | ||||
| Lalor | ||||||
| Ore mined | tonnes | 385,478 | 407,708 | 413,255 | ||
| Gold | g/tonne | 3.75 | 4.84 | 4.07 | ||
| Copper | % | 0.69 | 0.84 | 0.81 | ||
| Zinc | % | 2.76 | 2.92 | 3.14 | ||
| Silver | g/tonne | 22.29 | 23.44 | 23.27 | ||
| New Britannia | ||||||
| Ore milled | tonnes | 167,899 | 170,409 | 141,905 | ||
| Gold | g/tonne | 5.31 | 7.03 | 5.82 | ||
| Copper | % | 0.94 | 1.13 | 0.77 | ||
| Zinc | % | 0.92 | 0.82 | 0.85 | ||
| Silver | g/tonne | 24.42 | 21.6 | 25.79 | ||
| Gold recovery 1 | % | 90 | 88.6 | 88.6 | ||
| Copper recovery | % | 94.4 | 96.2 | 91.2 | ||
| Silver recovery 1 | % | 83.1 | 82 | 79.6 | ||
| Stall Concentrator | ||||||
| Ore milled | tonnes | 229,527 | 219,358 | 238,633 | ||
| Gold | g/tonne | 3.02 | 3.07 | 3.12 | ||
| Copper | % | 0.59 | 0.64 | 0.85 | ||
| Zinc | % | 4.05 | 4.54 | 4.47 | ||
| Silver | g/tonne | 21.74 | 24.46 | 22.15 | ||
| Gold recovery | % | 65.5 | 68 | 59.9 | ||
| Copper recovery | % | 85.4 | 91.7 | 88.5 | ||
| Zinc recovery | % | 87.1 | 88.4 | 82.2 | ||
| Silver recovery | % | 54.2 | 59.8 | 60.3 | ||
| Total contained metal in concentrate and doré 1 | ||||||
| Gold | ounces | 43,488 | 56,831 | 35,253 | ||
| Copper | tonnes | 2,642 | 3,149 | 2,794 | ||
| Zinc | tonnes | 8,087 | 8,798 | 8,758 | ||
| Silver | ounces | 210,647 | 219,823 | 180,750 | ||
| Total payable metal sold | ||||||
| Gold | ounces | 42,763 | 62,003 | 33,009 | ||
| Copper | tonnes | 2,429 | 2,921 | 1,871 | ||
| Zinc | tonnes | 5,133 | 6,119 | 8,641 | ||
| Silver | ounces | 197,486 | 231,841 | 133,916 | ||
| Combined unit operating cost 2,3 | C$/tonne | 225 | 235 | 220 | ||
| Gold cash cost | $/oz | 771 | 736 | 1,097 | ||
| Gold sustaining cash cost 3 | $/oz | 1,163 | 950 | 1,521 | ||
| 1 Gold and silver recovery includes total recovery from concentrate and doré. 2 Combined unit cost, cash cost, sustaining cash cost per pound of copper produced, net of by-product credits, gold cash cost and sustaining cash cost per ounce of gold produced, net of by-product credits, are non-IFRS financial performance measures with no standardized definition under IFRS. For further information, please see the "Non-IFRS Financial Performance Measures" section of this news release. 3 Reflects combined mine, mill and G&A costs per tonne of ore milled. | ||||||
The Manitoba operations produced 43,488 ounces of gold, 2,642 tonnes of copper, 8,087 tonnes of zinc and 210,647 ounces of silver during the second quarter of 2024. Compared to the exceptional results achieved in the first quarter of 2024, production decreased primarily due to a planned lower grade mining sequence in the quarter. The Snow Lake operations in Manitoba maintained steady production results despite overcoming challenges in the second quarter of 2024, including forest fires and temporary production interruptions at the Lalor mine, partially offset by stronger than budgeted throughput at New Britannia. The Manitoba team's resilience and dedication ensured that the operations continued to function effectively and efficiently while achieving quarterly production targets. The company is on track to achieve its 2024 production guidance for all metals in Manitoba.
Total ore mined in Manitoba in the second quarter of 2024 was 5% lower than the first quarter. Gold, copper, zinc and silver grades mined at Lalor during the second quarter were 23%, 18%, 5% and 5% lower, respectively, compared with the first quarter of 2024. These changes reflect temporary Lalor mine production disruptions and the completion of a planned lower grade mining sequence in the quarter. During the quarter, the Lalor mine encountered issues with the production hoist gearbox and electrical faults on the hoist drives, causing a ten-day stoppage in hoisting ore. The maintenance teams collaborated closely with original equipment manufacturers to resolve these issues quickly. During the hoisting outage, the operations team focused on value-added activities, including underground ore buildup close to the shaft, waste filling, increased maintenance, building longhole inventory, and trucking ore to surface. Additionally, the team implemented stope design modifications that yielded positive results by improving mucking efficiency throughout the lifecycle of the stopes.
The New Britannia mill consistently operated above nameplate capacity, averaging approximately 1,850 tonnes per day in the second quarter of 2024 and achieving a new monthly record of nearly 2,100 tonnes per day in June. Ongoing efforts to increase throughput are aligned with the company's long-term objectives to maximize gold production by directing more gold ore from Lalor to the New Britannia mill for higher gold recoveries. Recoveries of gold, copper and silver in the second quarter of 2024 were 90%, 94% and 83%, respectively.
The Stall mill processed 5% more ore in the second quarter of 2024 than the first quarter. Recoveries of gold, copper and silver in the second quarter of 2024 were slightly lower than the first quarter primarily due to lower grades.
Combined mine, mill and G&A unit operating costs i in the second quarter of 2024 were C$225 per tonne, a 5% decrease compared to the first quarter. This decrease was a result of higher throughput and lower mining, milling and G&A costs compared to the first quarter.
Payable zinc metal sold was lower than prior periods as there was a 10,000 wet metric tonne zinc concentrate shipment that remained unsold at the end of the second quarter and will be recognized as revenue in the third quarter of 2024.
Cash cost per ounce of gold produced, net of by-product credits i , in the second quarter of 2024 was $771 per ounce, a 5% increase compared to the first quarter primarily due to lower gold production. Full year gold cash cost is expected to remain within the 2024 guidance range.
Sustaining cash cost per ounce of gold produced, net of by-product credits i , in the second quarter of 2024 was $1,163, an increase of 22% compared to the first quarter due to lower gold production and higher sustaining capital costs during the quarter.
Hudbay's Manitoba operation also progressed its sustainability initiatives by reducing propane and diesel consumption in the first half of 2024 compared to the same period in 2023. In addition, at Lalor, an initiative to capture and recycle natural groundwater and use it as process water to reduce the freshwater intake into the mine has proven to be effective.
British Columbia Operations Review
| British Columbia Operations | Three Months Ended 5 | ||||||||
| Jun. 30, 2024 | Mar. 31, 2024 | ||||||||
| Ore mined 1 | tonnes | 2,164,722 | 3,722,496 | ||||||
| Strip ratio 2 | 7.61 | 4.10 | |||||||
| Ore milled | tonnes | 3,232,427 | 3,180,149 | ||||||
| Copper | % | 0.25 | 0.27 | ||||||
| Gold | g/tonne | 0.07 | 0.07 | ||||||
| Silver | g/tonne | 1.01 | 1.19 | ||||||
| Copper recovery | % | 82.3 | 83.4 | ||||||
| Gold recovery | % | 57.2 | 61.8 | ||||||
| Silver recovery | % | 73.9 | 72.4 | ||||||
| Total contained metal in concentrate 2 | |||||||||
| Copper | tonnes | 6,719 | 7,024 | ||||||
| Gold | ounces | 4,454 | 4,417 | ||||||
| Silver | ounces | 77,227 | 88,376 | ||||||
| Total payable metal sold | |||||||||
| Copper | tonnes | 6,564 | 6,933 | ||||||
| Gold | ounces | 5,099 | 3,401 | ||||||
| Silver | ounces | 69,248 | 83,300 | ||||||
| Combined unit operating cost 3,4 | C$/tonne | 19.65 | 23.67 | ||||||
| Cash cost 4 | $/lb | 2.67 | 3.49 | ||||||
| Sustaining cash cost 4 | $/lb | 5.56 | 4.85 | ||||||
| 1 Reported tonnes and grade for ore mined are estimates based on mine plan assumptions and may not reconcile fully to ore milled. | |||||||||
| 2 Strip ratio is calculated as waste mined divided by ore mined. | |||||||||
| 3 Reflects combined mine, mill and G&A costs per tonne of ore milled. Reflects the deduction of expected capitalized stripping costs. | |||||||||
| 4 Combined unit operating cost, cash cost and sustaining cash cost per pound of copper produced, net of by-product credits, are non-IFRS financial performance measures with no standardized definition under IFRS. For further information, please see the "Non-IFRS Financial Performance Measures" section of this news release. 5 Copper Mountain mine results are stated at 100%. Hudbay owns 75% of Copper Mountain mine. | |||||||||
During the second quarter of 2024, the British Columbia operations produced 6,719 tonnes of copper, 4,454 ounces of gold and 77,227 ounces of silver. Production of copper was slightly lower than the first quarter of 2024 primarily as a result of lower head grades from the use of stockpiled ore to feed the mill while mining activities are focused on executing the planned stripping program. Gold production was consistent with the first quarter of 2024. The company has reaffirmed its 2024 production guidance ranges for all metals in British Columbia.
Hudbay has been focused on advancing operational stabilization plans, including opening up the mine by adding additional mining faces, adding to the mining fleet, optimizing the ore feed to the plant and implementing plant improvement initiatives that mirror Hudbay's successful processes at Constancia. While the benefits of these stabilization plans are not expected to be fully realized until 2025, the mine has successfully increased the total tonnes moved and has seen stronger mill performance as demonstrated by higher mill availability of 94% and above-target copper recoveries of 82% in the second quarter of 2024. As a result, year-to-date mill performance has resulted in the highest mill availability and highest copper recoveries in the last decade.
Total ore mined at Copper Mountain in the second quarter of 2024 was 2.2 million tonnes, a decrease compared to the first quarter of 2024. As planned, ore stockpiles were utilized as ore feed to the mill while the mine operation team increased waste stripping activities. Total material moved continued to ramp up in the quarter as a result of effective usage of the mining fleet as part of the fleet production ramp up plan to execute the accelerated stripping program to access higher head grades. This plan entails remobilization of the existing mining truck fleet and the deployment of an additional shovel, drill and associated equipment. Earlier this year, the company ordered five new haul trucks to execute additional stripping activities over the next three years at a lower cost than the contractor mining approach that was contemplated in the technical report. Three of the five new haul trucks and the additional shovel and drill were put in production in June, and all five haul trucks were in operation by August. As a result, total material moved is expected to continue to increase quarter-over-quarter as per the mine plan.
The mill processed 3.2 million tonnes of ore during the second quarter of 2024, a 2% increase over the first quarter, benefiting from stabilization and reliability initiatives within the mill processing circuit. The average mill availability during the second quarter of 2024 increased to 94% from 90% in the first quarter, while maintaining a stable throughput rate. Mill throughput in the second quarter of 2024 was limited by reduced reliability of the secondary crushing circuit, caused primarily by unplanned maintenance events and elevated clay material in the mine feed. During the quarter, a number of initiatives were advanced to address these issues and other identified constraints and improve throughput to targeted levels, with the benefits expected to be realized in the second half of 2024. Initiatives that began earlier in the year are progressing on target, including reprogramming the mill expert system, installation of advanced semi-autogenous grinding control instrumentation, redesign of the SAG liner package and updated operational procedures intended to remove magnetite from the pebble stream.
Milled copper grades during the second quarter of 2024 were 7% lower than the first quarter as the company continued to draw on stockpiled ore. Copper recoveries were slightly lower than the first quarter of 2024, but in line with expectations despite lower grades as the operations improved the regrind circuit constraint and implemented the flotation operational strategy improvements, including reagent selection and dose modification.
The benefits of the operational stabilization improvements are expected to continue to be realized throughout 2024. The company is also accelerating engineering studies to debottleneck and increase the nominal plant capacity to 50,000 tonnes per day earlier than was contemplated in the technical report.
Combined mine, mill and G&A unit operating costs i in the second quarter of 2024 were C$19.65 per tonne milled, 17% lower than the first quarter of 2024 primarily due to lower mining costs as there were high ore rehandling costs in the first quarter of 2024. Combined unit operating costs are expected to decrease over time as the company continues to implement its stabilization and optimization initiatives at Copper Mountain. As the hiring and training of additional haul truck drivers continues, the company expects to have a fully trained complement of truck drivers in August to support the larger mining fleet, which is expected to increase material moved and reduce unit operating costs.
Cash cost per pound of copper produced, net of by-product credits i , in the second quarter of 2024 was $2.67. Cash costs were lower than the first quarter of 2024 by 23% for the same reason as mentioned above regarding the unit cost variance. Full year cash costs are expected to be within the 2024 guidance range.
Sustaining cash cost per pound of copper produced, net of by-product credits i , in the second quarter of 2024 was $5.56, 15% higher than the first quarter mainly as a result of planned higher capitalized stripping costs to unlock the mine potential according to the company's stabilization plan.
Enhanced Balance Sheet through Successful Equity Offering and Accelerated Debt Reduction
The company took several prudent measures in the second quarter of 2024 to further improve its balance sheet position, including more than $150 million of combined debt repayments and gold prepayment liability reductions:
- Completed successful $402.5 million equity offering – On May 24, 2024, Hudbay closed a public offering of common shares for gross proceeds of $402.5 million, resulting in net proceeds of $386.2 million after transaction costs.
- Fully repaid $90.0 million outstanding under the revolving credit facilities – The company fully repaid $90 million of debt outstanding under its revolving credit facilities during the quarter with no remaining amounts drawn (other than letters of credit).
- Repurchased and retired $34.1 million of senior unsecured notes – The company made open market purchases of $11.6 million of the 2026 senior unsecured notes and $22.5 million of the 2029 senior unsecured notes during the quarter.
- Delivered $24.0 million under gold forward sale and prepay agreement – The company completed three additional months of gold deliveries during the quarter and is scheduled to fully repay the gold prepay facility by the end of August 2024, which was used to fund the refurbishment of the New Britannia gold mill.
As a result of these deleveraging efforts and continued cash flow generation, Hudbay has substantially reduced net debt i to $631.8 million at June 30, 2024, from $1,037.7 million at the end of 2023. The net debt reduction, together with higher levels of adjusted EBITDA i over the last twelve months, has significantly improved the company's net debt to adjusted EBITDA ratio i to 0.8x compared to 1.6x at the end of 2023.
Subsequent to the quarter, deleveraging efforts continued in July and August with an additional $48.5 million of open market purchases of the senior unsecured notes, at a discount.
The improved balance sheet flexibility and accelerated debt reduction significantly advances the company's progress as part of its 3-P plan for sanctioning Copper World, and results in the successful achievement of the targeted 1.2x net debt to adjusted EBITDA ratio well ahead of schedule.
Disciplined Capital Allocation Driving Increased Copper and Gold Exposure
Hudbay continued to deliver positive free cash flow generation this quarter with strong gold production in Manitoba and strong cost control across the operations, while advancing planned stripping activities in Peru and British Columbia to drive higher copper and gold production levels in the second half of 2024. The company also continues to evaluate areas to further improve mill performance across the business as part of its continuous improvement efforts.
In addition to enhancing balance sheet flexibility through debt repayments as mentioned above, the net proceeds of the equity offering are intended to fund near-term growth initiatives, including acceleration of mine pre-stripping activities and mill optimization initiatives at Copper Mountain, and to evaluate mill throughput enhancement opportunities at Constancia and New Britannia.
Copper Mountain Stabilization Efforts to Drive Higher Copper Production
The key elements of Hudbay's stabilization plans for Copper Mountain include executing a campaign of accelerated stripping to access higher grades and implementing several plant improvement initiatives to increase mill throughput and recoveries.
Earlier this year, the company commenced a three-year accelerated stripping program to mitigate the substantially reduced stripping that occurred over the four years prior to Hudbay's acquisition. The company has successfully remobilized all 28 haul trucks and added five additional haul trucks this year to execute the accelerated stripping campaign at a lower cost and avoid contractor mining costs. The accelerated stripping program is expected to improve operating efficiencies and lower unit operating costs.
Hudbay's mine plan as disclosed in the December 2023 technical report for Copper Mountain assumes a mill ramp up to its nominal capacity of 45,000 tonnes per day in 2025 and an expansion to the permitted capacity of 50,000 tonnes per day in 2027. Mill initiatives are progressing as planned for 2024, including reprogramming the mill expert system, installing advanced grinding control instrumentation, flotation operational strategy improvements and improved maintenance practices. In the second half of 2024, the company is also accelerating various engineering studies to increase mill throughput to 50,000 tonnes per day earlier than was originally contemplated in the technical report.
Hudbay has exceeded the targeted $10 million in annualized corporate synergies and is on track to realize the three-year annual operating efficiencies target.
New Britannia Mill Performance Exceeding Expectations to Drive Higher Gold Production
Hudbay completed the brownfield investment in New Britannia in 2021 and refurbished the mill to a nominal capacity of 1,500 tonnes per day. This provided additional processing capacity to the Snow Lake operations and allowed the company to achieve higher gold recoveries of approximately 90% as Lalor transitioned to the higher gold and copper areas of the mine plan. The New Britannia mill has been consistently exceeding performance expectations, achieving 1,650 tonnes per day in 2023, more than 1,850 tonnes per day in the first half of 2024, and a new monthly record of nearly 2,100 tonnes per day in June 2024.
The final payment for the New Britannia gold prepay financing in August 2024 further enhances the company's exposure to higher gold production in Snow Lake. With approximately two million ounces of contained gold in current mineral reserve estimates and another 1.4 million ounces of contained gold in inferred mineral resources, the New Britannia investment has unlocked significant value in Snow Lake. This could be further enhanced by regional exploration upside and the current strong gold price environment.
In the first quarter of 2024, the company received a permit approval to increase the production rate at New Britannia to 2,500 tonnes per day, which will provide the opportunity to process more Lalor ore at the New Britannia mill and create additional processing capacity for potential new regional discoveries in Snow Lake.
Peru Investment Programs to Drive Higher Copper and Gold Production
The company is well-advanced in executing a stripping program for the next mining phase at the Pampacancha pit. This stripping program is expected to continue until September and is intended to unlock higher copper and gold grades at the Peru operations in the fourth quarter of 2024.
During the second quarter of 2024, the Peruvian government approved regulatory changes to allow mining companies to increase their annual mill throughput levels up to 10% above permitted levels. Hudbay is evaluating the potential to increase planned production levels at Constancia, as early as 2026, which could partially offset the grade declines after the completion of mining at Pampacancha in late 2025.
Advancing Permitting at Copper World
The first key state permit required for Copper World, the Mined Land Reclamation Plan, was initially approved by the Arizona State Mine Inspector in October 2021 and was subsequently amended and approved to reflect a larger private land project footprint. This approval was challenged in state court, but the challenge was dismissed in May 2023. In late 2022, Hudbay submitted the applications for an Aquifer Protection Permit and an Air Quality Permit to the Arizona Department of Environmental Quality. The public comment period for the Aquifer Protection Permit was completed in the second quarter while the public comment period for the Air Quality Permit commenced in July. Hudbay continues to expect to receive these two outstanding state permits in the second half of 2024.
Copper World is one of the highest-grade open pit copper projects in the Americas iii with proven and probable mineral reserves of 385 million tonnes at 0.54% copper. Copper World Phase I contemplates average annual copper production of 85,000 tonnes over a 20-year mine life, at average cash costs and sustaining cash costs of $1.47 and $1.81 per pound of copper, respectively. In addition, there remains approximately 60% of the total copper contained in measured and indicated mineral resources (exclusive of mineral reserves), providing significant potential for a Phase II expansion and mine life extension. The inferred mineral resource estimates are at a comparable copper grade and also provide significant upside potential. Copper World is expected to provide meaningful copper to support the U.S. domestic supply chain.
Exploration Update
Manitoba Exploration
Lalor Northwest Follow-up Drilling Confirms Two Mineralized Zones
Hudbay's 2024 winter drill program included follow-up drilling of a geophysical anomaly located northwest of Lalor, which was initially drilled in 2023. Recent positive assay results at Lalor Northwest confirm the discovery of two mineralized zones located within 400 metres of the existing Lalor underground infrastructure, as shown in Figure 1.
In 2023, hole CH2302 intersected two mineralized zones, including 4.8 metres at 2.97% copper, 2.92 grams per tonne gold and 80.3 grams per tonne of silver. Earlier in 2024, hole CH2406 intersected the same two mineralized zones, including 9.0 metres of 2.88% copper, 6.27 grams per tonne of gold and 88.9 grams per tonne of silver. See "Qualified Person and NI 43-101".
These promising results justified additional follow-up drilling in the summer of 2024 with two drill rigs currently turning at Lalor Northwest. Drilling results are expected to be received by the end of the year and will be used to determine the potential size of Lalor Northwest and the potential for future underground drift development from Lalor for further definition drilling. Lalor Northwest has the potential to add near-term production growth at Lalor, extend mine life and create additional value from the Snow Lake operations.
Snow Lake 2024 Regional Geophysics Program Identifies Prospective Targets; Summer Drill Program Initiated
During the first half of 2024, Hudbay conducted the company's largest geophysics program in its history in Snow Lake. This program resulted in the identification of a number of anomalies and prospective targets across the Snow Lake tenements which are currently being tested near the former Reed and Anderson mines and in the vicinity of the Bur and Rail deposits that were acquired as part of the Rockcliff transaction. Hudbay intends to continue similar size geophysical programs and mapping of the company's consolidated land package in the region in 2025.
The 2024 geophysical program included surface electromagnetic (EM) surveys covering a 25 square kilometre area, as highlighted in Figure 2, including the recently acquired Cook Lake claims that had been previously untested by modern deep geophysics, which was the discovery method for the Lalor deposit. This surface EM survey used cutting-edge techniques that enabled the team to detect deep targets at depths of over 1,000 metres below surface. The new EM methodology is unique to Hudbay and will lead to advanced understanding of the mineralization at depths previously undetectable.
In addition, one very strong deep anomaly located at Cook Lake North, approximately six kilometres from Lalor, was identified through borehole EM surveys. 2024 drilling intersected multiple horizons of non-economic mineralization but a deeper and stronger conductor will be tested in the coming weeks by extending the drill hole at depth as part of the summer-fall 2024 exploration program.
Hudbay continues to execute its 2024 drilling program with the goal of extending known mineralization near the Lalor deposit to further extend mine life as well as to find a new anchor deposit within trucking distance of the Snow Lake processing infrastructure. The 2024 summer drill program is well underway, and the team currently has six drill rigs turning in Snow Lake, including two drills at Lalor Northwest as mentioned above. The company expects to ramp up to eight drill rigs by the end of August to test new geophysical targets and complete follow-up drilling at potential regional satellite deposits. Results from the summer drill program are expected in late 2024.
Advancing Access to the 1901 Deposit
In the first quarter of 2024, Hudbay commenced the development of a smaller profile drift from the existing Lalor ramp towards the 1901 deposit. The 1901 development drift is expected to reach the mineralization in early 2025, following which the company plans to conduct definition drilling intended to confirm the optimal mining method, evaluate the orebody geometry and continuity, and convert inferred mineral resources in the gold lenses to mineral reserves. Pending positive results from the drilling programs, the plan is to initiate a haulage drift and other related mining infrastructure in 2025 and 2026 in anticipation of full production from the 1901 deposit in 2027.
Continuing to Advance Studies for Flin Flon Tailings Reprocessing
Hudbay continues to advance studies to evaluate the opportunity to reprocess Flin Flon tailings where more than 100 million tonnes of tailings have been deposited for over 90 years from the mill and the zinc plant. The studies are evaluating the potential to re-purpose the existing Flin Flon concentrator, which is currently on care and maintenance, with flow sheet modifications to reprocess tailings to recover critical minerals and precious metals while creating environmental and social benefits for the region.
The company continues to advance metallurgical test work, and during the second quarter of 2024, it received results from the initial confirmatory drill program in the section of the tailings facility that was utilized by the zinc plant. The results confirmed the grades of precious metals and critical minerals previously estimated from historical zinc plant records. An early economic study to evaluate the opportunity to reprocess initially the portion where the zinc plant tailings were deposited has shown promising results that warrant further engineering work in the second half of 2024. A similar study is planned with respect to the mill tailings.
Peru Exploration
Hudbay controls a large, contiguous block of mineral rights with the potential to host mineral deposits in close proximity to the Constancia processing facility, including the past producing Caballito property and the highly prospective Maria Reyna property. The company commenced early exploration activities at Maria Reyna and Caballito after completing a surface rights exploration agreement with the community of Uchucarcco in August 2022. As part of the drill permitting process, environmental impact assessment applications were submitted for the Maria Reyna property in November 2023 and for the Caballito property in April 2024. The environmental impact assessment (EIA) for Maria Reyna was approved by the government in June 2024 and the Caballito application continues to make progress through the permitting process. This represents one of several steps in the drill permitting process, which is expected to take approximately 12 months to complete after the EIAs are approved.
New Concentrate Contracts with Attractive Terms
In light of the extremely tight copper concentrate market that currently exists, Hudbay has strategically taken steps to preserve uncommitted copper concentrate units. This has allowed the company to enter into several new contracts covering approximately 20% to 25% of its estimated Constancia concentrate sales over the next four years with favourable treatment and refining charges ("TC/RC"), including contracts with fixed TC/RCs that are negative in certain years and other contracts that have TC/RC priced at significant discounts of 45% to 65% to market benchmark terms.
Collective Bargaining Agreements Ratified in Manitoba and Peru
In June, new three-and-a-half year collective bargaining agreements were ratified by the members of all five unions at Hudbay's Manitoba operations, effective July 1, 2024. In July, a new three-year agreement was signed with the union at Hudbay's Peru operations, effective November 10, 2023. The ratification of these agreements is a significant achievement and demonstrates Hudbay's focus on working closely with its employees and community stakeholders to ensure aligned economic and social benefits.
Dividend Declared
A semi-annual dividend of C$0.01 per share was declared on August 12, 2024. The dividend will be paid out on September 20, 2024 to shareholders of record as of close of business on September 3, 2024.
Website Links
Hudbay:
www.hudbayminerals.com
Management's Discussion and Analysis:
https://www.hudbayminerals.com/MDA824
Financial Statements:
https://www.hudbayminerals.com/FS824
Conference Call and Webcast
| Date: | Tuesday, August 13, 2024 |
| Time: | 11:00 a.m. ET |
| Webcast: | www.hudbay.com |
| Dial in: | 1-844-763-8274 or 647-484-8814 |
Qualified Person and NI 43-101
The technical and scientific information in this news release related to the company's material mineral projects has been approved by Olivier Tavchandjian, P. Geo, Senior Vice President, Exploration and Technical Services. Mr. Tavchandjian is a qualified person pursuant to National Instrument 43-101 – Standards of Disclosure for Mineral Projects ("NI 43-101").
For a description of the key assumptions, parameters and methods used to estimate mineral reserves and resources at Hudbay's material mineral properties, as well as data verification procedures and a general discussion of the extent to which the estimates of scientific and technical information may be affected by any known environmental, permitting, legal title, taxation, sociopolitical, marketing or other relevant factors, please see the technical reports for the company's material properties as filed by Hudbay on SEDAR+ at www.sedarplus.ca and EDGAR at www.sec.gov .
Supplemental Information for Lalor Northwest Drill Holes
| Hole ID | From (m) | To (m) | Interval (m) | Estimated True Width (m) | Cu (%) | Au (g/t) | Zn (%) | Ag (g/t) |
| CH2406 Upper | 1,116.0 | 1,125.0 | 9.0 | 9.0 | 2.88 | 6.27 | 0.40 | 88.9 |
| CH2406 Lower | 1,165.4 | 1,168.4 | 3.0 | 3.0 | 1.10 | 0.75 | 0.01 | 4.8 |
Notes:
1. True widths are estimated based on drill angle and intercept geometry of mineralization.
2. All copper, gold, zinc and silver values are uncut.
3. No SG data so assay results are length weighted.
4. Drill holes CH2401, CH2402, CH2403, CH2404 and CH2405 did not intersect mineralization.
| Hole ID | Easting | Northing | Elevation | Depth | Azimuth | Dip |
| CH2401 | 426,527 | 6,081,767 | 304 | 1,217 | 320 | (77) |
| CH2402 | 426,458 | 6,081,914 | 302 | 1,259 | 350 | (78) |
| CH2403 | 426,458 | 6,081,914 | 302 | 1,286 | 335 | (79) |
| CH2404 | 426,577 | 6,081,893 | 304 | 1,376 | 355 | (81) |
| CH2405 | 426,458 | 6,081,914 | 302 | 629 | 20 | (79) |
| CH2406 | 426,458 | 6,081,914 | 302 | 1,340 | 10 | (78) |
For further information regarding hole CH2302, please refer to the company's news release dated July 27, 2023.
Non-IFRS Financial Performance Measures
Adjusted net earnings (loss) attributable to owners, adjusted net earnings (loss) per share attributable to owners, adjusted EBITDA, net debt, cash cost, sustaining and all-in sustaining cash cost per pound of copper produced, cash cost and sustaining cash cost per ounce of gold produced, combined unit costs and ratios based on these measures are non-IFRS performance measures. These measures do not have a meaning prescribed by IFRS and are therefore unlikely to be comparable to similar measures presented by other issuers. These measures should not be considered in isolation or as a substitute for measures prepared in accordance with IFRS and are not necessarily indicative of operating gross profit or cash flow from operations as determined under IFRS. Other companies may calculate these measures differently.
Management believes adjusted net earnings (loss) attributable to owners and adjusted net earnings (loss) per share attributable to owners provides an alternate measure of the company's performance for the current period and gives insight into its expected performance in future periods. These measures are used internally by the company to evaluate the performance of its underlying operations and to assist with its planning and forecasting of future operating results. As such, the company believes these measures are useful to investors in assessing the company's underlying performance. Hudbay provides adjusted EBITDA to help users analyze the company's results and to provide additional information about its ongoing cash generating potential in order to assess its capacity to service and repay debt, carry out investments and cover working capital needs. Net debt is shown because it is a performance measure used by the company to assess its financial position. Net debt to adjusted EBITDA is shown because it is a performance measure used by the company to assess its financial leverage and debt capacity. Cash cost, sustaining and all-in sustaining cash cost per pound of copper produced are shown because the company believes they help investors and management assess the performance of its operations, including the margin generated by the operations and the company. Cash cost and sustaining cash cost per ounce of gold produced are shown because the company believes they help investors and management assess the performance of its Manitoba operations. Combined unit cost is shown because Hudbay believes it helps investors and management assess the company's cost structure and margins that are not impacted by variability in by-product commodity prices.
The following tables provide detailed reconciliations to the most comparable IFRS measures.
Adjusted Net Earnings (Loss) Attributable to Owners Reconciliation
| Three Months Ended | ||||||||
| (in $ millions) | Jun. 30, 2024 | Mar. 31, 2024 | Jun. 30, 2023 | |||||
| Net earnings for the period | (20.4 ) | 18.5 | (14.9) | |||||
| Tax expense | 20.8 | 49.3 | (15.8) | |||||
| Earnings before tax | 0.4 | 67.8 | (30.7) | |||||
| Adjusting items: | ||||||||
| Mark-to-market adjustments 1 | 19.5 | 12.8 | 0.6 | |||||
| Foreign exchange loss | 2.1 | 4.8 | 1.4 | |||||
| Re-evaluation adjustment - environmental provision 2 | (2.7 ) | (5.3) | (4.7) | |||||
| Variable consideration adjustment - stream revenue and accretion | — | 4.0 | — | |||||
| Inventory adjustments | — | — | 0.9 | |||||
| Acquisition related costs | — | — | 6.8 | |||||
| Reduction of obligation to renounce flow-through expenditures | (0.3 ) | (0.7) | — | |||||
| Restructuring charges | 0.3 | 0.9 | — | |||||
| Loss on disposal of investments | — | — | ||||||
| Write-down/loss on disposal of PP&E | 2.1 | 9.0 | 0.3 | |||||
| Adjusted earnings before income taxes | 21.4 | 93.3 | (25.4) | |||||
| Tax expense | (20.8 ) | (49.3) | 15.8 | |||||
| Tax impact on adjusting items | (2.4 ) | 13.6 | (8.7) | |||||
| Adjusted net earnings | (1.8 ) | 57.6 | (18.3) | |||||
| Adjusted net earnings attributable to non-controlling interest: | ||||||||
| Net loss for the period | 3.8 | 3.8 | — | |||||
| Adjusting items, including tax impact | (1.9 ) | (2.0) | — | |||||
| Adjusted net earnings - attributable to owners | 0.1 | 59.4 | (18.3) | |||||
| Adjusted net earnings ($/share) - attributable to owners | 0.00 | 0.17 | (0.07) | |||||
| Basic weighted average number of common shares outstanding (millions) | 368.3 | 350.8 | 272.2 | |||||
| 1 Includes changes in fair value of the gold prepayment liability, Canadian junior mining investments, other financial assets and liabilities at fair value through net earnings or loss and share-based compensation expenses. 2 Changes from movements to environmental reclamation provisions are primarily related to the Flin Flon operations, which were fully depreciated as of June 30, 2022, as well as other Manitoba non-operating sites. | ||||||||
Adjusted EBITDA Reconciliation
| Three Months Ended | |||||||
| (in $ millions) | Jun. 30, 2024 | Mar. 31, 2024 | Jun. 30, 2023 | ||||
| Net (loss) earnings for the period | (20.4 ) | 18.5 | (14.9) | ||||
| Add back: | |||||||
| Tax expense (recovery) | 20.8 | 49.3 | (15.8) | ||||
| Net finance expense | 44.3 | 44.0 | 30.5 | ||||
| Other expenses | 11.2 | 16.3 | 13.9 | ||||
| Depreciation and amortization | 97.6 | 109.3 | 88.7 | ||||
| Amortization of deferred revenue and variable consideration adjustment | (11.5 ) | (23.2) | (18.1) | ||||
| Adjusting items (pre-tax): | |||||||
| Re-evaluation adjustment - environmental provision | (2.7 ) | (5.3) | (4.7) | ||||
| Inventory adjustments | — | — | 0.9 | ||||
| Option agreement proceeds | — | (0.4) | — | ||||
| Realized loss on non-QP hedges | (2.6 ) | — | — | ||||
| Share-based compensation expenses 1 | 8.3 | 5.7 | 0.7 | ||||
| Adjusted EBITDA | 145.0 | 214.2 | 81.2 | ||||
| 1 Share-based compensation expenses reflected in cost of sales and selling and administrative expenses. | |||||||
Net Debt Reconciliation
| (in $ thousands) | |||||||
| Jun. 30, 2024 | Mar. 31, 2024 | Dec. 31, 2023 | |||||
| Total long-term debt | 1,155,575 | 1,278,587 | 1,287,536 | ||||
| Less: Cash and cash equivalents | (483,767 ) | (284,385) | (249,794) | ||||
| Less: Short-term investments | (40,000 ) | — | — | ||||
| Net debt | 631,808 | 994,202 | 1,037,742 | ||||
| (in $ millions, except net debt to adjusted EBITDA ratio) | |||||||
| Net debt | 631.8 | 994.2 | 1,037.7 | ||||
| Adjusted EBITDA (12-month period) | 824.3 | 760.5 | 647.8 | ||||
| Net debt to adjusted EBITDA | 0.8 | 1.3 | 1.6 | ||||
| Trailing Adjusted EBITDA | Three Months Ended | |||||
| (in $ millions) | Jun. 30, 2024 | Mar. 31, 2024 | Dec. 31, 2023 | Sept. 30, 2023 | Jun. 30, 2023 | Mar. 31, 2023 |
| Net earnings (loss) for the period | (20.4 ) | 18.5 | 33.5 | 45.5 | (14.9) | 5.4 |
| Add back: | ||||||
| Tax expense (recovery) | 20.8 | 49.3 | 47.5 | 38.7 | (15.8) | 12.0 |
| Net finance expense | 44.3 | 44.0 | 48.9 | 30.9 | 30.5 | 35.0 |
| Other expenses | 11.2 | 16.3 | 10.6 | 8.9 | 13.9 | 5.0 |
| Depreciation and amortization | 97.6 | 109.3 | 121.9 | 113.8 | 88.7 | 67.4 |
| Amortization of deferred revenue and variable consideration adjustment | (11.5 ) | (23.2) | (26.5) | (16.8) | (18.1) | (15.9) |
| Adjusting items (pre-tax): | ||||||
| Re-evaluation adjustment - environmental provision | (2.7 ) | (5.3) | 34.0 | (32.4) | (4.7) | (8.2) |
| Inventory adjustments | — | — | 1.4 | — | 0.9 | — |
| Realized loss on non-QP hedges | (2.6 ) | — | — | — | — | — |
| Post-employment plan curtailment | — | (0.4) | — | — | — | — |
| Share-based compensation expenses 2 | 8.3 | 5.7 | 3.1 | 2.1 | 0.7 | 1.2 |
| Adjusted EBITDA | 145.0 | 214.2 | 274.4 | 190.7 | 81.2 | 101.9 |
| LTM 1,3 | 824.3 | 760.5 | 647.8 | |||
| 1 LTM (last twelve months) as of June 30, 2024, March 31, 2024 and December 31, 2023. 2 Share-based compensation expense reflected in cost of sales and administrative expenses. 3 Annual consolidated results may not be calculated based on amounts presented in this table due to rounding. | ||||||
Copper Cash Cost Reconciliation
| Consolidated | Three Months Ended | ||
| Net pounds of copper produced 1 | |||
| (in thousands) | Jun. 30, 2024 | Mar. 31, 2024 | Jun. 30, 2023 |
| Peru | 42,366 | 54,181 | 38,982 |
| British Columbia 2 | 14,813 | 15,485 | — |
| Manitoba | 5,825 | 6,942 | 6,160 |
| Net pounds of copper produced | 63,004 | 76,608 | 45,142 |
| 1 Contained copper in concentrate. 2 The net pounds of copper produced for British Columbia are only included from the date of acquisition of June 20, 2023. There are no comparative figures for the three months ended June 30, 2023. | |||
| Consolidated | Three Months Ended | ||||||
| Jun. 30, 2024 | Mar. 31, 2024 | Jun. 30, 2023 | |||||
| Cash cost per pound of copper produced | $000s | $/lb | $000s | $/lb | $000s | $/lb | |
| Mining | 93,049 | 1.47 | 102,133 | 1.33 | 73,335 | 1.62 | |
| Milling | 88,065 | 1.40 | 83,474 | 1.09 | 69,869 | 1.55 | |
| G&A | 35,240 | 0.56 | 38,335 | 0.50 | 20,975 | 0.47 | |
| Onsite costs | 216,354 | 3.43 | 223,942 | 2.92 | 164,179 | 3.64 | |
| Treatment & refining | 22,562 | 0.36 | 27,664 | 0.36 | 26,670 | 0.59 | |
| Freight & other | 21,728 | 0.34 | 27,062 | 0.36 | 17,766 | 0.39 | |
| Cash cost, before by-product credits | 260,644 | 4.13 | 278,668 | 3.64 | 208,615 | 4.62 | |
| By-product credits | (188,671 ) | (2.99 ) | (266,686) | (3.48) | (136,417) | (3.02) | |
| Cash cost, net of by-product credits | 71,973 | 1.14 | 11,982 | 0.16 | 72,198 | 1.60 | |
| Consolidated | Three Months Ended | |||||
| Jun. 30, 2024 | Mar. 31, 2024 | Jun. 30, 2023 | ||||
| Supplementary cash cost information | $000s | $/lb 1 | $000s | $/lb 1 | $000s | $/lb 1 |
| By-product credits 2 : | ||||||
| Zinc | 14,916 | 0.23 | 14,589 | 0.19 | 21,896 | 0.48 |
| Gold 3 | 136,189 | 2.16 | 209,812 | 2.74 | 86,026 | 1.91 |
| Silver 3 | 18,088 | 0.29 | 23,039 | 0.30 | 17,281 | 0.38 |
| Molybdenum & other | 19,478 | 0.31 | 19,246 | 0.25 | 11,214 | 0.25 |
| Total by-product credits | 188,671 | 2.99 | 266,686 | 3.48 | 136,417 | 3.02 |
| Reconciliation to IFRS: | ||||||
| Cash cost, net of by-product credits | 71,973 | 11,982 | 72,198 | |||
| By-product credits | 188,671 | 266,686 | 136,417 | |||
| Treatment and refining charges | (22,562 ) | (27,664) | (26,670) | |||
| Share-based compensation expense | 613 | 355 | 60 | |||
| Inventory adjustments | — | (24) | 906 | |||
| Change in product inventory | 9,982 | 9,554 | 15,114 | |||
| Royalties | 1,570 | 2,873 | 2,578 | |||
| Depreciation and amortization 4 | 97,646 | 109,273 | 88,670 | |||
| Cost of sales 5 | 347,893 | 373,035 | 289,273 | |||
| 1 Per pound of copper produced. 2 By-product credits are computed as revenue per consolidated financial statements, amortization of deferred revenue and pricing and volume adjustments. 3 Gold and silver by-product credits do not include variable consideration adjustments with respect to stream arrangements. Variable consideration adjustments are cumulative adjustments to gold and silver stream deferred revenue primarily associated with the net change in mineral reserves and resources or amendments to the mine plan that would change the total expected deliverable ounces under the precious metal streaming arrangement. For the three months ended June 30, 2024 the variable consideration adjustments amounted to nil, the three months ended March 31, 2024 expense of $3,845, and for the three months ended June 30, 2023 nil. 4 Depreciation is based on concentrate sold. 5 As per consolidated interim financial statements. | ||||||
| Peru | Three Months Ended | ||
| (in thousands) | Jun. 30, 2024 | Mar. 31, 2024 | Jun. 30, 2023 |
| Net pounds of copper produced 1 | 42,366 | 54,181 | 38,982 |
| 1 Contained copper in concentrate. | |||
| Peru | Three Months Ended | ||||||
| Jun. 30, 2024 | Mar. 31, 2024 | Jun. 30, 2023 | |||||
| Cash cost per pound of copper produced | $000s | $/lb | $000s | $/lb | $000s | $/lb | |
| Mining | 31,306 | 0.74 | 29,220 | 0.54 | 31,654 | 0.81 | |
| Milling | 51,335 | 1.21 | 43,624 | 0.80 | 54,676 | 1.40 | |
| G&A | 19,349 | 0.46 | 23,092 | 0.43 | 14,867 | 0.38 | |
| Onsite costs | 101,990 | 2.41 | 95,936 | 1.77 | 101,197 | 2.59 | |
| Treatment & refining | 11,081 | 0.26 | 14,975 | 0.28 | 17,097 | 0.44 | |
| Freight & other | 12,593 | 0.30 | 16,580 | 0.30 | 12,424 | 0.32 | |
| Cash cost, before by-product credits | 125,664 | 2.97 | 127,491 | 2.35 | 130,718 | 3.35 | |
| By-product credits | (50,251 ) | (1.19 ) | (104,329) | (1.92) | (47,193) | (1.21) | |
| Cash cost, net of by-product credits | 75,413 | 1.78 | 23,162 | 0.43 | 83,525 | 2.14 | |
| Peru | Three Months Ended | ||||||||||
| Jun. 30, 2024 | Mar. 31, 2024 | Jun. 30, 2023 | |||||||||
| Supplementary cash cost information | $000s | $/lb 1 | $000s | $/lb 1 | $000s | $/lb 1 | |||||
| By-product credits 2 : | |||||||||||
| Gold 3 | 21,550 | 0.51 | 69,533 | 1.28 | 21,638 | 0.55 | |||||
| Silver 3 | 9,704 | 0.23 | 15,550 | 0.29 | 14,341 | 0.37 | |||||
| Molybdenum | 18,997 | 0.45 | 19,246 | 0.35 | 11,214 | 0.29 | |||||
| Total by-product credits | 50,251 | 1.19 | 104,329 | 1.92 | 47,193 | 1.21 | |||||
| Reconciliation to IFRS: | |||||||||||
| Cash cost, net of by-product credits | 75,413 | 23,162 | 83,525 | ||||||||
| By-product credits | 50,251 | 104,329 | 47,193 | ||||||||
| Treatment and refining charges | (11,081 ) | (14,975) | (17,097) | ||||||||
| Share-based compensation expenses | 199 | 116 | 29 | ||||||||
| Change in product inventory | 1,101 | 14,077 | 27,078 | ||||||||
| Royalties | 929 | 2,118 | 2,479 | ||||||||
| Depreciation and amortization 4 | 58,860 | 71,030 | 67,340 | ||||||||
| Cost of sales 5 | 175,672 | 199,857 | 210,547 | ||||||||
| 1 Per pound of copper produced. 2 By-product credits are computed as revenue per consolidated financial statements, including amortization of deferred revenue and pricing and volume adjustments. 3 Gold and silver by-product credits do not include variable consideration adjustments with respect to stream arrangements. 4 Depreciation is based on concentrate sold. 5 As per IFRS consolidated interim financial statements. | |||||||||||
| British Columbia 1 | Three Months Ended | |||
| (in thousands) | Jun. 30, 2024 | Mar. 31, 2024 | ||
| Net pounds of copper produced 2 | 14,813 | 15,485 | ||
| 1 Copper Mountain mine results are states at 100%. Hudbay owns 75% of Copper Mountain mine. As Copper Mountain was acquired on June 20, 2023, there were no comparative figures for the three months ended June 30, 2023. 2 Contained copper in concentrate. | ||||
| British Columbia 1 | Three Months Ended | ||||
| Jun. 30, 2024 | Mar. 31, 2024 | ||||
| Cash cost per pound of copper produced | $000s | $/lb | $000s | $/lb | |
| Mining | 19,463 | 1.31 | 28,553 | 1.85 | |
| Milling | 21,508 | 1.45 | 23,374 | 1.51 | |
| G&A | 5,442 | 0.37 | 3,897 | 0.25 | |
| Onsite costs | 46,413 | 3.13 | 55,824 | 3.61 | |
| Treatment & refining | 4,199 | 0.29 | 3,476 | 0.22 | |
| Freight & other | 3,461 | 0.23 | 4,293 | 0.28 | |
| Cash cost, before by-product credits | 54,073 | 3.65 | 63,593 | 4.11 | |
| By-product credits | (14,523 ) | (0.98 ) | (9,543) | (0.62) | |
| Cash cost, net of by-product credits | 39,550 | 2.67 | 54,050 | 3.49 | |
| British Columbia 1 | Three Months Ended | ||||
| Jun. 30, 2024 | Mar. 31, 2024 | ||||
| Supplementary cash cost information | $000s | $/lb 2 | $000s | $/lb 2 | |
| By-product credits 3 : | |||||
| Gold | 12,204 | 0.82 | 7,564 | 0.49 | |
| Silver | 2,319 | 0.16 | 1,979 | 0.13 | |
| Total by-product credits | 14,523 | 0.98 | 9,543 | 0.62 | |
| Reconciliation to IFRS: | |||||
| Cash cost, net of by-product credits | 39,550 | 54,050 | |||
| By-product credits | 14,523 | 9,543 | |||
| Treatment and refining charges | (4,199 ) | (3,476) | |||
| Share-based compensation expenses | — | 5 | |||
| Change in product inventory | 11,290 | (3,965) | |||
| Royalties | 641 | 755 | |||
| Depreciation and amortization 4 | 14,042 | 11,649 | |||
| Cost of sales 4 | 75,847 | 68,561 | |||
| 1 Copper Mountain mine results are states at 100%. Hudbay owns 75% of Copper Mountain mine. As Copper Mountain was acquired on June 20, 2023, there were no comparative figures for the three months ended June 30, 2023. 2 Per pound of copper produced. 3 By-product credits are computed as revenue per consolidated financial statements, including pricing and volume adjustments. 4 Depreciation is based on concentrate sold. 5 As per consolidated interim financial statements. | |||||
Sustaining and All-in Sustaining Cash Cost Reconciliation
| Consolidated | Three Months Ended | ||||||
| Jun. 30, 2024 | Mar. 31, 2024 | Jun. 30, 2023 | |||||
| All-in sustaining cash cost per pound of copper produced | $000s | $/lb | $000s | $/lb | $000s | $/lb | |
| Cash cost, net of by-product credits | 71,973 | 1.14 | 11,982 | 0.16 | 72,198 | 1.60 | |
| Cash sustaining capital expenditures | 92,973 | 1.48 | 62,314 | 0.80 | 48,253 | 1.07 | |
| Capitalized exploration | 300 | 0.00 | 2,100 | 0.03 | — | — | |
| Royalties | 1,570 | 0.03 | 2,873 | 0.04 | 2,578 | 0.06 | |
| Sustaining cash cost, net of by-product credits | 166,816 | 2.65 | 79,269 | 1.03 | 123,029 | 2.73 | |
| Corporate selling and administrative expenses & regional costs | 19,771 | 0.32 | 18,094 | 0.24 | 9,603 | 0.21 | |
| Accretion and amortization of decommissioning and community agreements 1 | 6,544 | 0.10 | 4,007 | 0.05 | 1,792 | 0.04 | |
| All-in sustaining cash cost, net of by-product credits | 193,131 | 3.07 | 101,370 | 1.32 | 134,424 | 2.98 | |
| Reconciliation to property, plant and equipment additions: | |||||||
| Property, plant and equipment additions | 75,223 | 46,220 | 47,574 | ||||
| Capitalized stripping net additions | 43,374 | 31,983 | 21,640 | ||||
| Total accrued capital additions | 118,597 | 78,203 | 69,214 | ||||
| Less other non-sustaining capital costs 2 | 37,665 | 26,982 | 28,006 | ||||
| Total sustaining capital costs | 80,932 | 51,221 | 41,208 | ||||
| Capitalized lease and equipment financing payments | 9,575 | 8,274 | 4,374 | ||||
| Community agreement cash payments | 678 | 800 | 1,290 | ||||
| Accretion and amortization of decommissioning and restoration obligations 3 | 1,788 | 2,019 | 1,381 | ||||
| Cash sustaining capital expenditures | 92,973 | 62,314 | 48,253 | ||||
| 1 Includes accretion of decommissioning relating to non-productive sites, and accretion and amortization of current community agreements. 2 Other non-sustaining capital costs include Arizona capitalized costs, capitalized interest, capitalized exploration and growth capital expenditures 3 Includes amortization of decommissioning and restoration PP&E assets and accretion of decommissioning and restoration liabilities related to producing sites. | |||||||
| Peru | Three Months Ended | |||||||||
| Jun. 30, 2024 | Mar. 31, 2024 | Jun. 30, 2023 | ||||||||
| Sustaining cash cost per pound of copper produced | $000s | $/lb | $000s | $/lb | $000s | $/lb | ||||
| Cash cost, net of by-product credits | 75,413 | 1.78 | 23,162 | 0.43 | 83,525 | 2.14 | ||||
| Cash sustaining capital expenditures | 33,801 | 0.80 | 29,779 | 0.55 | 33,425 | 0.86 | ||||
| Capitalized exploration 1 | 300 | 0.01 | 2,100 | 0.04 | — | — | ||||
| Royalties | 929 | 0.02 | 2,118 | 0.04 | 2,479 | 0.06 | ||||
| Sustaining cash cost per pound of copper produced | 110,443 | 2.61 | 57,159 | 1.06 | 119,429 | 3.06 | ||||
| 1 Only includes exploration costs incurred for locations near to existing mine operations. | ||||||||||
| British Columbia | Three Months Ended 1 | |||||
| Jun. 30, 2024 | Mar. 31, 2024 | |||||
| Sustaining cash cost per pound of copper produced | $000s | $/lb | $000s | $/lb | ||
| Cash cost, net of by-product credits | 39,550 | 2.67 | 54,050 | 3.49 | ||
| Cash sustaining capital expenditures | 42,109 | 2.84 | 20,361 | 1.31 | ||
| Royalties | 641 | 0.05 | 755 | 0.05 | ||
| Sustaining cash cost per pound of copper produced | 82,300 | 5.56 | 75,166 | 4.85 | ||
| 1 As Copper Mountain was acquired on June 20, 2023, there were no comparative figures for the three months ended June 30, 2023. | ||||||
Gold Cash Cost and Sustaining Cash Cost Reconciliation
| Manitoba | Three Months Ended | |||
| (in thousands) | Jun. 30, 2024 | Mar. 31, 2024 | Jun. 30, 2023 | |
| Net ounces of gold produced 1 | 43,488 | 56,831 | 35,253 | |
| 1 Contained gold in concentrate and doré. | ||||
| Manitoba | Three Months Ended | ||||||
| Jun. 30, 2024 | Mar. 31, 2024 | Jun. 30, 2023 | |||||
| Cash cost per ounce of gold produced | $000s | $/oz | $000s | $/oz | $000s | $/oz | |
| Mining | 42,280 | 973 | 44,360 | 780 | 41,681 | 1,182 | |
| Milling | 15,222 | 350 | 16,476 | 290 | 15,193 | 431 | |
| G&A | 10,449 | 240 | 11,346 | 200 | 6,108 | 173 | |
| Onsite costs | 67,951 | 1,563 | 72,182 | 1,270 | 62,982 | 1,786 | |
| Treatment & refining | 7,282 | 167 | 9,213 | 162 | 9,573 | 271 | |
| Freight & other | 5,674 | 130 | 6,189 | 109 | 5,342 | 152 | |
| Cash cost, before by-product credits | 80,907 | 1,860 | 87,584 | 1,541 | 77,897 | 2,209 | |
| By-product credits | (47,386 ) | (1,090 ) | (45,734) | (805) | (39,218) | (1,112) | |
| Gold cash cost, net of by-product credits | 33,521 | 771 | 41,850 | 736 | 38,679 | 1,097 | |
| Manitoba | Three Months Ended | ||||||
| Jun. 30, 2024 | Mar. 31, 2024 | Jun. 30, 2023 | |||||
| Supplementary cash cost information | $000s | $/oz 1 | $000s | $/oz 1 | $000s | $/oz 1 | |
| By-product credits 2 : | |||||||
| Copper | 25,932 | 596 | 25,635 | 451 | 14,382 | 408 | |
| Zinc | 14,916 | 343 | 14,589 | 257 | 21,896 | 621 | |
| Silver 3 | 6,065 | 140 | 5,510 | 97 | 2,940 | 83 | |
| Other | 473 | 11 | — | — | — | — | |
| Total by-product credits | 47,386 | 1,090 | 45,734 | 805 | 39,218 | 1,112 | |
| Reconciliation to IFRS: | |||||||
| Cash cost, net of by-product credits | 33,521 | 41,850 | 38,679 | ||||
| By-product credits | 47,386 | 45,734 | 39,218 | ||||
| Treatment and refining charges | (7,282 ) | (9,213) | (9,573) | ||||
| Inventory adjustments | — | (24) | 906 | ||||
| Share-based compensation expenses | 414 | 234 | 31 | ||||
| Change in product inventory | (2,409 ) | (558) | (11,964) | ||||
| Royalties | — | — | 99 | ||||
| Depreciation and amortization 3 | 24,744 | 26,594 | 21,330 | ||||
| Cost of sales 4 | 96,374 | 104,617 | 78,726 | ||||
| 1 Per ounce of gold produced. 2 By-product credits are computed as revenue per consolidated interim financial statements, amortization of deferred revenue and pricing and volume adjustments. 3 Depreciation is based on concentrate sold. 4 As per IFRS consolidated interim financial statements. | |||||||
| Manitoba | Three Months Ended | |||||||
| Jun. 30, 2024 | Mar. 31, 2024 | Jun. 30, 2023 | ||||||
| Sustaining cash cost per pound of gold produced | $000s | $/oz | $000s | $/oz | $000s | $/oz | ||
| Gold cash cost, net of by-product credits | 33,521 | 771 | 41,850 | 736 | 38,679 | 1,097 | ||
| Cash sustaining capital expenditures | 17,063 | 392 | 12,173 | 214 | 14,828 | 421 | ||
| Royalties | — | — | — | — | 99 | 3 | ||
| Sustaining cash cost per pound of gold produced | 50,584 | 1,163 | 54,023 | 950 | 53,606 | 1,521 | ||
Combined Unit Cost Reconciliation
| Peru | Three Months Ended | ||
| (in thousands except ore tonnes milled and unit cost per tonne) | |||
| Combined unit cost per tonne processed | Jun. 30, 2024 | Mar. 31, 2024 | Jun. 30, 2023 |
| Mining | 31,306 | 29,220 | 31,654 |
| Milling | 51,335 | 43,624 | 54,676 |
| G&A 1 | 19,349 | 23,092 | 14,867 |
| Other G&A 2 | (4,113 ) | (7,688) | 458 |
| Unit Cost | 97,877 | 88,248 | 101,655 |
| Tonnes ore milled | 7,719 | 8,078 | 7,223 |
| Combined unit cost per tonne | 12.68 | 10.92 | 14.07 |
| Reconciliation to IFRS: | |||
| Unit cost | 97,877 | 88,248 | 101,655 |
| Freight & other | 12,593 | 16,580 | 12,424 |
| Other G&A | 4,113 | 7,688 | (458) |
| Share-based compensation expenses | 199 | 116 | 29 |
| Change in product inventory | 1,101 | 14,077 | 27,078 |
| Royalties | 929 | 2,118 | 2,479 |
| Depreciation and amortization | 58,860 | 71,030 | 67,340 |
| Cost of sales 3 | 175,672 | 199,857 | 210,547 |
| 1 G&A as per cash cost reconciliation above. 2 Other G&A primarily includes profit sharing costs. 3 As per IFRS consolidated interim financial statements. | |||
| Manitoba | Three Months Ended | ||
| (in thousands except tonnes ore milled and unit cost per tonne) | |||
| Combined unit cost per tonne processed | Jun. 30, 2024 | Mar. 31, 2024 | Jun. 30, 2023 |
| Mining | 42,280 | 44,360 | 41,681 |
| Milling | 15,222 | 16,476 | 15,193 |
| G&A 1 | 10,449 | 11,346 | 6,108 |
| Less: Other G&A related to profit sharing costs | (3,428 ) | (4,131) | (682) |
| Unit cost | 64,523 | 68,051 | 62,300 |
| USD/CAD implicit exchange rate | 1.38 | 1.35 | 1.34 |
| Unit cost - C$ | 89,336 | 91,748 | 83,659 |
| Tonnes ore milled | 397,426 | 389,767 | 380,538 |
| Combined unit cost per tonne - C$ | 225 | 235 | 220 |
| Reconciliation to IFRS: | |||
| Unit cost | 64,523 | 68,051 | 62,300 |
| Freight & other | 5,674 | 6,189 | 5,342 |
| Other G&A related to profit sharing | 3,428 | 4,131 | 682 |
| Share-based compensation expenses | 414 | 234 | 31 |
| Inventory adjustments | — | (24) | 906 |
| Change in product inventory | (2,409 ) | (558) | (11,964) |
| Royalties | — | — | 99 |
| Depreciation and amortization | 24,744 | 26,594 | 21,330 |
| Cost of sales 2 | 96,374 | 104,617 | 78,726 |
| 1 G&A as per cash cost reconciliation above. 2 As per IFRS consolidated interim financial statements. | |||
| British Columbia | Three Months Ended 3 | ||
| Combined unit cost per tonne processed | Jun. 30, 2024 | Mar. 31, 2024 | |
| Mining | 19,463 | 28,553 | |
| Milling | 21,508 | 23,374 | |
| G&A 1 | 5,442 | 3,897 | |
| Unit cost | 46,413 | 55,824 | |
| USD/CAD implicit exchange rate | 1.35 | 1.35 | |
| Unit cost - C$ | 63,522 | 75,282 | |
| Tonnes ore milled | 3,232 | 3,180 | |
| Combined unit cost per tonne - C$ | 19.65 | 23.67 | |
| Reconciliation to IFRS: | |||
| Unit cost | 46,413 | 55,824 | |
| Freight & other | 3,461 | 4,293 | |
| Share-based compensation expenses | — | 5 | |
| Change in product inventory | 11,290 | (3,965) | |
| Royalties | 641 | 755 | |
| Depreciation and amortization | 14,042 | 11,649 | |
| Cost of sales 2 | 75,847 | 68,561 | |
| 1 G&A as per cash cost reconciliation above. 2 As per consolidated financial statements. 3 As Copper Mountain was acquired on June 20 2023, there were no comparative figures for the three months ended June 30, 2023. | |||
Forward-Looking Information
This news release contains forward-looking information within the meaning of applicable Canadian and United States securities legislation. All information contained in this news release, other than statements of current and historical fact, is forward-looking information. Often, but not always, forward-looking information can be identified by the use of words such as "plans", "expects", "budget", "guidance", "scheduled", "estimates", "forecasts", "strategy", "target", "intends", "objective", "goal", "understands", "anticipates" and "believes" (and variations of these or similar words) and statements that certain actions, events or results "may", "could", "would", "should", "might" "occur" or "be achieved" or "will be taken" (and variations of these or similar expressions). All of the forward-looking information in this news release is qualified by this cautionary note.
Forward-looking information includes, but is not limited to, statements with respect to the company's production, cost and capital and exploration expenditure guidance, expectations regarding reductions in discretionary spending and capital expenditures, the ability of the company to stabilize and optimize the Copper Mountain mine operation, the fleet production ramp up plan at the Copper Mountain site and the expected benefits therefrom, the ability of the company to complete business integration activities at the Copper Mountain mine, the implementation of stripping strategies in Peru and British Columbia and the expected benefits therefrom, the estimated timelines and pre-requisites for sanctioning the Copper World project and the pursuit of a potential minority joint venture partner, expectations regarding the permitting requirements for the Copper World project (including expected timing for receipt of such applicable permits), the expected benefits of Manitoba growth initiatives, including the exploration drift at the 1901 deposit, the company's future deleveraging strategies and the company's ability to deleverage and repay debt as needed, the timing of any future payments to be made under the company's gold prepay liability, expectations regarding the company's cash balance and liquidity, the company's ability to increase the mining rate at Lalor, expectations regarding the ability to conduct exploration work and execute on exploration programs on its properties and to advance related drill plans, including the advancement of the exploration program at Maria Reyna and Caballito and the status of the related drill permit application process, the ability to continue mining higher-grade ore in the Pampacancha pit and the company's expectations resulting therefrom, expectations regarding the ability for the company to further reduce greenhouse gas emissions, the company's evaluation and assessment of opportunities to reprocess tailings using various metallurgical technologies, expectations regarding the prospective nature of the Maria Reyna and Caballito properties, the anticipated impact of brownfield and greenfield growth projects on the company's performance, anticipated expansion opportunities and extension of mine life in Snow Lake and the ability for Hudbay to find a new anchor deposit near the company's Snow Lake operations, anticipated future drill programs and exploration activities and any results expected therefrom, anticipated mine plans, anticipated metals prices and the anticipated sensitivity of the company's financial performance to metals prices, events that may affect its operations and development projects, anticipated cash flows from operations and related liquidity requirements, the anticipated effect of external factors on revenue, such as commodity prices, estimation of mineral reserves and resources, mine life projections, reclamation costs, economic outlook, government regulation of mining operations, and business and acquisition strategies. Forward-looking information is not, and cannot be, a guarantee of future results or events. Forward-looking information is based on, among other things, opinions, assumptions, estimates and analyses that, while considered reasonable by the company at the date the forward-looking information is provided, inherently are subject to significant risks, uncertainties, contingencies and other factors that may cause actual results and events to be materially different from those expressed or implied by the forward-looking information.
The material factors or assumptions that Hudbay has identified and were applied in drawing conclusions or making forecasts or projections set out in the forward-looking information include, but are not limited to:
- the ability to achieve production, cost and capital and exploration expenditure guidance;
- the ability to achieve discretionary spending reductions without impacting operations;
- no significant interruptions to operations due to social or political unrest in the regions Hudbay operates, including the navigation of the complex political and social environment in Peru;
- no interruptions to the company's plans for advancing the Copper World project, including with respect to timely receipt of applicable permits and the pursuit of a potential joint venture partner;
- the ability for the company to successfully complete the integration and optimization of the Copper Mountain operations, achieve operating synergies and develop and maintain good relations with key stakeholders;
- the ability to execute on its exploration plans and to advance related drill plans;
- the ability to advance the exploration program at Maria Reyna and Caballito;
- the success of mining, processing, exploration and development activities;
- the scheduled maintenance and availability of the company's processing facilities;
- the accuracy of geological, mining and metallurgical estimates;
- anticipated metals prices and the costs of production;
- the supply and demand for metals the company produces;
- the supply and availability of all forms of energy and fuels at reasonable prices;
- no significant unanticipated operational or technical difficulties;
- no significant interruptions to operations due to adverse effects from extreme weather events, including but not limited to forest fires that may affect the regions in which the company operates;
- the execution of the company's business and growth strategies, including the success of its strategic investments and initiatives;
- the availability of additional financing, if needed;
- the company's ability to deleverage and repay debt as needed;
- the ability to complete project targets on time and on budget and other events that may affect the company's ability to develop its projects;
- the timing and receipt of various regulatory and governmental approvals;
- the availability of personnel for the company's exploration, development and operational projects and ongoing employee relations;
- maintaining good relations with the employees at the company's operations;
- maintaining good relations with the labour unions that represent certain of the company's employees in Manitoba and Peru;
- maintaining good relations with the communities in which the company operates, including the neighbouring Indigenous communities and local governments;
- no significant unanticipated challenges with stakeholders at the company's various projects;
- no significant unanticipated events or changes relating to regulatory, environmental, health and safety matters;
- no contests over title to the company's properties, including as a result of rights or claimed rights of Indigenous peoples or challenges to the validity of the company's unpatented mining claims;
- the timing and possible outcome of pending litigation and no significant unanticipated litigation;
- certain tax matters, including, but not limited to current tax laws and regulations, changes in taxation policies and the refund of certain value added taxes from the Canadian and Peruvian governments; and
- no significant and continuing adverse changes in general economic conditions or conditions in the financial markets (including commodity prices and foreign exchange rates).
The risks, uncertainties, contingencies and other factors that may cause actual results to differ materially from those expressed or implied by the forward-looking information may include, but are not limited to, risks related to the ongoing business integration of Copper Mountain, the failure to effectively complete the integration and optimization of the Copper Mountain operations, political and social risks in the regions Hudbay operates, including the navigation of the complex political and social environment in Peru, risks generally associated with the mining industry and the current geopolitical environment, including future commodity prices, currency and interest rate fluctuations, energy and consumable prices, supply chain constraints and general cost escalation in the current inflationary environment, uncertainties related to the development and operation of the company's projects, the risk of an indicator of impairment or impairment reversal relating to a material mineral property, risks related to the Copper World project, including in relation to permitting, project delivery and financing risks, risks related to the Lalor mine plan, including the ability to convert inferred mineral resource estimates to higher confidence categories, dependence on key personnel and employee and union relations, risks related to political or social instability, unrest or change, risks in respect of Indigenous and community relations, rights and title claims, risks related to extreme weather events, including forest fires that may affect the regions in which the company operates and other severe storms, operational risks and hazards, including the cost of maintaining and upgrading the company's tailings management facilities and any unanticipated environmental, industrial and geological events and developments and the inability to insure against all risks, failure of plant, equipment, processes, transportation and other infrastructure to operate as anticipated, compliance with government and environmental regulations, including permitting requirements and anti-bribery legislation, depletion of the company's reserves, volatile financial markets and interest rates that may affect the company's ability to obtain additional financing on acceptable terms, the failure to obtain required approvals or clearances from government authorities on a timely basis, uncertainties related to the geology, continuity, grade and estimates of mineral reserves and resources, and the potential for variations in grade and recovery rates, uncertain costs of reclamation activities, the company's ability to comply with its pension and other post-retirement obligations, the company's ability to abide by the covenants in its debt instruments and other material contracts, tax refunds, hedging transactions, as well as the risks discussed under the heading "Risk Factors" in the company's most recent Annual Information Form, which is available on the company's SEDAR+ profile at www.sedarplus.ca and the company's EDGAR profile at www.sec.gov.
Should one or more risk, uncertainty, contingency or other factor materialize or should any factor or assumption prove incorrect, actual results could vary materially from those expressed or implied in the forward-looking information. Accordingly, you should not place undue reliance on forward-looking information. Hudbay does not assume any obligation to update or revise any forward-looking information after the date of this news release or to explain any material difference between subsequent actual events and any forward-looking information, except as required by applicable law.
Note to United States Investors
This news release has been prepared in accordance with the requirements of the securities laws in effect in Canada, which may differ materially from the requirements of United States securities laws applicable to U.S. issuers.
About Hudbay
Hudbay (TSX, NYSE: HBM) is a copper-focused mining company with three long-life operations and a world-class pipeline of copper growth projects in tier-one mining-friendly jurisdictions of Canada, Peru and the United States.
Hudbay's operating portfolio includes the Constancia mine in Cusco (Peru), the Snow Lake operations in Manitoba (Canada) and the Copper Mountain mine in British Columbia (Canada). Copper is the primary metal produced by the company, which is complemented by meaningful gold production. Hudbay's growth pipeline includes the Copper World project in Arizona (United States), the Mason project in Nevada (United States), the Llaguen project in La Libertad (Peru) and several expansion and exploration opportunities near its existing operations.
The value Hudbay creates and the impact it has is embodied in its purpose statement: "We care about our people, our communities and our planet. Hudbay provides the metals the world needs. We work sustainably, transform lives and create better futures for communities." Hudbay's mission is to create sustainable value and strong returns by leveraging its core strengths in community relations, focused exploration, mine development and efficient operations.
For further information, please contact:
Candace Brûlé
Vice President, Investor Relations
(416) 814-4387
investor.relations@hudbay.com
Figure 1: Lalor Northwest Follow-up Drilling Confirms Two Mineralized Zones
Recent positive assay results at Lalor Northwest confirm the discovery of two mineralized zones located within 400 metres of the existing Lalor underground infrastructure and have the potential to add near-term production growth at Lalor and extend mine life at Hudbay's Snow Lake operations.
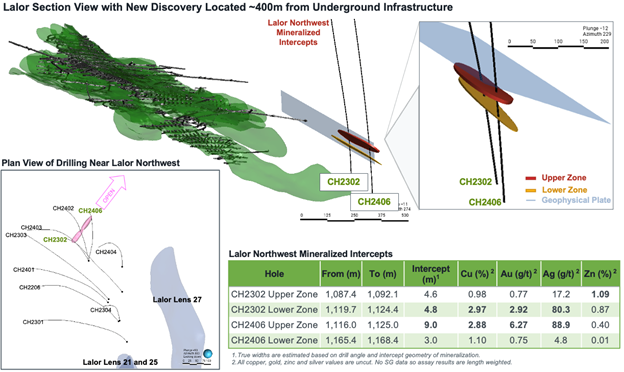
Figure 2: Snow Lake 2024 Regional Geophysics Program Identifies Prospective Targets
The 2024 geophysical program included surface electromagnetic (EM) surveys covering a 25 square kilometre area, including the recently acquired Cook Lake claims that had been previously untested by modern deep geophysics. This new surface EM methodology is unique to Hudbay and detects deep targets at depths of over 1,000 metres below surface. In addition, one very strong deep borehole EM conductor at Cook Lake North will be drill tested in the coming weeks by extending the drill hole to a depth of approximate 2,400 metres.
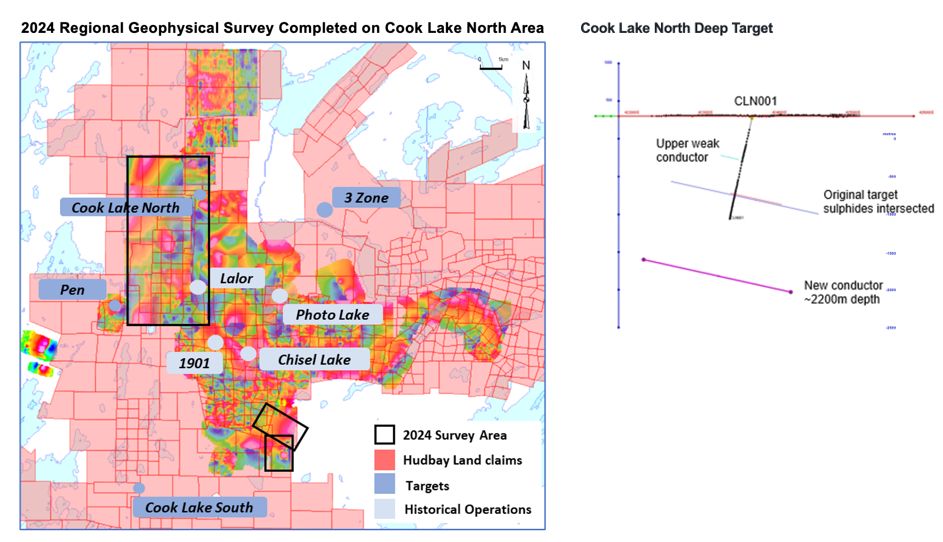
____________________
i Adjusted net earnings (loss) attributable to owners and adjusted net earnings (loss) per share attributable to owners; adjusted EBITDA; cash cost, sustaining cash cost and all-in sustaining cash cost per pound of copper produced, net of by-product credits; cash cost and sustaining cash cost per ounce of gold produced, net of by-product credits; combined unit costs, net debt and any ratios based on these measures are non-IFRS financial performance measures with no standardized definition under IFRS. For further information and a detailed reconciliation, please see the "Non-IFRS Financial Performance Measures" section of this news release.
ii Second quarter 2023 results only include a 10-day stub period of production from British Columbia following the June 20, 2023 transaction closing date.
iii Sourced from S&P Global, August 2023.
Photos accompanying this announcement are available at
https://www.globenewswire.com/NewsRoom/AttachmentNg/38d30685-941a-47cb-9fb4-e90144d02e71
https://www.globenewswire.com/NewsRoom/AttachmentNg/66e3f63b-4997-420e-9862-2f7e5a7d2d22
![]()