
- WORLD EDITIONAustraliaNorth AmericaWorld
Investing News NetworkYour trusted source for investing success
February 12, 2025
Halcones Precious Metals Corp. (TSX – V: HPM) (the “Company” or “Halcones”) is pleased to announce additional results from the recent field program at the Polaris gold project, Chile (“Polaris” or the “Project”). Polaris is a large, highly prospective gold project that has never been drilled. No modern exploration has been carried out to date other than basic rock sampling and mapping. Surface bedrock sampling performed by Halcones’ geologists has extended the strike length of a trend of assay results, comprising more than 400 rock samples, many grading greater than 1g/t gold, to 3.9 km. This trend remains open for another 2km to the north and 1.5 km to the south before reaching property boundaries.
According to Ian Parkinson, CEO of Halcones, “It is exceedingly rare to see such an extensive and highly mineralized gold trend that has never been drilled. In more than ten years as a senior mining analyst for leading financial institutions, there is not a single project I have seen that shows such extensive mineralization in outcrops and no history of systematic exploration. We are very excited by the prospectivity of this project”.
Halcones’ geologists recent field work was focused on mapping and sampling a priority area within the North Zone (Figure 1) resulting in an expanded priority target. This area has consistently returned high grade results from surface sampling. Several highly prospective drill targets have been outlined through this sampling program in the North Zone (see Figure 2). Sampling completed by the Company has increased the gold mineralized footprint by approximately 210% from the area first observed by the optionors of the Project. Company geologists believe that the North and South Zones may merge into a single large gold anomaly, further increasing the potential of the Project. Sampling is limited in the area between the North and South Zone due to the presence of thin overburden cover. The next phase of exploration will focus on better defining the extension of the anomalous gold in this area to confirm the current geological interpretation of the field team. Additional sampling to explore and expand the anomaly to the north and east will also be done as part of the next stage of exploration.
Highlights:
- Select highlights from the last batch of 44 assays include 29.04, 10.67, and 3.54 g/t Au, hosted primarily in stockwork (see Figures 3 & 4). These results are in addition to the 20.05, 13.08, 8.54 and 6.67 g/t Au previously reported (see February 4th,2025 press release for details). The samples consisted of continuous 1m long chip samples to ensure representative sampling. The program prioritized sampling of stockwork as opposed to larger quartz veins. Gold bearing stockwork (see Figures 3 & 4) at surface has been sampled over approximately a 250m X 500m area and the limits of this mineralized zone are unknown. Several high-grade target areas have been identified. However, the entire area may represent a large, bulk minable target if continuity between bedrock samples is established. See Figure 2 for locations of samples.
- The North Zone sample area with the greatest concentration of high-grade surface samples has been expanded to the South. Sampling by Halcones’ geologists returned values consistent with work done by the optionors of the Project and extended the known area of high-grade mineralization to more than double that previously outlined. The approximate surface area of this target containing multiple surface samples above 1 g/t is 12.3 hectares.
- High grade mineralization continues to exhibit a strong structural control. In the reported sampling area (Figure 2), high grade samples continue to occur on the southwest side of a structural break. Approximately 40% of the surface area in the northwest portion of the Project area has a thin layer of colluvial cover and this has seen limited sampling. The Company plans to expand its sampling through this thin cover when approvals are in place.
- Halcones believes there is potential for a larger tonnage surface deposit of vein and stockwork hosted mineralization within the highly fractured granodioritic rocks adjacent to fault splays associated with the continental scale, Atacama Fault System in the area. Extensive gold mineralization has been identified by surface bedrock sampling over 3.9 km of strike length along these structures on the property to date.
Ian Parkinson, CEO and Director of Halcones:
“We are very excited by the results of our first field program at Polaris. These results have confirmed what we had hoped for at Polaris. In a few weeks of field work we have materially expanded the initial areas of interest and several very clear targets for future drilling have emerged. It is rare to see such broad anomalous gold at surface. Much of the Project area remains sparsely sampled and mapped. Our technical team is currently making plans to get back into the field”.
About The Recent Field Program:
The were two main objectives of the field program.
1) Expand the footprint of the known mineralization in the Northwest corner of the North Zone (See Figure 1).
2) Test and better define the extent of mineralized stockwork as a lower grade bulk tonnage opportunity adjacent to the known vein hosted mineralization.
This first field program has successfully expanded the surface area of mineralization (see Figure 2) and confirmed the presence of extensive stockwork hosted gold mineralization at surface.
Sampling previously performed on Polaris identified the northwest section of the North Zone as a priority area (see Figure 1). In recent field work, Halcones’ geologists increased the density of sampling and expanded the surface footprint of sampling in this priority area (see Figure 2). Halcones’ geologists took a total of 140 samples during the recent field campaign. All assays from this program have been received, of which 31 returned values above 1 g/t Au.
This sampling program has successfully expanded the surface expression of the work completed previously on Polaris. Additionally, stockwork mineralization has been confirmed over a broader area. The presence of mineralized stockwork over an extensive area supports Halcones’ geologist interpretation that bulk tonnage deposit potential exists at Polaris. Sampling has been limited in certain areas due to the presence of a thin layer of colluvial cover. Sampling programs are being planned to test bedrock below this this cover.
Halcones’ geologists have been working with a geological model that Polaris holds potential for a large-scale bulk tonnage open pit operation. The presence of mineralization in stockworks in the wall rocks away from the historically mined, mineralized veins is a crucial component of this model that is present at Polaris. This stockwork is believed to have a similar genesis to the vein hosted mineralization previously exploited by artisanal miners but was never targeted. The stockwork mineralization is not visually obvious due to a general lack of associated sulfide minerals. The 17 known small scale mines in the Project area exploited very high-grade veins with no focus on the stockwork adjacent to the veins.
Figure 1: Polaris Project sampling has identified gold mineralization over a 3.9 km extent in an area that has never been drilled.

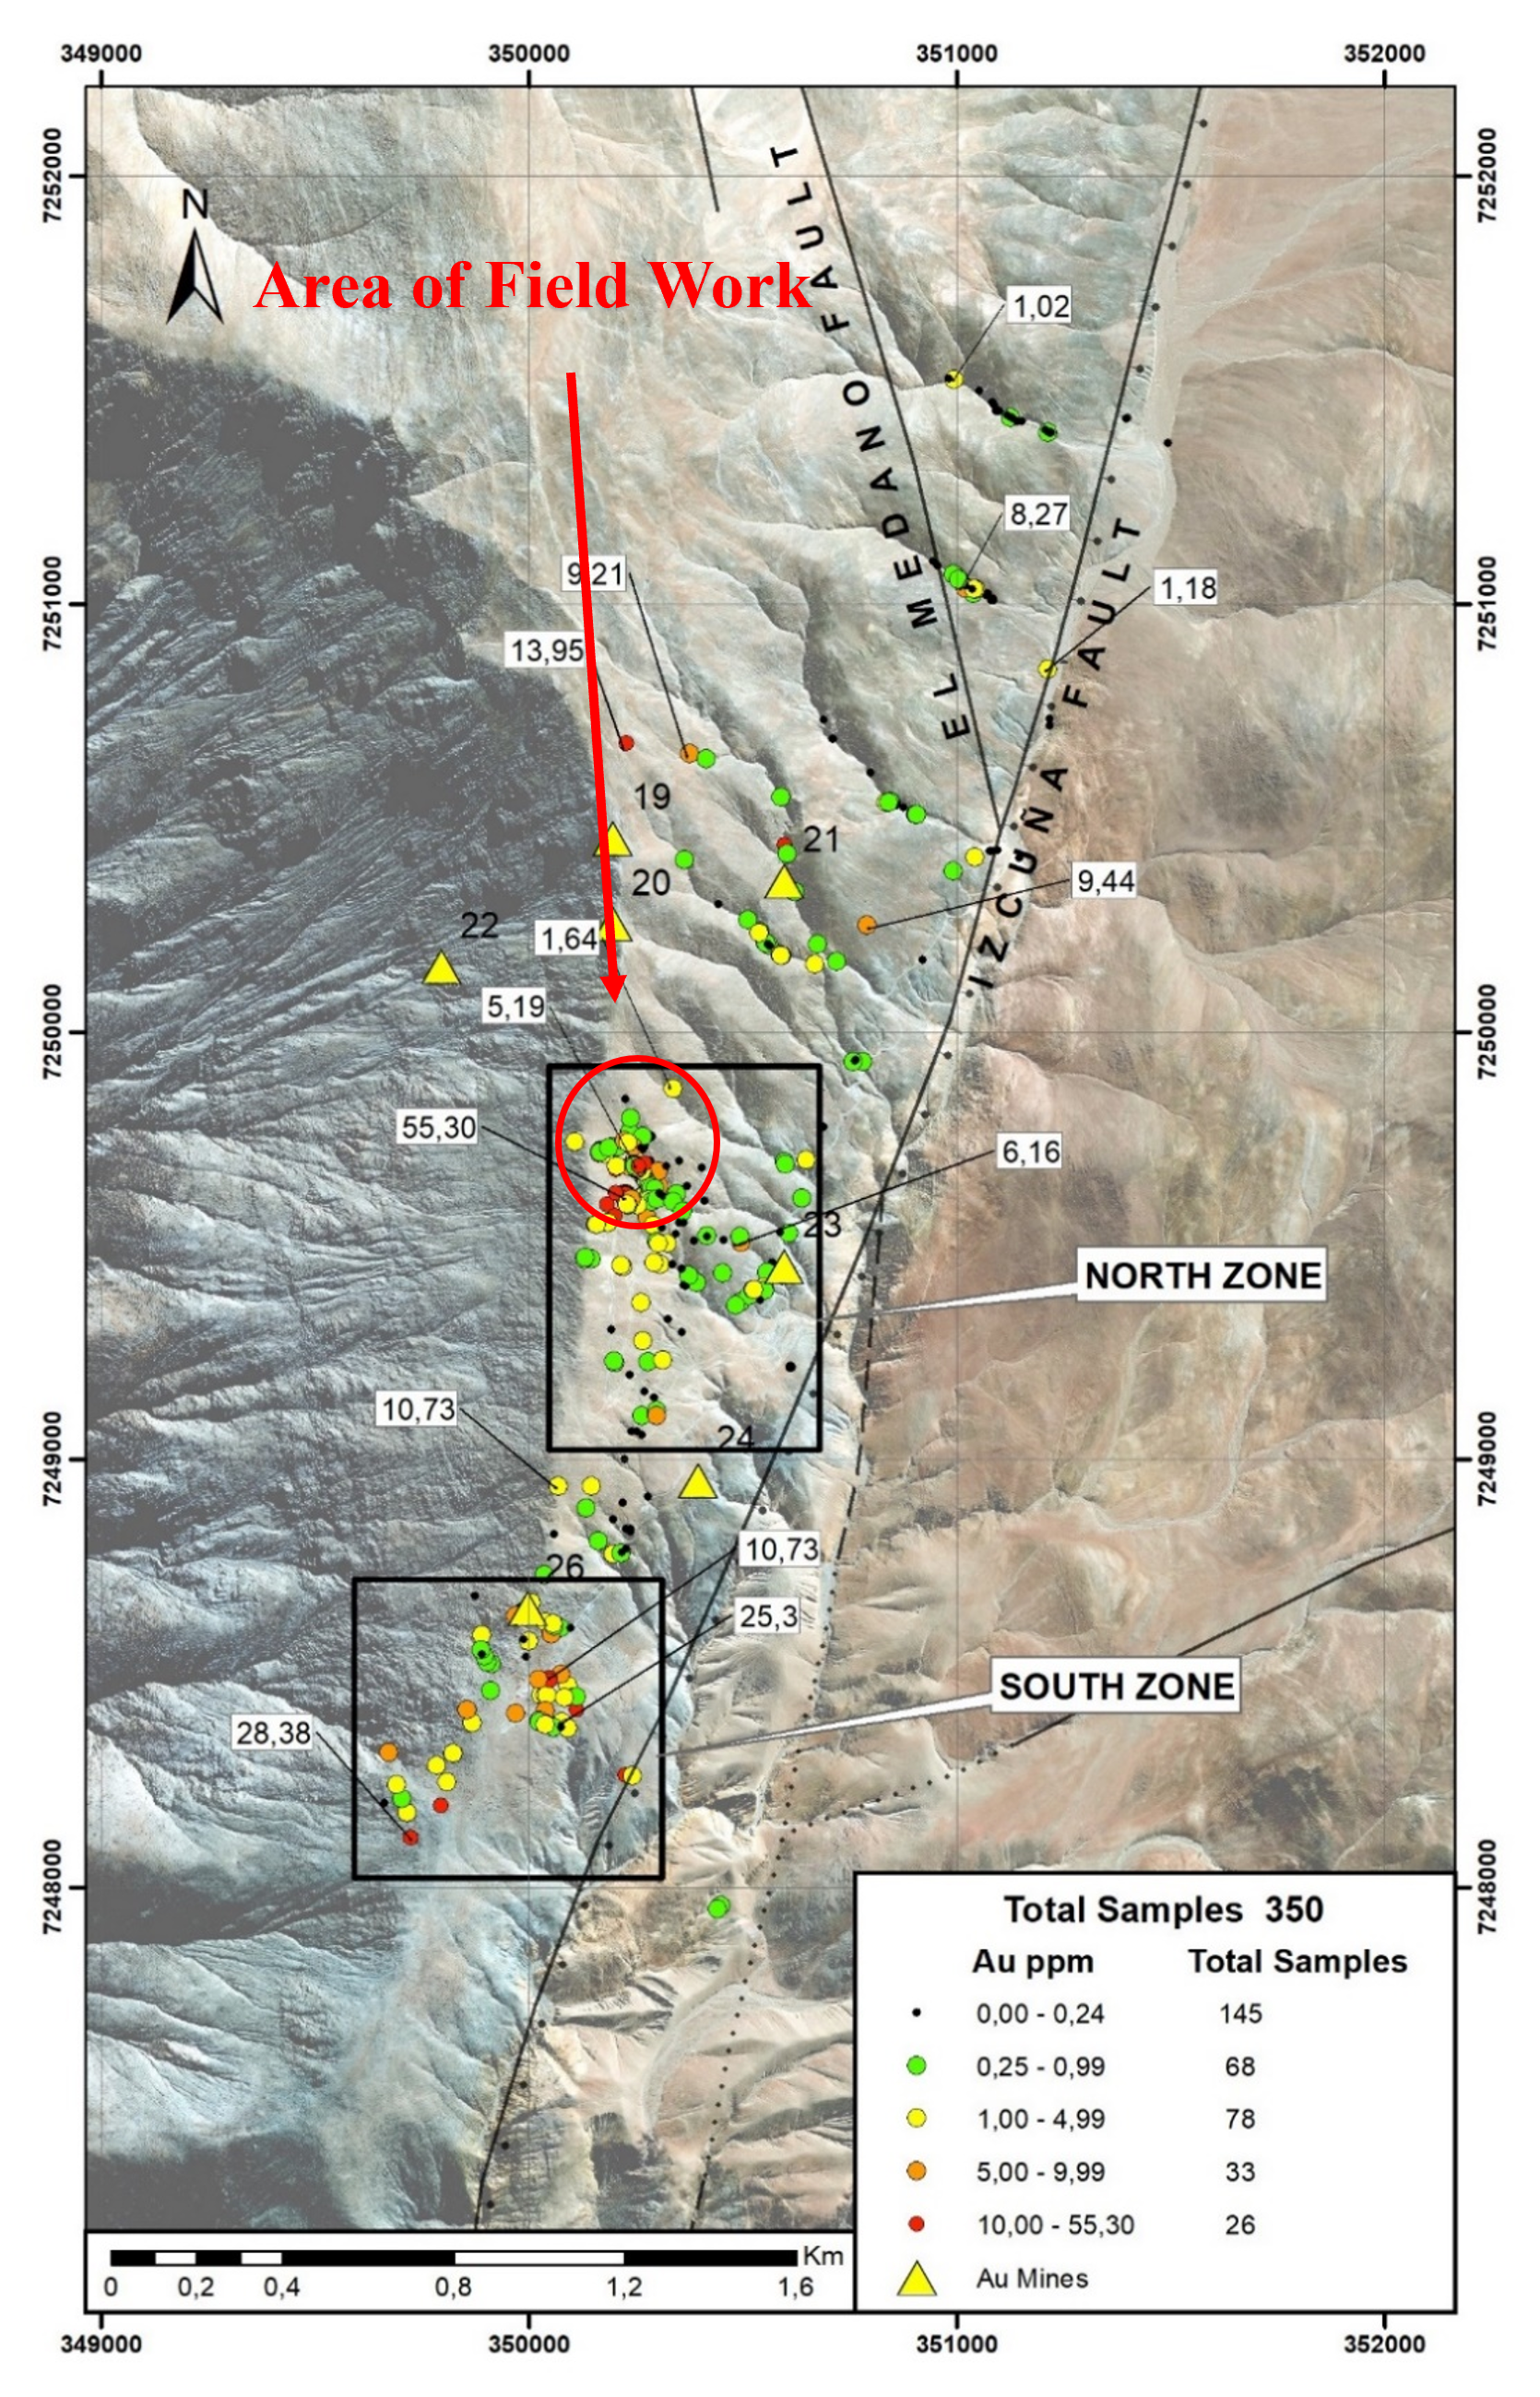
Figure 2: Polaris North Zone field program results with recent assays represented.
The stars are Halcones’ samples, the dots are samples by the optionors.

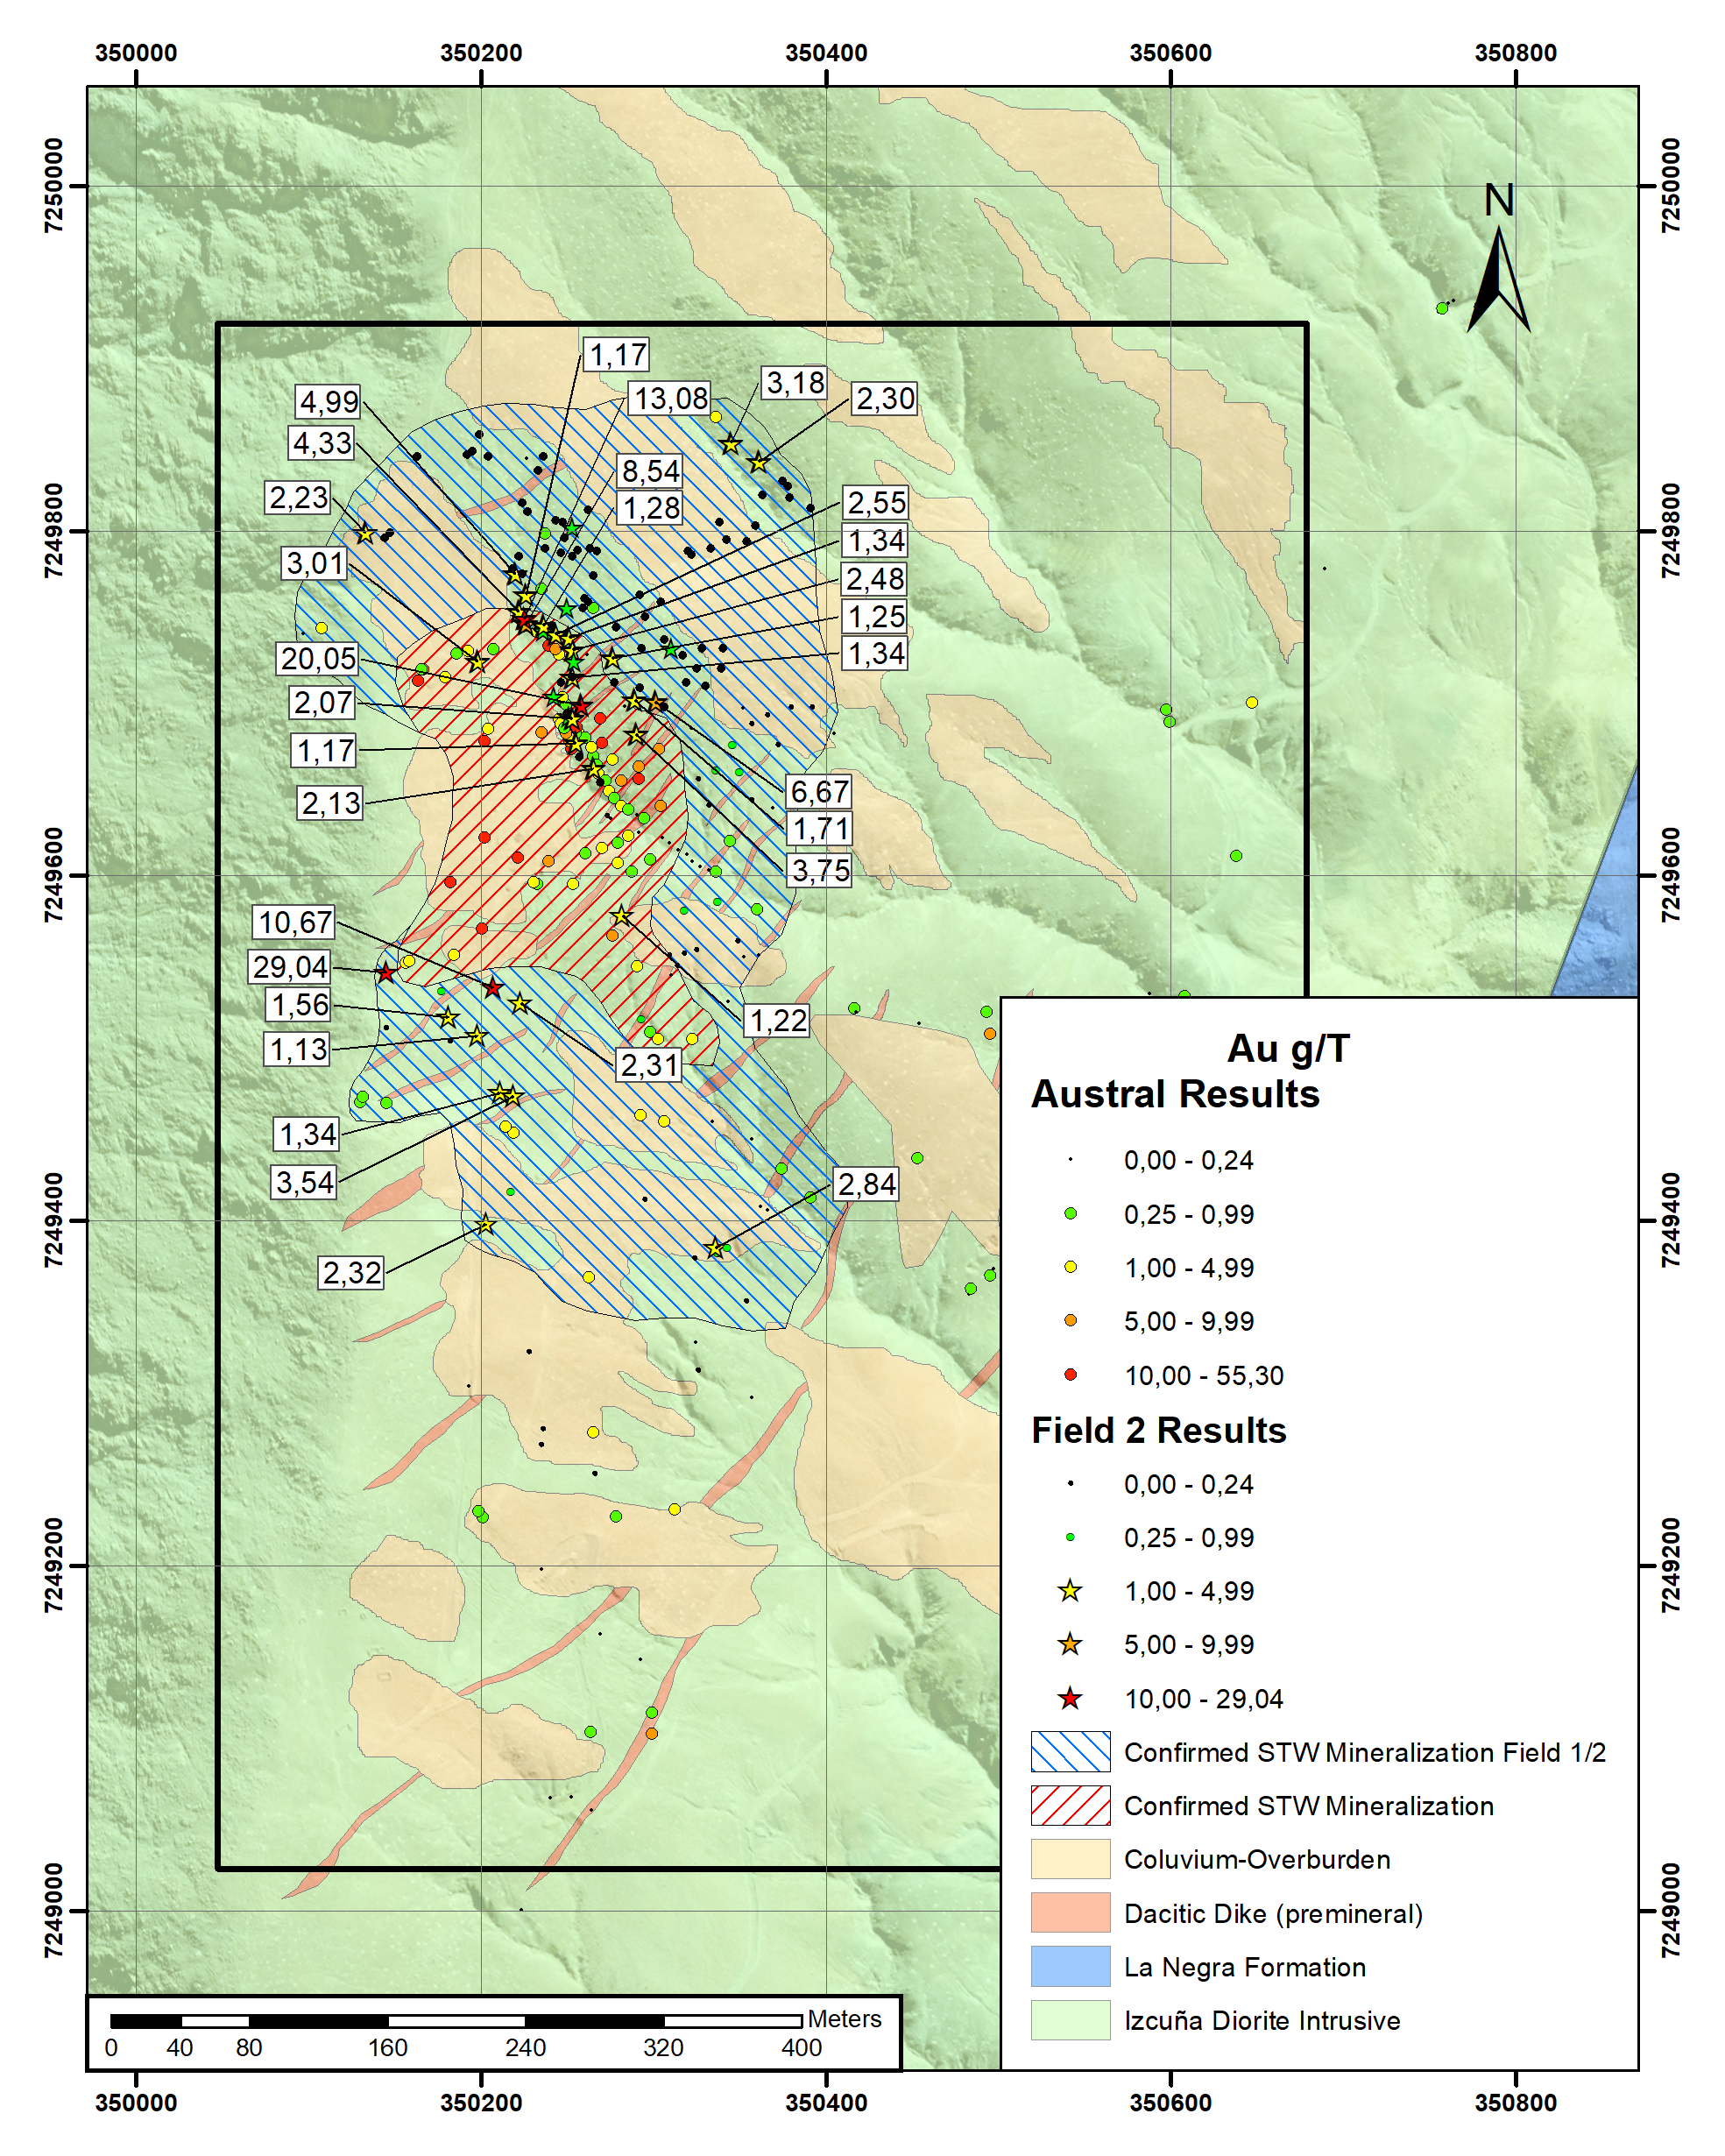
Figure 3: Example of typical mineralized stockwork in outcrop. The rock is highly transected by randomly oriented hairline fractures that commonly contain sub-millimetre to several millimetre quartz veins that are thought to contain the gold. The host is typically tonalite to granodiorite, which has been fractured adjacent to the fault systems in the area. Visually, there are few indications of mineralization.

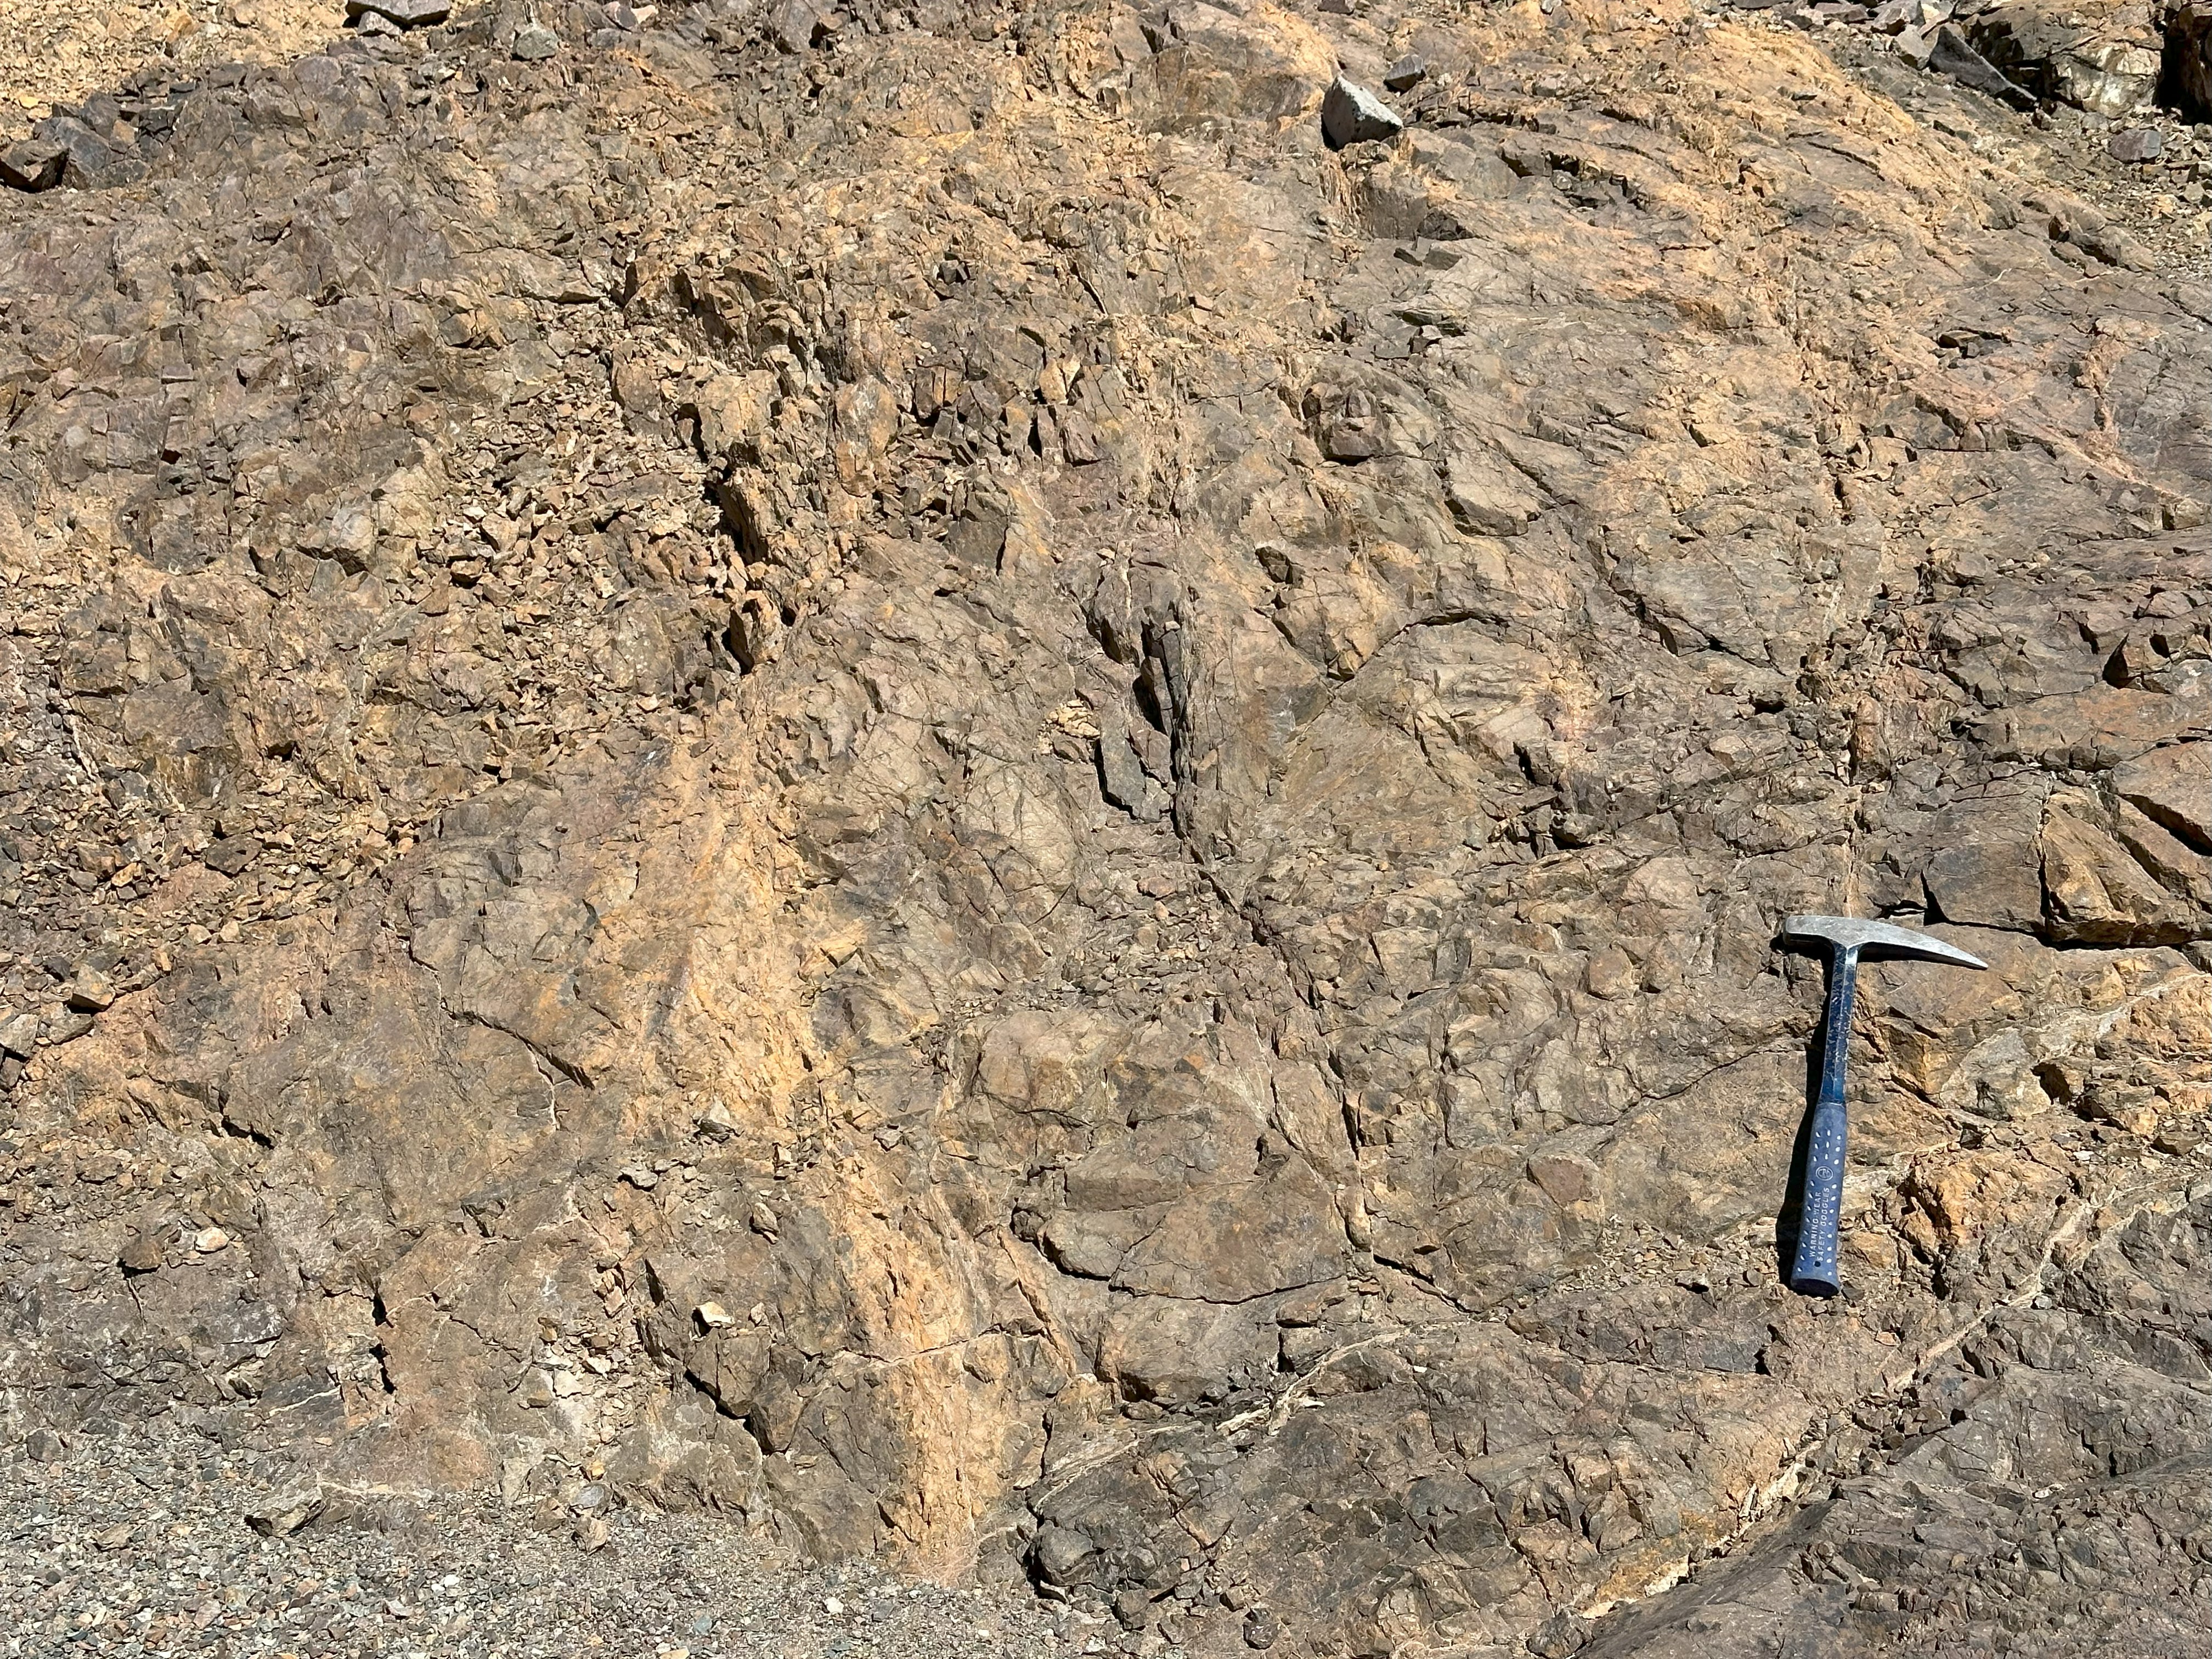
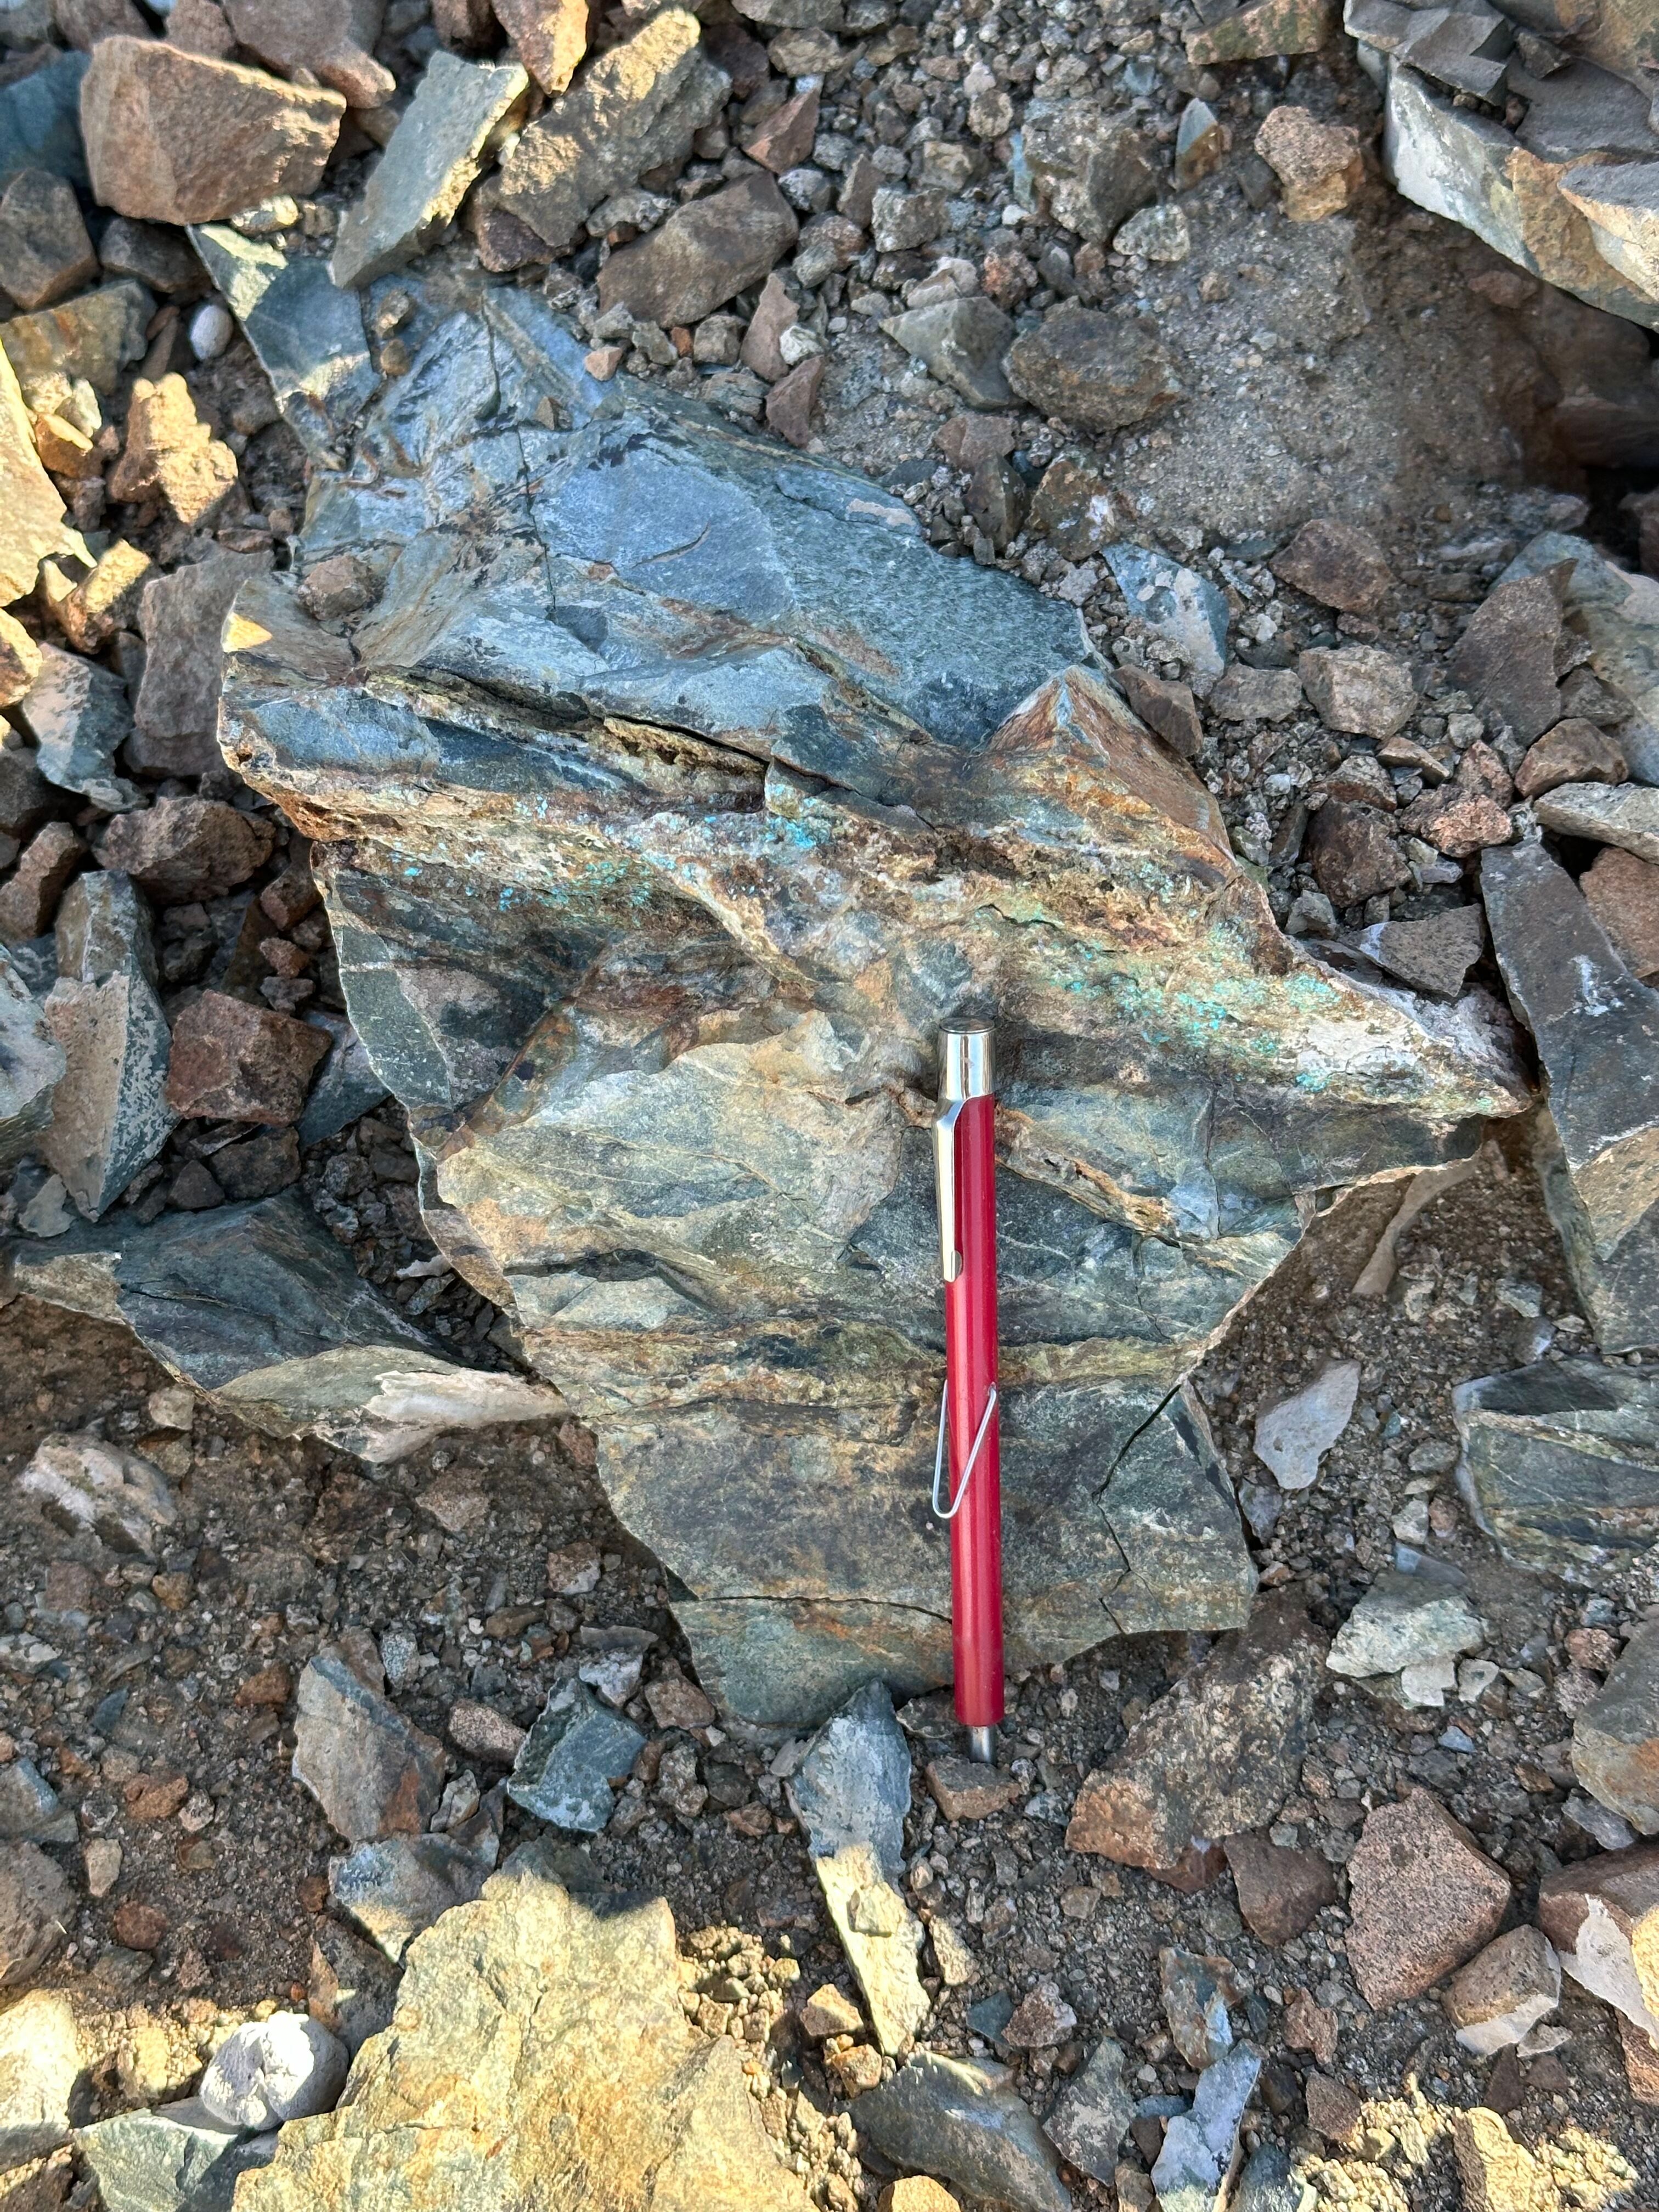
Figure 4: Example of stockwork mineralization exhibiting larger quartz veinlets. The mineralized rock is characterized by multiple veinlets and fractures at various orientations.

About The Sampling Process
Using a hammer and a rock chisel, a chip sample is carried out uniformly over at least 1 meter sections, ensuring complete collection and homogeneity in order to achieve proper representation of the sample. The sample is collected perpendicular to the dominant strike of the structures and the sample mass must be a minimum of 2 kg. In the event that the outcrop presents some mineralized structure, an independent sample will be taken only from the mineralized structure and an independent sample from the host rock on both sides of the structure. This process is designed to limit bias due to high grading sample collection.
All samples were bagged and sealed on site and delivered directly by the Project Geologist to ANDES ANALITYCAL ASSAY Laboratory in Copiapó, Chile. After sample preparation at ANDES ANALITYCAL ASSAY Laboratory in Copiapó, split pulp samples were shipped to ANDES ANALITYCAL ASSAY in Santiago, Chile for assaying gold by fire assay (AEF_AAS_1E42-FF), and for analyzing 34 other elements, including silver, by four acids (ICP_AES_AR34m1).
ANDES ANALITYCAL ASSAY is an independent laboratory certified with a global quality management system that meets all requirements of International Standards ISO/IEC 17025:2017, includes its own internal quality control samples comprising certified reference materials, blanks, and pulp duplicates.
Qualified Person
The scientific and technical information in this news release has been reviewed and approved by Mr. David Gower, P.Geo., as defined by National Instrument 43-101 of the Canadian Securities Administrators.
About Halcones Precious Metals Corp.
Halcones is focused on exploring for and developing gold-silver projects in Chile. The Company has a team with a strong background of exploration success in the region.
For further information, please contact:
Vincent Chen, CPA
Investor Relations
vincent.chen@halconespm.com
www.halconespreciousmetals.com
Cautionary Note Regarding Forward-looking Information
This press release contains “forward-looking information” within the meaning of applicable Canadian securities legislation. Forward-looking information includes, without limitation, regarding the prospectivity of the Project, the mineralization of the Project, the Company’s exploration program, the Company’s ability to explore and develop the Project and the Company’s future plans. Generally, forward-looking information can be identified by the use of forward-looking terminology such as “plans”, “expects” or “does not expect”, “is expected”, “budget”, “scheduled”, “estimates”, “forecasts”, “intends”, “anticipates” or “does not anticipate”, or “believes”, or variations of such words and phrases or state that certain actions, events or results “may”, “could”, “would”, “might” or “will be taken”, “occur” or “be achieved”. Forward- looking information is subject to known and unknown risks, uncertainties and other factors that may cause the actual results, level of activity, performance or achievements of Halcones, as the case may be, to be materially different from those expressed or implied by such forward-looking information, including but not limited to: general business, economic, competitive, geopolitical and social uncertainties; the actual results of current exploration activities; risks associated with operation in foreign jurisdictions; ability to successfully integrate the purchased properties; foreign operations risks; and other risks inherent in the mining industry. Although Halcones has attempted to identify important factors that could cause actual results to differ materially from those contained in forward-looking information, there may be other factors that cause results not to be as anticipated, estimated or intended. There can be no assurance that such information will prove to be accurate, as actual results and future events could differ materially from those anticipated in such statements. Accordingly, readers should not place undue reliance on forward-looking information. Halcones does not undertake to update any forward-looking information, except in accordance with applicable securities laws.
NEITHER TSX VENTURE EXCHANGE NOR ITS REGULATION SERVICES PROVIDER (AS THAT TERM IS DEFINED IN THE POLICIES OF THE TSX VENTURE EXCHANGE) ACCEPTS RESPONSIBILITY FOR THE ADEQUACY OR ACCURACY OF THIS RELEASE.
HPM:CA
The Conversation (0)
5h
Takeover Update – Offer Declared Best and Final
There will be no increase in the Offer consideration
Astral Resources NL (ASX: AAR) (Astral or the Company) refers to its off market takeover bid to acquire all of the ordinary shares of Maximus Resources Limited (ASX:MXR) (Maximus) (Offer) it does not already own on the basis of one (1) Astral share for every two (2) Maximus shares held pursuant to the Bidder's Statement dated 3 February 2025 (Bidder's Statement). The Offer is unconditional and will close at 7pm (AEDT) on Friday, 21 March 2025 (unless further extended).
HIGHLIGHTS
- The Offer consideration has been declared best and final, and will not be increased
- The Offer will close at 7pm (AEDT) on Friday, 21 March 2025 (unless further extended)
- The Offer is unconditional and Astral has accelerated payment terms
- Astral has majority control of Maximus with voting power of 81.67% as at 14 March 2025
- With Astral’s ownership of Maximus now exceeding 80%, Maximus shareholders may now be eligible for rollover tax relief
As at 14 March 2025, Astral had voting power in Maximus of 81.67%. That being the case, Maximus shareholders may be eligible for rollover tax relief. For further information, please refer to section 10 of the Bidder’s Statement.
Offer declared best and final as to consideration
Astral declares its Offer of 1 Astral share for every 2 Maximus shares best and final as to consideration. There will be no increase in the number of Astral shares offered under the Offer.
Accelerated payment terms
On 24 February 2025, Astral announced that payment terms for validly accepting Maximus shareholders had been accelerated such that Maximus shareholders who have yet to validly accept the Offer will be issued their Astral Shares within 10 Business Days of their acceptance being processed in accordance with the terms of the Offer.
Minority Maximus shareholders – Liquidity and valuation risk
Maximus shareholders who do not accept the Offer prior to its close will not receive the consideration under the Offer, unless Astral is entitled to proceed to compulsory acquisition (in which case they will receive the consideration, but at a later date than if they accepted the Offer).
Maximus shareholders should be aware that, if Astral is NOT entitled to proceed to compulsory acquisition (e.g. if Astral does not acquire more than 90% voting power in Maximus), and Maximus continues to be listed on the ASX following the Offer, then the decrease in the number of Maximus shares available for trading may have a material adverse impact on their liquidity and valuation. Furthermore, depending on the level of acceptances received and other considerations, Maximus may apply to de-list from the ASX, in which case it may become more difficult and expensive for Maximus shareholders to sell their shares.
Click here for the full ASX Release
This article includes content from Astral Resources, licensed for the purpose of publishing on Investing News Australia. This article does not constitute financial product advice. It is your responsibility to perform proper due diligence before acting upon any information provided here. Please refer to our full disclaimer here.
Keep reading...Show less
7h
NAE Commences Maiden RC Drilling at the Wagyu Gold Project, Pilbara WA
New Age Exploration (ASX: NAE) (NAE or the Company) is pleased to announce that Strike Drilling has mobilised to site with a Schramm T450 rig, and Reverse Circulation (RC) drilling has begun as of Sunday, 16 March 2025.
HIGHLIGHTS
- Maiden Reverse Circulation (RC) drill program of 3,000m has commenced at the Wagyu Gold Project, Pilbara WA
- Drilling Contractor, Strike Drilling, to take 50% of payment in equity, demonstrating confidence in the project’s potential
- Program aims to extend gold mineralisation strike and depth, following high-grade intercepts up to 15.6g/t gold in recent Phase 2 Air Core drilling
- The Wagyu Project is located in the Central Pilbara’s fast-emerging gold region, adjoining De Grey Mining (ASX:DEG) tenure containing its ~11.2Moz1 Hemi Gold deposit
The Wagyu Gold Project, located within a fast-emerging gold mineralised corridor, represents a highly prospective Gold opportunity ~9km within the same mineralised trend as De Grey Mining’s (ASX:DEG) Hemi Gold Deposit containing ~11.2 Moz1 (refer to Figure 1) in the Central Pilbara.
NAE Executive Director Joshua Wellisch commented:
"The commencement of RC drilling marks an important milestone in advancing the Wagyu Gold Project. The support of Strike Drilling, who has agreed to take 50% of their payment in equity, is a strong endorsement of the project’s potential. We are eager to test these high-priority targets and further define the extent of gold mineralisation.”
This 3,000m RC drill program is the next step in NAE’s systematic exploration strategy at Wagyu, following promising results from recent geophysical surveys (refer ASX Announcement 11 March 2025) and Phase 2 Air Core (AC) drilling, which confirmed multiple high-grade gold intercepts including 15.6g/t gold over 1m (refer ASX Announcement 17 February 2025). The program will test five high-priority gravity targets on the eastern side of the project area, with particular emphasis on Gravity Targets 1 & 10 (Figure 2), following up on the significant gold mineralisation (>1g/t) identified in the AC drilling (Figure 3).
Figure 1: Location Map showing NAE’s Wagyu Gold Project (E47/2974) in the Gold Mineralisation Corridor shared with De Grey’s significant gold Mineral Resources, including Hemi, Mt Berghaus and Calvert.
The Hemi Gold Mineral Resource was last updated by De Grey Mining on 14 November 20241. The estimate is for 264Mt @ 1.3g/t Au for 11.2Moz, which can be broken down into 13Mt @ 1.4g/t for 0.6Moz, 149Mt @ 1.3g/t Au Indicated for 6.3 Moz, and 103Mt @ 1.3g/t Au for 4.3 Moz Inferred.
NAE confirms that it is not aware of any new information or data that materially affects the information included in De Grey’s reported Mineral Resources referenced in this market announcement. To NAE’s full knowledge, all material assumptions and technical parameters underpinning the estimates in the relevant market announcements continue to apply and have not materially changed.
The previous AC drilling drilled to the top of fresh rock only, and this RC program will test for primary mineralisation in fresh rock below and adjacent to the oxide mineralisation identified in late 2024. RC drilling is also intended to outline better the boundaries, nature, and extent of mineralised intrusions identified from geophysics and AC drilling.
The RC drilling campaign is scheduled for completion within four weeks, with assay results expected between late April and May 2025.
Click here for the full ASX Release
This article includes content from New Age Exploration Limited, licensed for the purpose of publishing on Investing News Australia. This article does not constitute financial product advice. It is your responsibility to perform proper due diligence before acting upon any information provided here. Please refer to our full disclaimer here.
Keep reading...Show less
14 March
Lobo Tiggre: Gold's Bullish New Paradigm, Copper Timing to Watch
Lobo Tiggre, CEO of IndependentSpeculator.com, shares his latest thoughts on gold, noting that bullish factors are stacking up in its favor. Among them are recent moves from the Trump administration and a potential rise in global gold allocations.
Tiggre also discusses copper, silver and uranium.
Click here to view the Investing News Network's Prospectors & Developers Association of Canada convention playlist on YouTube.
Don't forget to follow us @INN_Resource for real-time updates!
Securities Disclosure: I, Charlotte McLeod, hold no direct investment interest in any company mentioned in this article.
Affiliate Disclosure: The Investing News Network may earn commission from qualifying purchases or actions made through the links or advertisements on this page.
Keep reading...Show less
14 March
Jeffrey Christian: Gold, Silver, PGMs in 2025; Plus Precious Metals Facts vs. Fiction
Jeffrey Christian, managing partner at CPM Group, outlines his latest thoughts on gold.
He also shares his outlook for silver, platinum and palladium.
Watch the interview for more, or click here for the Investing News Network's Prospectors & Developers Association of Canada convention playlist on YouTube.
Don't forget to follow us @INN_Resource for real-time updates!
Securities Disclosure: I, Charlotte McLeod, hold no direct investment interest in any company mentioned in this article.
Keep reading...Show less
14 March
Gold Price Hits New Record, Breaking US$3,000 for First Time
The gold price reached yet another record high on Friday (March 14), breaking US$3,000 per ounce.
The precious metal has gained significant momentum since the beginning of the year. In early morning trading on Friday, it briefly surged to US$3,004 per ounce before falling back to US$2,989.
Friday's rise comes amid heightening trade tensions between the US and Europe. On Thursday (March 13), US President Donald Trump threatened to impose significant tariffs on key European products, including wine.
Gold price chart, March 7 to 14, 2025.
Chart via the Investing News Network.
The threats came during a week of flared tempers. On Tuesday (March 11), Ontario Premier Doug Ford imposed a 25 percent surcharge on electricity exports to the US. Although the charges were withdrawn after the two sides agreed to meet in Washington on Thursday, there is still much uncertainty about Canada-US relations.
Broad 25 percent tariffs on all steel and aluminum imports to the US went into effect on Wednesday (March 12). Canada quickly applied retaliatory tariffs on US$20 billion worth of goods, while the EU responded with tariffs on US$28 billion worth of goods. Trump previously threatened to boost the tariffs on Canadian steel and aluminum to 50 percent, but backed down for the time being after Ford withdrew the 25 percent electricity surcharge.
Trump has also said he will impose further tariffs on auto imports by April 2, creating significant uncertainty for manufacturers and businesses that rely on cross-border trade.
Additional tailwinds for gold's momentum this week include the release of US consumer and producer price index data on Wednesday and Thursday, which shows that inflation has become sticky.
This news is adding more fuel to recession speculation and helping to buoy gold.
Don't forget to follow us @INN_Resource for real-time updates!
Securities Disclosure: I, Dean Belder, hold no direct investment interest in any company mentioned in this article.
Keep reading...Show less
14 March
What Was the Highest Price for Gold?
Gold has long been considered a store of wealth, and the price of gold all time high often makes its biggest gains during turbulent times as investors look for cover in this safe-haven asset.
The 21st century has so far been heavily marked by episodes of economic and sociopolitical upheaval. Uncertainty has pushed the precious metal to record highs as market participants seek its perceived security. And each time the gold price rises, there are calls for even higher record-breaking levels.
Gold market gurus from Lynette Zang to Chris Blasi to Jordan Roy-Byrne have shared eye-popping predictions on the gold price that would intrigue any investor — gold bug or not.
Some have posited that the gold price may break US$3,000 per ounce and carry on as high as US$4,000 or US$5,000. Now that it has broken US$3,000 for the first time, how high could it go? There are even those with hopes that US$10,000 gold or even US$40,000 gold could become a reality.
These impressive price predictions have investors wondering, what is gold's all time high? In the past year, a new gold all time high (ATH) has been reached dozens of times, and we share the latest one and what has driven it to this level below. We also take a look at how the gold price has moved historically and what has driven its performance in recent years.
In this article
How is gold traded?
Before discovering what the highest gold price ever was, it’s worth looking at how the precious metal is traded. Knowing the mechanics behind gold's historical moves can help illuminate why and how its price changes.
Gold bullion is traded in dollars and cents per ounce, with activity taking place worldwide at all hours, resulting in a live price for the metal. Investors trade gold in major commodities markets such as New York, London, Tokyo and Hong Kong. London is seen as the center of physical precious metals trading, including for silver. The COMEX division of the New York Mercantile Exchange is home to most paper trading.
There are many popular ways to invest in gold. The first is through purchasing gold bullion products such as bullion bars, bullion coins and rounds. Physical gold is sold on the spot market, meaning that buyers pay a specific price per ounce for the metal and then have it delivered. In some parts of the world, such as India, buying gold in the form of jewelry is the largest and most traditional route to investing in gold.
Another path to gold investment is paper trading, which is done through the gold futures market. Participants enter into gold futures contracts for the delivery of gold in the future at an agreed-upon price. In such contracts, two positions can be taken: a long position under which delivery of the metal is accepted or a short position to provide delivery of the metal. Paper trading as a means to invest in gold can provide investors with the flexibility to liquidate assets that aren’t available to those who possess physical gold bullion.
One significant long-term advantage of trading in the paper market is that investors can benefit from gold’s safe-haven status without needing to store it. Furthermore, gold futures trading can offer more financial leverage in that it requires less capital than trading in the physical market.
Interestingly, investors can also purchase physical gold via the futures market, but the process is complicated and lengthy and comes with a large investment and additional costs.
Aside from those options, market participants can invest in gold through exchange-traded funds (ETFs). Investing in a gold ETF is similar to trading a gold stock on an exchange, and there are numerous gold ETF options to choose from. For instance, some ETFs focus solely on physical gold bullion, while others focus on gold futures contracts. Other gold ETFs center on gold-mining stocks or follow the gold spot price.
It is important to understand that you will not own any physical gold when investing in an ETF — in general, even a gold ETF that tracks physical gold cannot be redeemed for tangible metal.
With regards to the performance of gold versus trading stocks, gold has an interesting relationship with the stock market. The two often move in sync during “risk-on periods” when investors are bullish. On the flip side, they tend to become inversely correlated in times of volatility. There are a variety of options for investing in stocks, including gold mining stocks on the TSX and ASX, gold juniors, precious metals royalty companies and gold stocks that pay dividends.
According to the World Gold Council, gold's ability to decouple from the stock market during periods of stress makes it “unique amongst most hedges in the marketplace.” It is often during these times that gold outperforms the stock market. For that reason, it is often used as a portfolio diversifier to hedge against uncertainty.
What was the highest gold price ever?
The gold price peaked at US$3,004.58, its all-time high, on March 14, 2025 at 3:10 a.m. PDT. What drove it to set this new ATH?
Gold set a new record high in the morning of March 14, breaking US$3,000 for the first time and surpassing its new record set less than 12 hours earlier. These highs come as US President Donald Trump expanded his tariff war to the European Union, and continued to reiterate his sentiment that the United States may need to go through a period of economic pain to enter a new "golden age" of economic prosperity.
Additionally, tensions rose between House Democrats and Senate Democrats after Senate Minority Leader Chuck Schumer said he plans to vote in favor of passing the Republican's spending bill to avoid a shutdown after House Democrats had voted almost unanimously against it.
Gold set multiple new highs in the prior month as uncertainty continues to reign under Trump, from his announcement that he would enact extensive tariffs on North American allies Canada and Mexico, to the proposed resettlement of Palestinians out of the Gaza Strip to develop it into "the Riviera of the Middle East," (a suggestion that has been condemned globally), followed by his announcement of blanket 25 percent tariffs on steel and aluminum imports.
Gold also set a previous record high on February 20 as US President Donald Trump continued tariff talks and sided with Russian President Vladimir Putin against Ukrainian President Volodymyr Zelenskyy. Elon Musk's call to audit the gold holdings in Fort Knox has also brought attention to the yellow metal.
Read our in-depth breakdown of gold's recent price performance below.
2025 gold price chart
2025 gold price chart. December 31, 2024, to March 13, 2025.
Chart via the Investing News Network.
What factors have driven the gold price in the last five years?
Despite these recent runs, gold has seen its share of both peaks and troughs over the last decade. After remaining rangebound between US$1,100 and US$1,300 from 2014 to early 2019, gold pushed above US$1,500 in the second half of 2019 on a softer US dollar, rising geopolitical issues and a slowdown in economic growth.
Gold’s first breach of the significant US$2,000 price level in mid-2020 was due in large part to economic uncertainty caused by the COVID-19 pandemic. To break through that barrier and reach what was then a record high, the yellow metal added more than US$500, or 32 percent, to its value in the first eight months of 2020.
The gold price surpassed that level again in early 2022 as Russia's invasion of Ukraine collided with rising inflation around the world, increasing the allure of safe-haven assets and pulling the yellow metal up to a price of US$2,074.60 on March 8, 2022. However, it fell throughout the rest of 2022, dropping below US$1,650 in October.
Five year gold price chart. March 12, 2020, to March 13, 2025.
Chart via the Investing News Network.
Although it didn't quite reach the level of volatility as the previous year, the gold price experienced drastic price changes in 2023 on the back of banking instability, high interest rates and the breakout of war in the Middle East.
After central bank buying pushed the gold price up to the US$1,950.17 mark by the end of January, the US Federal Reserve’s 0.25 percent rate hike on February 1 sparked a retreat as the dollar and Treasury yields saw gains. The precious metal went on to fall to its lowest price level of the year at US$1,809.87 on February 23.
The banking crisis that hit the US in early March caused a domino effect through the global financial system and led to the mid-March collapse of Credit Suisse, Switzerland’s second-largest bank. The gold price jumped to US$1,989.13 by March 15. The continued fallout in the global banking system throughout the second quarter of the year allowed gold to break above US$2,000 on April 3, and go on to flirt with a near-record high of US$2,049.92 on May 3.
Those gains were tempered by the Fed’s ongoing rate hikes and improvements in the banking sector, resulting in a downward trend in the gold price throughout the remainder of the second quarter and throughout the third quarter. By October 4, gold had fallen to a low of US$1,820.01 and analysts expected the precious metal to be on the path to drop below the US$1,800 level.
That was before the October 7 attacks by Hamas on Israel ignited legitimate fears of a much larger conflict erupting in the Middle East. Reacting to those fears, and rising expectations that the US Federal Reserve would begin to reverse course on interest rates, gold broke through the important psychological level of US$2,000 per ounce and closed at US$2,007.08 on October 27. As the Israel-Hamas fighting intensified, gold reached a then new high of US$2,152.30 during intraday trading on December 3.
That robust momentum in the spot gold price has continued into 2024, chasing new highs on fears of a looming US recession, the promise of Fed rate cuts on the horizon, the worsening conflict in the Middle East and the tumultuous US presidential election year. By mid-March, gold was pushing up against the US$2,200 level.
That record-setting momentum continued into the second quarter of 2024 when gold broke through US$2,400 per ounce in mid-April on strong central bank buying, sovereign debt concerns in China and investors expecting the Fed to start cutting interest rates. The precious metal went on to hit US$2,450.05 per ounce on May 20.
Throughout the summer, the hits have just kept on coming. The global macro environment is highly bullish for gold in the lead up to the US election. Following the failed assassination attempt on former US President Donald Trump and a statement about coming interest rate cuts by Fed Chair Jerome Powell, the gold spot price hit a new all-time high on July 16 at US$2,469.30 per ounce.
One week later, news that President Joe Biden would not seek re-election and would instead pass the baton to his VP Kamala Harris eased some of the tension in the stock markets and strengthened the US dollar. This also pushed the price of gold down to US$2,387.99 per ounce on July 22.
However, the bullish factors supporting gold over the past year remain in play and the spot price for gold has gone on to breach the US$2,500 level first on August 2 on a less than stellar US jobs report before closing just above the US$2,440 level. A few weeks later, gold pushed past US$2,500 once again on August 16, to close above that level for the first time ever after the US Department of Commerce released data showing a fifth consecutive monthly decrease in a row for homebuilding.
The news that the Chinese government issued new gold import quotas to banks in the country following a two month pause also helped fuel the gold price rally. Central bank gold buying has been a significant tailwind for the gold price this year, and China's central bank has been one of the strongest buyers.
Market watchers expected the Fed to cut interest rates by a quarter point at their September meeting, but news on September 12 that the regulators were still deciding between the expected cut or a larger half-point cut led gold prices on a rally that carried through into the next day, bringing gold prices near US$2,600.
At the September 18 Fed meeting, the committee ultimately made the decision to cut rates by half a point, news that sent gold even higher. By Friday, September 20, it moved above US$2,600 and held above US$2,620.
In October, gold breached the US$2,700 level and continued to set new highs on a variety of factors, including further rate cuts and economic data anticipation, the escalating conflict in the Middle East between Israel and Hezbollah, and economic stimulus in China — not to mention the very close race between the US presidential candidates.
While the gold price fell following President Trump's win in early November and largely held under US$2,700 through the end of the year, it began trending upwards in 2025 to the new all-time high discussed earlier in the article.
Gold has seen upward momentum in the last year on a variety of factors. In 2025, the gold price was on the rise early in the new year as President Trump and his team began to talk seriously about a wide-ranging set of tariffs on several countries in the run-up and following his inauguration on January 20.
On January 29, the Bank of Canada shaved 25 basis points off its policy interest rate, marking its sixth consecutive decrease, and announced plans to end quantitative tightening. On the same day, the US Federal Reserve opted to leave its interest rate unchanged. The following day, President Trump announced it very likely will be placing 25 percent tariffs on Mexico and Canada as of February 1, alongside tariffs on the EU and China.
Gold price set new highs in all currencies alongside a weakening US dollar, the US Federal Reserve leaving interest rates unchanged, a rush to safe haven assets and the looming threat of US President Donald Trump's tariffs on February 1. Additionally, new US economic data showed inflation-adjusted gross domestic product in the country increased an annualized 2.3 percent in the fourth quarter of 2024 after rising 3.1 percent in the third quarter.
What's next for the gold price?
What's next for the gold price is never an easy call to make. There are many factors that affect the gold price, but some of the most prevalent long-term drivers include economic expansion, market risk, opportunity cost and momentum.
Economic expansion is one of the primary gold price contributors as it facilitates demand growth in several categories, including jewelry, technology and investment. As the World Gold Council explains, “This is particularly true in developing economies where gold is often used as a luxury item and a means to preserve wealth.” Market risk is also a prime catalyst for gold values as investors view the precious metal as the “ultimate safe haven,” and a hedge against currency depreciation, inflation and other systemic risks.
Going forward, in addition to the Fed, inflation and geopolitical events, experts will be looking for cues from factors like supply and demand. In terms of supply, the world’s five top gold producers are China, Australia, Russia, Canada and the US. The consensus in the gold market is that major miners have not spent enough on gold exploration in recent years. Gold mine production has fallen from around 3,200 to 3,300 metric tons each year between 2018 and 2020 to around 3,000 to 3,100 metric tons each year between 2021 and 2023.
On the demand side, China and India are the biggest buyers of physical gold, and are in a perpetual fight for the title of world’s largest gold consumer. That said, it's worth noting that the last few years have brought a big rebound in central bank gold buying, which dropped to a record low in 2020, but reached a 55 year high of 1,136 metric tons in 2022.
The World Gold Council has reported that central bank gold purchases in 2023 came to 1,037 metric tons, marking the second year in a row above 1,000 MT. In the first half of 2024, the organization says gold purchases from central banks reached a record 483 metric tons.
“I expect the Fed’s rate-cutting cycle to be good for gold, but central bank buying has been and remains a major factor," Lobo Tiggre, CEO of IndependentSpeculator.com, said in an email to the Investing News Network (INN) at the beginning of Q4.
David Barrett, CEO of the UK division of global brokerage firm EBC Financial Group, is also keeping an eye on central bank purchases of gold.
“I still see the global central bank buying as the main driver — as it has been over the last 15 years,” he said in an email to INN. "This demand removes supply from the market. They are the ultimate buy-and-hold participants and they have been buying massive amounts."
In addition to central bank moves, analysts are also watching for escalating tensions in the Middle East, a weakening US dollar, declining bond yields, and further interest rate cuts as factors that could push gold higher as investors look to secure their portfolios.
Speaking at the Metals Investor Forum, held in Vancouver, British Columbia, this September, Eric Coffin, editor of Hard Rock Analyst, outlined those key factors as supporting his prediction that gold could reach US$2,800 by the end of 2024.
“When it comes to outside factors that affect the market, it’s just tailwind after tailwind after tailwind. So I don’t really see the trend changing,” Coffin said.
Also speaking at the Metals Investor Forum, Jeff Clark, founder and editor at TheGoldAdvisor.com, was even more bullish on the precious metal. He sees Santa delivering US$3,000 gold as a good possibility.
However, others see gold taking a little longer to breach the US$3,000 level. Delegates at the London Bullion Market Association's annual gathering in October have forecasted a gold price of US$2,941 in the next 12 months.
Randy Smallwood of Wheaton Precious Metals (TSX:WPM,NYSE:WPM) thinks US$3,000 could become a reality within a couple of years. He told INN in an October 2024 interview that he believes the west has finally caught the gold fever that has mainly been contained to the east for much of the year.
Meanwhile, Alain Corbani, head of mining of Montbleu Finance and manager of the Global Gold and Precious Fund, told INN in an early January 2025 interview that his price target for the year is US$3,000 per ounce. He advises that the direction of interest rates in the US will be the most important factor to watch.
Should you beware of gold price manipulation?
As a final note on the price of gold and buying gold bullion, it’s important for investors to be aware that gold price manipulation is a hot topic in the industry.
In 2011, when gold hit what was then a record high, it dropped swiftly in just a few short years. This decline after three years of impressive gains led many in the gold sector to cry foul and point to manipulation. Early in 2015, 10 banks were hit in a US probe on precious metals manipulation. Evidence provided by Deutsche Bank (NYSE:DB) showed “smoking gun” proof that UBS Group (NYSE:UBS), HSBC Holdings (NYSE:HSBC), the Bank of Nova Scotia (NYSE:BNS) and other firms were involved in rigging gold and silver rates in the market from 2007 to 2013.
Not long after, the long-running London gold fix was replaced by the LBMA gold price in a bid to increase gold price transparency. The twice-a-day process, operated by the ICE Benchmark Administration, still involves a variety of banks collaborating to set the gold price, but the system is now electronic.
Still, manipulation has by no means been eradicated, as a 2020 fine on JPMorgan (NYSE:JPM) shows. The next year, chat logs were released in a spoofing trial for two former precious metals traders from the Bank of America’s (NYSE:BAC) Merrill Lynch unit. They show a trader bragging about how easy it is to manipulate the gold price.
Gold market participants have consistently spoken out about manipulation. In mid-2020, Chris Marcus, founder of Arcadia Economics and author of the book “The Big Silver Short,” said that when gold fell back below the US$2,000 mark after hitting close to US$2,070, he saw similarities to what happened with the gold price in 2011.
Marcus has been following the gold and silver markets with a focus specifically on price manipulation for nearly a decade. His advice? “Trust your gut. I believe we’re witnessing the ultimate ’emperor’s really naked’ moment. This isn’t complex financial analysis. Sometimes I think of it as the greatest hypnotic thought experiment in history.”
Investor takeaway
While we have the answer to what the highest gold price ever is as of now, it remains to be seen how high gold can climb, and if the precious metal can reach as high as US$5,000, US$10,000 or even US$40,000.
Even so, many market participants believe gold is a must have in any investment profile, and there is little doubt investors will continue to see gold price action making headlines this year and beyond.
This is an updated version of an article first published by the Investing News Network in 2020.
Don’t forget to follow us @INN_Resource for real-time updates!
Securities Disclosure: I, Melissa Pistilli, hold no direct investment interest in any company mentioned in this article.
Editorial Disclosure: The Investing News Network does not guarantee the accuracy or thoroughness of the information reported in the interviews it conducts. The opinions expressed in these interviews do not reflect the opinions of the Investing News Network and do not constitute investment advice. All readers are encouraged to perform their own due diligence.
Keep reading...Show less
Latest News
Latest Press Releases
Related News
TOP STOCKS
American Battery4.030.24
Aion Therapeutic0.10-0.01
Cybin Corp2.140.00
Investing News Network websites or approved third-party tools use cookies. Please refer to the cookie policy for collected data, privacy and GDPR compliance. By continuing to browse the site, you agree to our use of cookies.