Infinity Mining (ASX:IMI)

Extremely High-Grade Antimony with Gold Identified at Surface for Tanjil Dome

Trench sampling intervals return up to 104 g/t AuEq; geology has similarities with the Sunday Creek (ASX: SX2) gold-antimony deposit 100 km away; drill planning underway

Infinity Mining Limited (ASX: IMI) is pleased to report highly promising gold and antimony assays from the initial channel sampling program at Tanjil Dome, where exploration is being undertaken in joint venture with Mining One Consultants.

HIGHLIGHTS

  • Assays from trench samples return extremely promising results, with very high-grade antimony and gold.
  • TTD-002 returned 4.9 m @ 0.48 g/t Au and 7.71% Sb (26.92 g/t AuEq), including 1.2 m @ 0.46 g/t Au and 30.20% Sb (104.06 g/t AuEq).
  • TTD-001 returned 1.6 m @ 0.46 g/t Au and 2.23% Sb (8.11 g/t AuEq), including 0.6 m @ 0.47 g/t Au and 5.44% Sb (19.13 g/t AuEq).
  • TTD-006 returned 5.0 m @ 1.30 g/t Au and 0.02% Sb (1.37 g/t AuEq); TTD-005 returned 1.0 m @ 1.70 g/t Au and 0.02% Sb (1.77 g/t AuEq).
  • TTD-008 returned 0.6 m @ 1.22 g/t Au and 3.69% Sb (13.89 g/t AuEq).
  • The results come from sampling of 10 trenches comprising 62 channel intervals over 58.1 m, testing quartz veins and associated stibnite within highly weathered intrusive rocks.
  • The association of gold–antimony mineralisation with quartz veining and altered dyke rocks at Tanjil Dome shares broad geological similarities with aspects of the Sunday Creek (ASX: SX2) system in Victoria.
  • Results will guide further trench mapping and maiden drill program targeting. True widths and continuity between exposures and at depth remain unconfirmed.

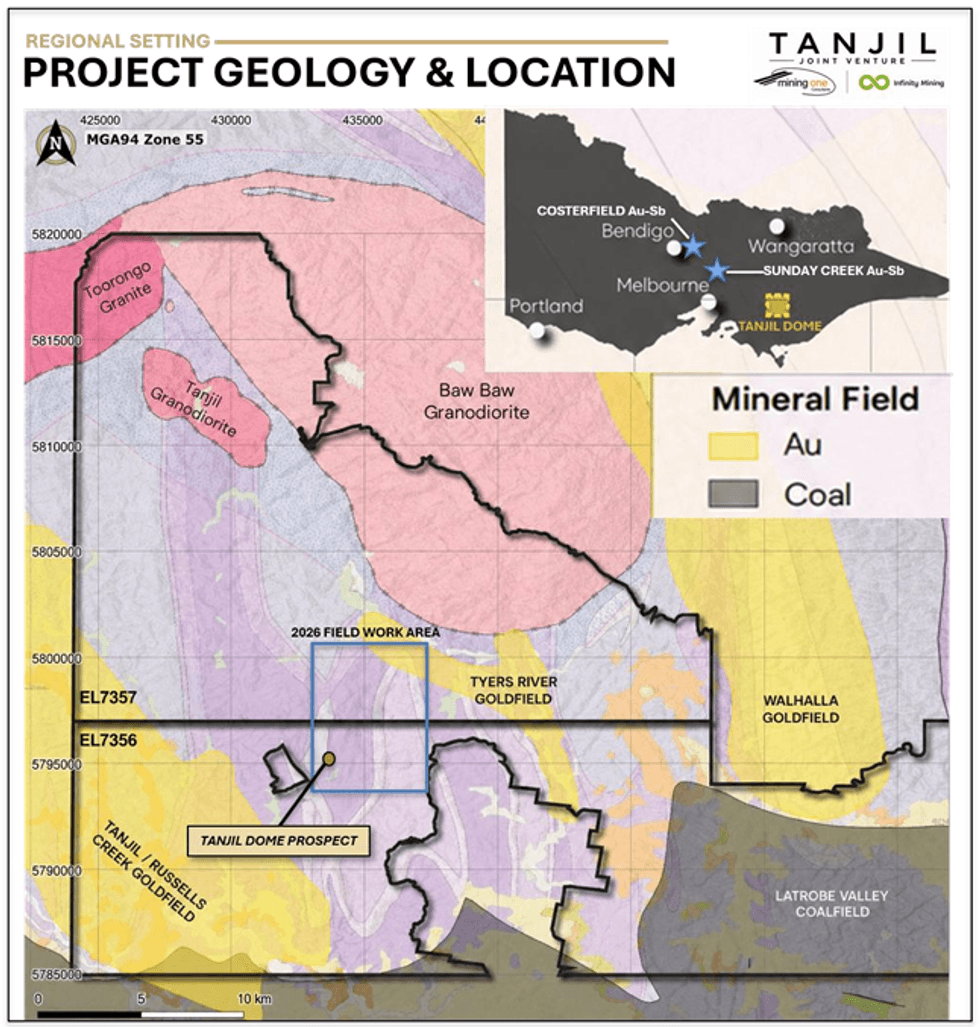
Figure 1 – Tanjil Dome Prospect Location Plan


The 10 trenches tested limited exposures within the broader ~1 km gold and antimony soil anomaly (Figure 2). Eight channels are clustered in the main trench sampling area and two lie approximately 200 m to the north. Figure 3 shows individual channel AuEq grades and selected composites. The soil anomaly is a geochemical footprint. Continuous mineralisation over that extent has not been established.


Click here for the full ASX Release

This article includes content from Infinity Mining, licensed for the purpose of publishing on Investing News Australia. This article does not constitute financial product advice. It is your responsibility to perform proper due diligence before acting upon any information provided here. Please refer to our full disclaimer here.

The Conversation (0)
Soap bubble bursting with stock market chart inside, displaying red downward trends on a dark background.

Experts Warn: AI Boom Shows Bubble Signs, but Investors May Miss the Exit

The artificial intelligence (AI) investment boom is showing many of the hallmarks of a market bubble, with soaring valuations, rising leverage and increasingly speculative capital flows prompting warnings from veteran investors at the New Orleans Investment Conference.During a popular annual... Keep Reading...
Don Hansen, gold bars.

Don Hansen: Gold, Silver Bull Run Not Over, My Strategy Now

Private investor Don Hansen shares his latest gold market analysis, emphasizing that the current bull market is likely only halfway through. "If we had a normal five or six times multiple, the gold bull market would go to US$8,000 to $10,000 an ounce in another four years," he said.Don't forget... Keep Reading...
Jp Cortez, gold bars.

Jp Cortez: Will the US Revalue Gold? Plus Repatriation, Fort Knox Audit

Jp Cortez, executive director at the Sound Money Defense League, reviews the organization's recent accomplishments in the US and talks about where it plans to focus in the year ahead, including efforts to move the SILVER Act forward. Cortez also explains why the push to audit Fort Knox... Keep Reading...
Three towering gold bars stand on a chart backdrop with numbers and graphs, text reads: 95426, 8599, 756.8.

Gold Majors’ Q3 Free Cashflow Falls as Spending and Costs Rise

Major gold producers ended the third quarter with less free cashflow than in Q2 as heavier capital spending and higher costs absorbed cash, even as gold edged higher.The LBMA gold price hit its quarterly low of US$3,978.55 per ounce on July 1, then climbed to a high of US$4,663.70 on August 24... Keep Reading...
Shiny gold bar rests on financial chart with fluctuating orange and blue lines.

Gold Price Rebounds After Jobs Data Sparks Friday Selloff

The gold price retreated on November 6, coming under pressure from a stronger US dollar and rising treasury yields, after new US jobs data showed that employers added 165,000 jobs in October.Spot gold was trading around US$4,063 per ounce by 2:55 p.m. EST. The decline followed a strong rally... Keep Reading...

Interactive Chart

Latest Press Releases

Related News