The Conversation (0)

Coelacanth Energy Inc. (TSXV: CEI,OTC:CEIEF) ("Coelacanth" or the "Company") is pleased to announce its financial and operating results for the three and nine months ended September 30, 2025. All dollar figures are Canadian dollars unless otherwise noted.
HIGHLIGHTS
| FINANCIAL RESULTS | Three Months Ended | Nine Months Ended | ||||
| September 30 | September 30 | |||||
| ($000s, except per share amounts) | 2025 | 2024 | % Change | 2025 | 2024 | % Change |
| Oil and natural gas sales | 11,372 | 2,362 | 381 | 18,866 | 9,192 | 105 |
| Cash flow from (used in) operating activities | 4,712 | (3,730) | (226) | 4,054 | (954) | (525) |
| Per share - basic and diluted (1) | 0.01 | (0.01) | (200) | 0.01 | (-) | (100) |
| Adjusted funds flow (used) (1) | 2,386 | (207) | (1,253) | 533 | 1,133 | (53) |
| Per share - basic and diluted | - | (-) | (-) | - | - | - |
| Net loss | (1,764) | (2,464) | (28) | (8,845) | (5,994) | 48 |
| Per share - basic and diluted | (-) | (-) | - | (0.02) | (0.01) | 100 |
| Capital expenditures (1) | 6,104 | 15,760 | (61) | 46,078 | 19,545 | 136 |
| Adjusted working capital (deficiency) (1) | (46,606) | 47,264 | (199) | |||
| Common shares outstanding (000s) | ||||||
| Weighted average - basic and diluted | 532,917 | 530,212 | 1 | 532,218 | 529,605 | - |
| End of period - basic | 533,029 | 530,267 | 1 | |||
| End of period - fully diluted | 591,544 | 617,214 | (4) | |||
(1) See "Non-GAAP and Other Financial Measures" section.
| Three Months Ended | Nine Months Ended | |||||
| OPERATING RESULTS (1) | September 30 | September 30 | ||||
| 2025 | 2024 | % Change | 2025 | 2024 | % Change | |
| Daily production (2) | ||||||
| Oil and condensate (bbls/d) | 1,372 | 221 | 521 | 703 | 268 | 162 |
| Other NGLs (bbls/d) | 92 | 33 | 179 | 48 | 36 | 33 |
| Oil and NGLs (bbls/d) | 1,464 | 254 | 476 | 751 | 304 | 147 |
| Natural gas (mcf/d) | 10,896 | 3,450 | 216 | 6,050 | 3,702 | 63 |
| Oil equivalent (boe/d) | 3,280 | 829 | 296 | 1,759 | 921 | 91 |
| Oil and natural gas sales | ||||||
| Oil and condensate ($/bbl) | 79.73 | 89.68 | (11) | 81.36 | 90.88 | (10) |
| Other NGLs ($/bbl) | 26.40 | 31.39 | (16) | 28.48 | 33.20 | (14) |
| Oil and NGLs ($/bbl) | 76.41 | 82.10 | (7) | 77.99 | 84.00 | (7) |
| Natural gas ($/mcf) | 1.08 | 1.41 | (23) | 1.74 | 2.16 | (19) |
| Oil equivalent ($/boe) | 37.69 | 30.99 | 22 | 39.28 | 36.41 | 8 |
| Royalties | ||||||
| Oil and NGLs ($/bbl) | 17.22 | 15.52 | 11 | 17.21 | 19.73 | (13) |
| Natural gas ($/mcf) | 0.01 | 0.06 | (83) | 0.12 | 0.23 | (48) |
| Oil equivalent ($/boe) | 7.70 | 5.02 | 53 | 7.76 | 7.44 | 4 |
| Operating expenses | ||||||
| Oil and NGLs ($/bbl) | 7.92 | 10.07 | (21) | 8.90 | 10.10 | (12) |
| Natural gas ($/mcf) | 1.28 | 1.68 | (24) | 1.48 | 1.68 | (12) |
| Oil equivalent ($/boe) | 7.79 | 10.07 | (23) | 8.90 | 10.10 | (12) |
| Net transportation expenses (3) | ||||||
| Oil and NGLs ($/bbl) | 4.25 | 2.36 | 80 | 4.11 | 2.30 | 79 |
| Natural gas ($/mcf) | 0.48 | 0.76 | (37) | 0.58 | 0.72 | (19) |
| Oil equivalent ($/boe) | 3.48 | 3.91 | (11) | 3.75 | 3.65 | 3 |
| Operating netback (loss) (3) | ||||||
| Oil and NGLs ($/bbl) | 47.02 | 54.15 | (13) | 47.77 | 51.87 | (8) |
| Natural gas ($/mcf) | (0.69) | (1.09) | (37) | (0.44) | (0.47) | (6) |
| Oil equivalent ($/boe) | 18.72 | 11.99 | 56 | 18.87 | 15.22 | 24 |
| Depletion and depreciation ($/boe) | (10.26) | (14.89) | (31) | (11.41) | (14.71) | (22) |
| General and administrative expenses ($/boe) | (4.61) | (12.51) | (63) | (9.14) | (13.90) | (34) |
| Stock based compensation ($/boe) | (3.82) | (13.81) | (72) | (7.39) | (12.72) | (42) |
| Finance expense ($/boe) | (5.64) | (2.71) | 108 | (8.36) | (1.72) | 386 |
| Finance income ($/boe) | 0.16 | 9.54 | (98) | 0.46 | 10.03 | (95) |
| Unutilized transportation ($/boe) | (0.39) | (9.94) | (96) | (1.45) | (5.96) | (76) |
| Net loss ($/boe) | (5.84) | (32.33) | (82) | (18.42) | (23.76) | (22) |
(1) See "Oil and Gas Terms" section.
(2) See "Product Types" section.
(3) See "Non-GAAP and Other Financial Measures" section.
Selected financial and operational information outlined in this news release should be read in conjunction with Coelacanth's unaudited condensed interim financial statements and related Management's Discussion and Analysis ("MD&A") for the three and nine months ended September 30, 2025, which are available for review under the Company's profile on SEDAR+ at https://www.sedarplus.ca.
OPERATIONS UPDATE
Coelacanth is continuing to work through its business plan of delineating and developing its large Montney resource base at Two Rivers that encompasses over 150 contiguous sections of Montney land tenure.
We are currently drilling three additional development wells on the 5-19 pad and will systematically bring on production from these wells plus prior drilled wells on the pad from now through early February.
Future development will consist of continued drilling in the vicinity of the 5-19 pad while significant step-outs will be incorporated into the capital budget to accelerate the delineation of the resource both aerially through the land base and vertically through the various Montney zones present on the land base.
We look forward to reporting on future developments as they arise.
OIL AND GAS TERMS
The Company uses the following frequently recurring oil and gas industry terms in the news release:
| Liquids Bbls Bbls/d NGLs Condensate | Barrels Barrels per day Natural gas liquids (includes condensate, pentane, butane, propane, and ethane) Pentane and heavier hydrocarbons |
| Natural Gas Mcf Mcf/d MMcf/d | Thousands of cubic feet Thousands of cubic feet per day Millions of cubic feet per day |
| Oil Equivalent Boe Boe/d | Barrels of oil equivalent Barrels of oil equivalent per day |
Disclosure provided herein in respect of a boe may be misleading, particularly if used in isolation. A boe conversion rate of six thousand cubic feet of natural gas to one barrel of oil equivalent has been used for the calculation of boe amounts in the news release. This boe conversion rate is based on an energy equivalency conversion method primarily applicable at the burner tip and does not represent a value equivalency at the wellhead.
NON-GAAP AND OTHER FINANCIAL MEASURES
This news release refers to certain measures that are not determined in accordance with IFRS (or "GAAP"). These non-GAAP and other financial measures do not have any standardized meaning prescribed under IFRS and therefore may not be comparable to similar measures presented by other entities. The non-GAAP and other financial measures should not be considered alternatives to, or more meaningful than, financial measures that are determined in accordance with IFRS as indicators of the Company's performance. Management believes that the presentation of these non-GAAP and other financial measures provides useful information to shareholders and investors in understanding and evaluating the Company's ongoing operating performance, and the measures provide increased transparency to better analyze the Company's performance against prior periods on a comparable basis.
Non-GAAP Financial Measures
Adjusted funds flow (used)
Management uses adjusted funds flow (used) to analyze performance and considers it a key measure as it demonstrates the Company's ability to generate the cash necessary to fund future capital investments and abandonment obligations and to repay debt, if any. Adjusted funds flow (used) is a non-GAAP financial measure and has been defined by the Company as cash flow from (used in) operating activities excluding the change in non-cash working capital related to operating activities, movements in restricted cash deposits and expenditures on decommissioning obligations. Management believes the timing of collection, payment or incurrence of these items involves a high degree of discretion and as such may not be useful for evaluating the Company's cash flows. Adjusted funds flow (used) is reconciled from cash flow from (used in) operating activities as follows:
| Three Months Ended | Nine Months Ended | |||
| September 30 | September 30 | |||
| ($000s) | 2025 | 2024 | 2025 | 2024 |
| Cash flow from (used in) operating activities | 4,712 | (3,730) | 4,054 | (954) |
| Add (deduct): | ||||
| Decommissioning expenditures | 198 | 790 | 385 | 1,266 |
| Change in restricted cash deposits | - | 2,139 | - | 2,985 |
| Change in non-cash working capital | (2,524) | 594 | (3,906) | (2,164) |
| Adjusted funds flow (used) (non-GAAP) | 2,386 | (207) | 533 | 1,133 |
Net transportation expenses
Management considers net transportation expenses an important measure as it demonstrates the cost of utilized transportation related to the Company's production. Net transportation expenses is calculated as transportation expenses less unutilized transportation and is calculated as follows:
| Three Months Ended | Nine Months Ended | |||
| September 30 | September 30 | |||
| ($000s) | 2025 | 2024 | 2025 | 2024 |
| Transportation expenses | 1,168 | 1,055 | 2,498 | 2,426 |
| Unutilized transportation | (119) | (757) | (699) | (1,504) |
| Net transportation expenses (non-GAAP) | 1,049 | 298 | 1,799 | 922 |
Operating netback
Management considers operating netback an important measure as it demonstrates its profitability relative to current commodity prices. Operating netback is calculated as oil and natural gas sales less royalties, operating expenses, and net transportation expenses and is calculated as follows:
| Three Months Ended | Nine Months Ended | |||
| September 30 | September 30 | |||
| ($000s) | 2025 | 2024 | 2025 | 2024 |
| Oil and natural gas sales | 11,372 | 2,362 | 18,866 | 9,192 |
| Royalties | (2,324) | (383) | (3,725) | (1,878) |
| Operating expenses | (2,349) | (767) | (4,272) | (2,549) |
| Net transportation expenses | (1,049) | (298) | (1,799) | (922) |
| Operating netback (non-GAAP) | 5,650 | 914 | 9,070 | 3,843 |
Capital expenditures
Coelacanth utilizes capital expenditures as a measure of capital investment on property, plant, and equipment, exploration and evaluation assets and property acquisitions compared to its annual budgeted capital expenditures. Capital expenditures are calculated as follows:
| Three Months Ended | Nine Months Ended | |||
| September 30 | September 30 | |||
| ($000s) | 2025 | 2024 | 2025 | 2024 |
| Capital expenditures – property, plant, and equipment | 4,238 | 396 | 5,276 | 973 |
| Capital expenditures – exploration and evaluation assets | 1,866 | 15,364 | 40,802 | 18,572 |
| Capital expenditures (non-GAAP) | 6,104 | 15,760 | 46,078 | 19,545 |
Capital Management Measures
Adjusted working capital (deficiency)
Management uses adjusted working capital (deficiency) as a measure to assess the Company's financial position. Adjusted working capital (deficiency) is calculated as current assets and restricted cash deposits less current liabilities, excluding the current portion of decommissioning obligations.
| ($000s) | September 30, 2025 | December 31, 2024 |
| Current assets | 4,259 | 11,579 |
| Less: | ||
| Current liabilities | (56,325) | (37,234) |
| Working capital deficiency | (52,066) | (25,655) |
| Add: | ||
| Restricted cash deposits | 4,900 | 4,900 |
| Current portion of decommissioning obligations | 560 | 2,118 |
| Adjusted working capital deficiency (Capital management measure) | (46,606) | (18,637) |
Non-GAAP Financial Ratios
Adjusted Funds Flow (Used) per Share
Adjusted funds flow (used) per share is a non-GAAP financial ratio, calculated using adjusted funds flow (used) and the same weighted average basic and diluted shares used in calculating net loss per share.
Net transportation expenses per boe
The Company utilizes net transportation expenses per boe to assess the per unit cost of utilized transportation related to the Company's production. Net transportation expenses per boe is calculated as net transportation expenses divided by total production for the applicable period.
Operating netback per boe
The Company utilizes operating netback per boe to assess the operating performance of its petroleum and natural gas assets on a per unit of production basis. Operating netback per boe is calculated as operating netback divided by total production for the applicable period.
Supplementary Financial Measures
The supplementary financial measures used in this news release (primarily average sales price per product type and certain per boe and per share figures) are either a per unit disclosure of a corresponding GAAP measure, or a component of a corresponding GAAP measure, presented in the financial statements. Supplementary financial measures that are disclosed on a per unit basis are calculated by dividing the aggregate GAAP measure (or component thereof) by the applicable unit for the period. Supplementary financial measures that are disclosed on a component basis of a corresponding GAAP measure are a granular representation of a financial statement line item and are determined in accordance with GAAP.
PRODUCT TYPES
The Company uses the following references to sales volumes in the news release:
Natural gas refers to shale gas
Oil and condensate refers to condensate and tight oil combined
Other NGLs refers to butane, propane and ethane combined
Oil and NGLs refers to tight oil and NGLs combined
Oil equivalent refers to the total oil equivalent of shale gas, tight oil, and NGLs combined, using the conversion rate of six thousand cubic feet of shale gas to one barrel of oil equivalent.
The following is a complete breakdown of sales volumes for applicable periods by specific product types of shale gas, tight oil, and NGLs:
| Three Months Ended | Nine Months Ended | |||
| September 30 | September 30 | |||
| Sales Volumes by Product Type | 2025 | 2024 | 2025 | 2024 |
| Condensate (bbls/d) | 46 | 33 | 27 | 36 |
| Other NGLs (bbls/d) | 92 | 33 | 48 | 36 |
| NGLs (bbls/d) | 138 | 66 | 75 | 72 |
| Tight oil (bbls/d) | 1,326 | 188 | 676 | 232 |
| Condensate (bbls/d) | 46 | 33 | 27 | 36 |
| Oil and condensate (bbls/d) | 1,372 | 221 | 703 | 268 |
| Other NGLs (bbls/d) | 92 | 33 | 48 | 36 |
| Oil and NGLs (bbls/d) | 1,464 | 254 | 751 | 304 |
| Shale gas (mcf/d) | 10,896 | 3,450 | 6,050 | 3,702 |
| Natural gas (mcf/d) | 10,896 | 3,450 | 6,050 | 3,702 |
| Oil equivalent (boe/d) | 3,280 | 829 | 1,759 | 921 |
FORWARD-LOOKING INFORMATION
This document contains forward-looking statements and forward-looking information within the meaning of applicable securities laws. The use of any of the words "expect", "anticipate", "continue", "estimate", "may", "will", "should", "believe", "intends", "forecast", "plans", "guidance" and similar expressions are intended to identify forward-looking statements or information.
More particularly and without limitation, this news release contains forward-looking statements and information relating to the Company's oil and condensate, other NGLs, and natural gas production, capital programs, and adjusted working capital. The forward-looking statements and information are based on certain key expectations and assumptions made by the Company, including expectations and assumptions relating to prevailing commodity prices and exchange rates, applicable royalty rates and tax laws, future well production rates, the performance of existing wells, the success of drilling new wells, the availability of capital to undertake planned activities, and the availability and cost of labour and services.
Although the Company believes that the expectations reflected in such forward-looking statements and information are reasonable, it can give no assurance that such expectations will prove to be correct. Since forward-looking statements and information address future events and conditions, by their very nature they involve inherent risks and uncertainties. Actual results may differ materially from those currently anticipated due to a number of factors and risks. These include, but are not limited to, the risks associated with the oil and gas industry in general such as operational risks in development, exploration and production, delays or changes in plans with respect to exploration or development projects or capital expenditures, the uncertainty of estimates and projections relating to production rates, costs, and expenses, commodity price and exchange rate fluctuations, marketing and transportation, environmental risks, competition, the ability to access sufficient capital from internal and external sources and changes in tax, royalty, and environmental legislation. The forward-looking statements and information contained in this document are made as of the date hereof for the purpose of providing the readers with the Company's expectations for the coming year. The forward-looking statements and information may not be appropriate for other purposes. The Company undertakes no obligation to update publicly or revise any forward-looking statements or information, whether as a result of new information, future events or otherwise, unless so required by applicable securities laws.
Coelacanth is an oil and natural gas company, actively engaged in the acquisition, development, exploration, and production of oil and natural gas reserves in northeastern British Columbia, Canada.
Further Information
For additional information, please contact:
Coelacanth Energy Inc.
Suite 2110, 530 - 8th Avenue SW
Calgary, Alberta T2P 3S8
Phone: (403) 705-4525
www.coelacanth.ca
Mr. Robert J. Zakresky
President and Chief Executive Officer
Mr. Nolan Chicoine
Vice President, Finance and Chief Financial Officer
Neither the TSX Venture Exchange nor its Regulation Services Provider (as that term is defined in the policies of the TSX Venture Exchange) accepts responsibility for the adequacy or accuracy of this release.

To view the source version of this press release, please visit https://www.newsfilecorp.com/release/275291
News Provided by Newsfile via QuoteMedia


Large-scale Montney resource, infrastructure-led growth
Coelacanth Energy is a pure-play Montney oil and natural gas company advancing one of the largest contiguous land positions in the Montney light oil window of northeastern British Columbia. Supported by a substantial discovered and undiscovered hydrocarbon resource base, growing production, established infrastructure and a management team that has built and sold six successful energy companies, Coelacanth is executing a strategy focused on increasing both near-term cash flow and long-term resource value.
Coelacanth Energy (TSXV:CEI) is a Canadian oil and natural gas exploration and development company focused on the Montney Formation in northeastern British Columbia. The company controls over 150 contiguous sections in the Two Rivers region, a strategically positioned acreage block within the Montney light oil window. As one of the largest landholders in this highly prospective area, Coelacanth has assembled a large-scale resource platform with significant development potential.
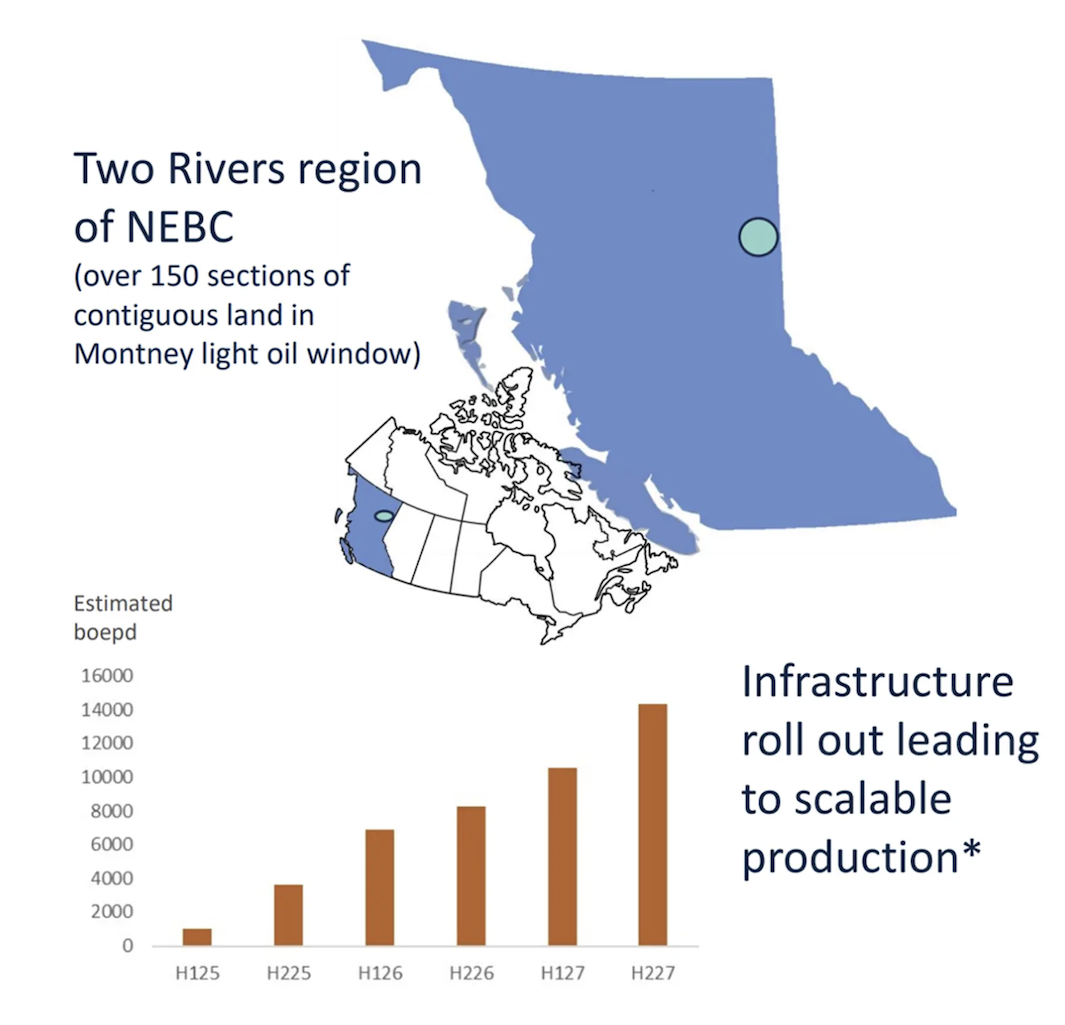
The company’s asset base is supported by substantial petroleum initially-in-place estimates prepared by GLJ. These include 6.9 billion barrels of discovered oil PIIP and 8.3 billion barrels of undiscovered oil PIIP, alongside 5.9 Tcf of discovered gas PIIP and 7.1 Tcf of undiscovered gas PIIP. The resource spans multiple Montney intervals, including the Upper, Lower, Basal and Middle Montney, providing extensive opportunities for future development and delineation.
Coelacanth’s strategy combines near-term production growth with long-term resource value creation. The company has secured critical infrastructure, contracted gas takeaway and processing capacity, and advanced development activities across its Two Rivers assets. Average production reached 7,632 boe/d in Q2 2026, reflecting continued progress in transitioning from delineation and infrastructure buildout toward scalable production growth.
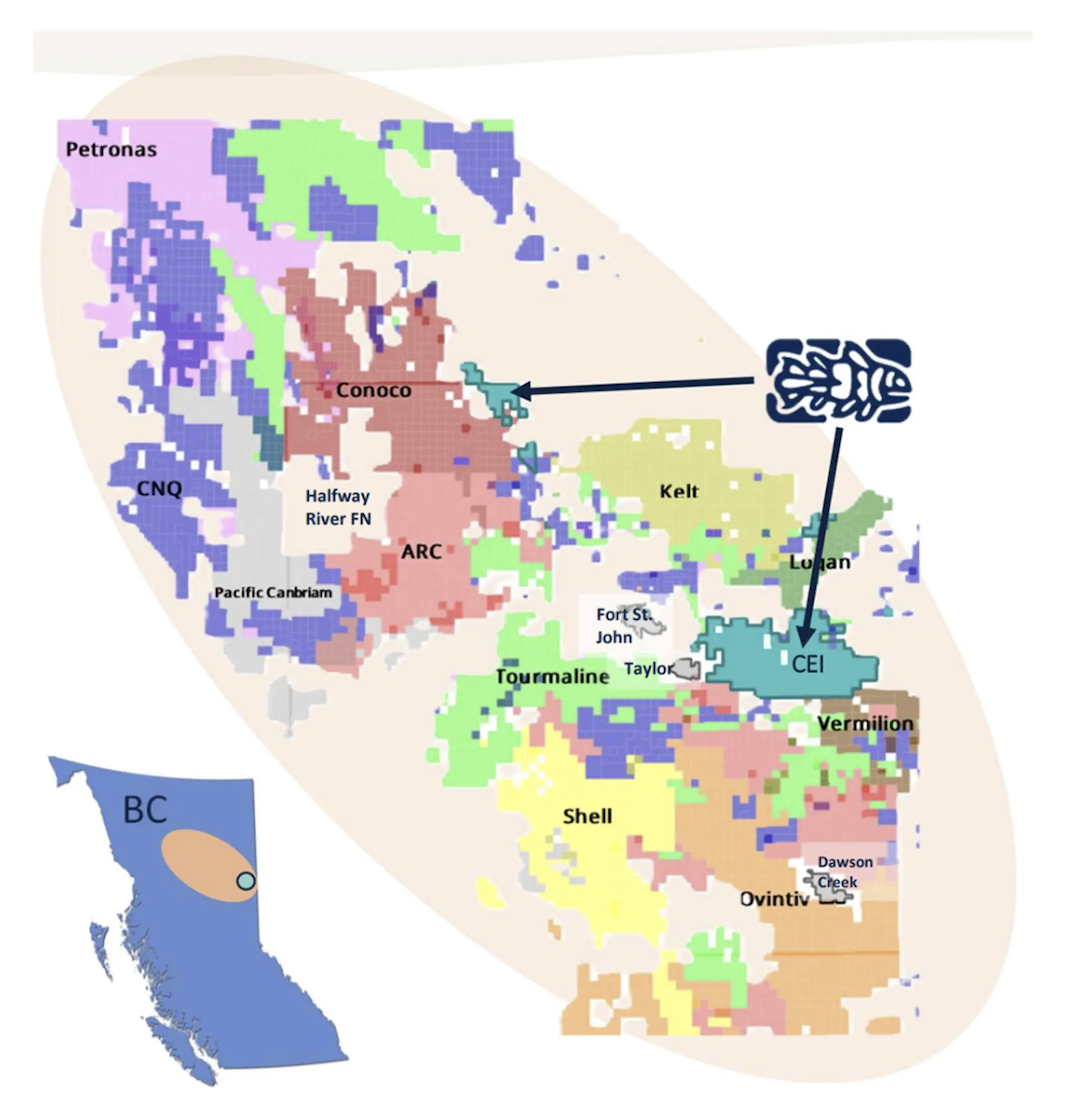
A key differentiator for Coelacanth is its leadership team. Management has successfully built and sold six previous public energy companies and has demonstrated an ability to create value through multiple commodity cycles. Supported by deep operational, geological and financial expertise, the team is focused on disciplined execution of the company’s Montney growth strategy.
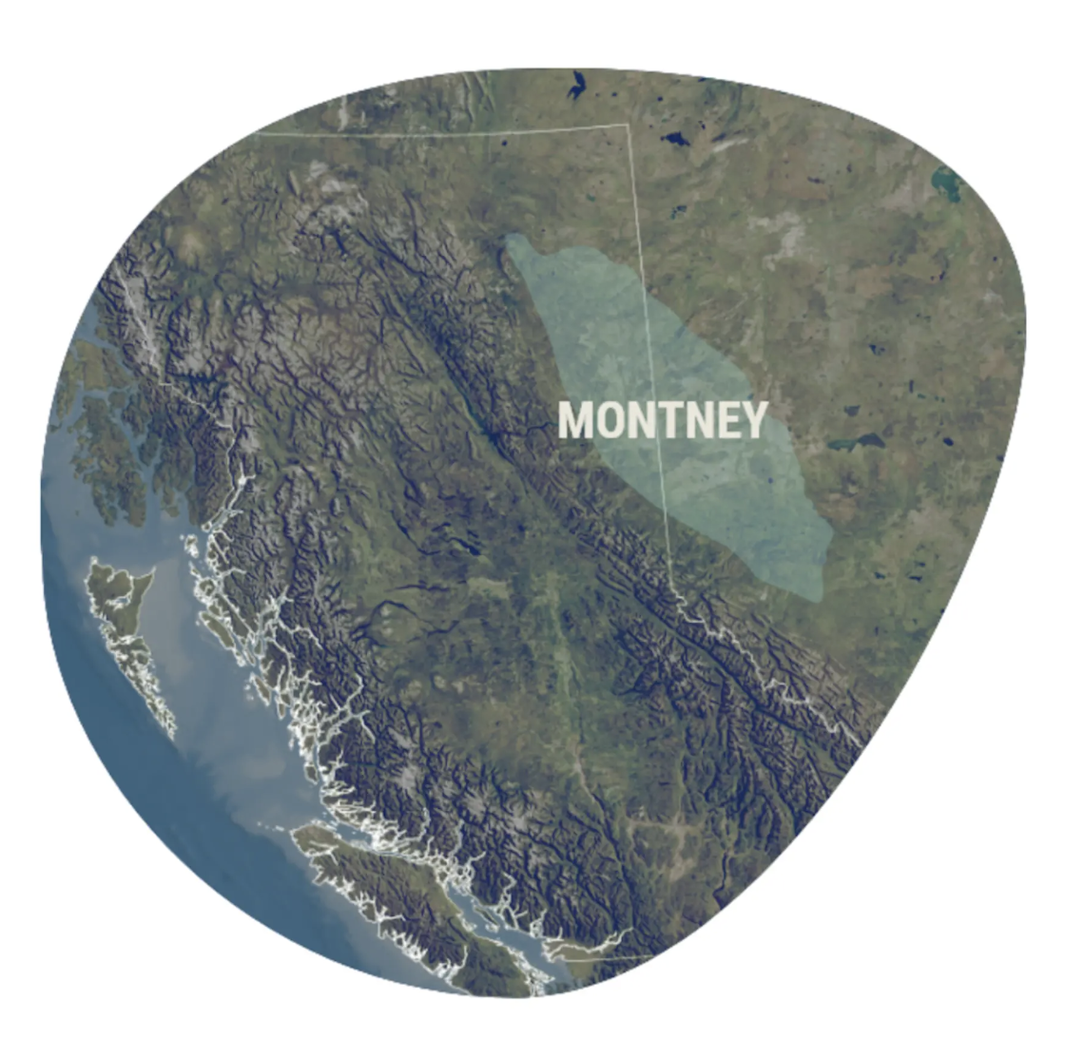
The Two Rivers project forms the cornerstone of Coelacanth’s growth strategy and encompasses the company’s extensive Montney land position in northeastern British Columbia. The project hosts multiple productive horizons, including the Upper, Lower, Basal and Middle Montney intervals, supporting a multi-zone development approach across the acreage. Geological delineation has been completed, providing a strong technical foundation for future drilling and development.
The project has demonstrated commercial productivity through successful drilling and testing programs. Coelacanth established proof of commerciality at both Two Rivers East and Two Rivers West, while development at the 5-19 and 10-08 pads confirmed productivity across multiple Montney benches. All 12 wells on the 5-19 pad were onstream by April 1, 2026, marking a significant milestone in the project’s progression.
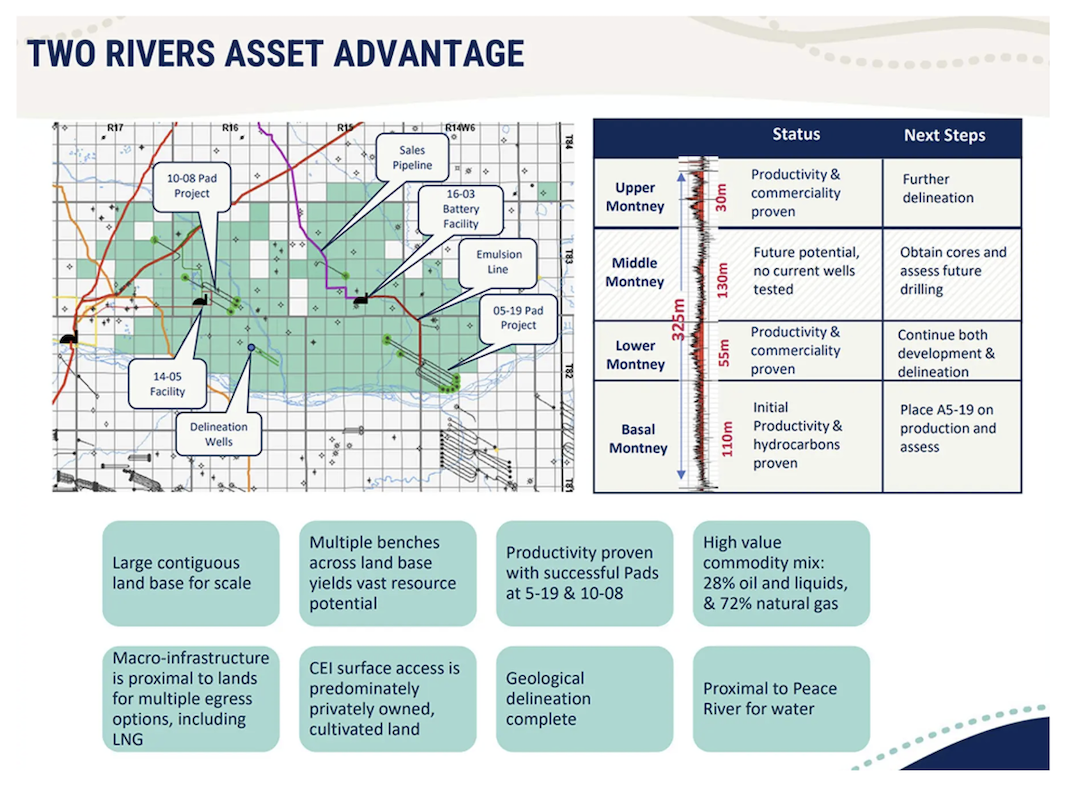
Infrastructure development has been a major focus of the company’s execution strategy. Coelacanth has secured infrastructure financing, completed key facility and pipeline construction, contracted up to 100 mmcf/d of gas takeaway capacity and secured processing capacity of up to 60 mmcf/d. These initiatives establish the infrastructure foundation required to support future production growth.
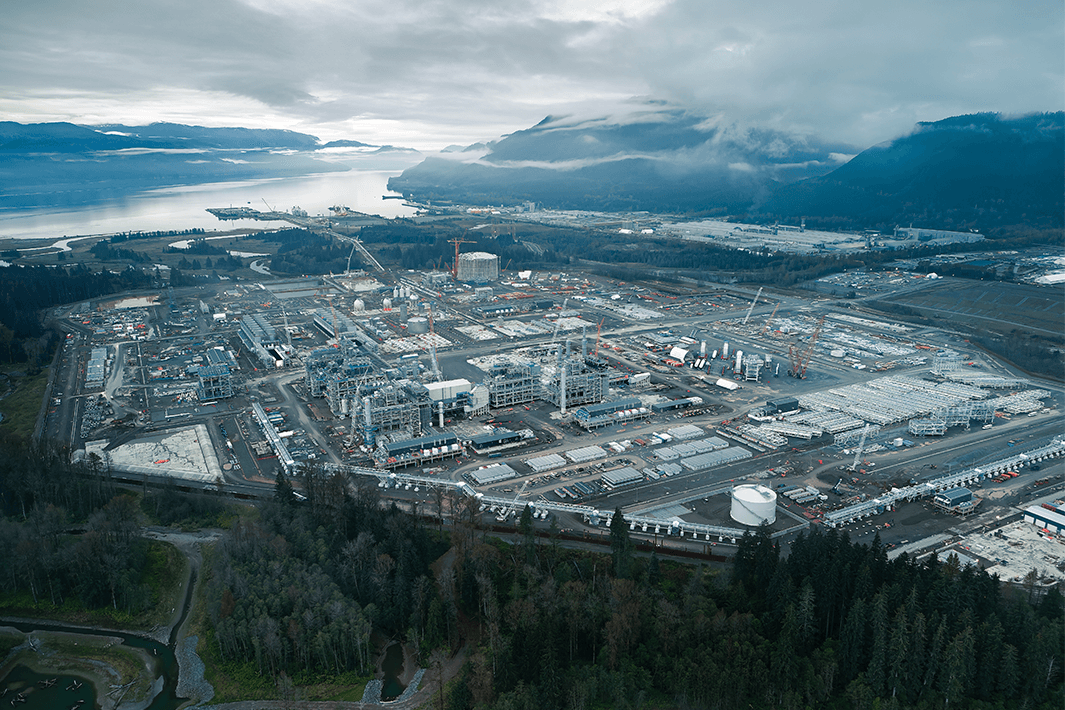
The Two Rivers asset also benefits from strong market access. The company’s production can access major regional pipeline systems, including NGTL, Westcoast and Alliance, while its acreage is directly connected to LNG Canada through the Coastal GasLink system for potential future delivery. Coelacanth Energy said the long-term view for LNG expansion in British Columbia is very positive for its land, believing that lands with scale and direct access as such will trade at a premium once they are delineated and the resource is proven for development.
Combined with a commodity mix of approximately 31 percent oil and liquids and 72 percent natural gas, the project offers exposure to multiple energy markets.
Rob Zakresky is a veteran energy executive who previously served as president and CEO of Leucrotta Exploration, Crocotta Energy, Chamaelo Exploration, Chamaelo Energy, Viracocha Energy and Bellator Exploration. He has a proven track record of building and monetizing public energy companies and leads Coelacanth’s strategic growth and value creation initiatives.
Nolan Chicoine previously served as CFO and vice-president finance at Leucrotta Exploration, Crocotta Energy and Chamaelo Exploration, and was controller at Chamaelo Energy and Viracocha Energy. He is responsible for financial strategy, reporting and capital management.
Jody Denis is a former drilling, engineering and operations engineer at Leucrotta Exploration. His previous experience also includes senior operational and drilling leadership roles with Black Swan Energy, ARC Resources and Birchcliff Energy. He formerly led Coelacanth Energy’s drilling and completions activities.
John Fur previously served as manager of exploration at Leucrotta Exploration and held senior geophysical positions with Crocotta Energy, Chamaelo Energy, Viracocha Energy, Canadian Natural Resources, Post Energy, Amber Energy and Husky Oil. He oversees geological evaluation and resource delineation across the company’s Montney assets.
Jonathon Hanson has 20 years of industry experience. He previously served as manager for exploitation at Spartan Dela Corp, and was a senior exploitation engineer for companies Vermilion Energy, Lynx Energy and Saguaro Resources. He will focus on exploitation and reservoir management for Coelacanth Energy.