
May 18, 2022
Timberline Resources Corporation (OTCQB:TLRS);(TSXV:TBR) ("Timberline" or the "Company") is pleased to report results from two more core holes from the 2021 drilling program at its 100%-controlled Eureka Project in Nevada. These are the final outstanding assays from the drill program, and they include one core hole in the Water Well Zone (WWZ) and the completed silver and multielement data from core hole BHSE-206C - totaling 861 meters of drilling.
The results from BHSE-192C confirm a significant zone of strong gold grades in the WWZ between drill holes BHSE-220C and BHSE-212C, which were reported during the first quarter (see Figure 1 and Company news releases dated February 24 and March 9, 2022). Highlights of the mineralization in BHSE-192C include:
- 24.4m at 3.85 grams per tonne (g/t) gold from 349.6 depth, including
- 4.6m at 8.35 g/t gold from 354.2m depth; and including
- 7.6m at 5.72 g/t gold from 364.8m depth.
The Company also received the complete analyses for silver (Ag) and other elements in drill hole BHSE-206C, from which the gold and partial multielement data were reported in a news release dated March 24, 2022. As previously reported, this hole included multiple intervals of anomalous gold, including 7.6m averaging 1.04 g/t and 86.9m of 0.16 g/t. However, the new analyses reveal that the drill hole is more mineralized in silver, lead (Pb), and zinc (Zn) than previously thought. One significant interval hosted by altered dolomite, breccias, and intrusive dikes included more than 202.7m that averaged 5.28 g/t Ag, including 56.4m averaging 9.69 g/t Ag, 0.17% Zn, and 0.11% Pb. This style of Ag-rich mineralization is believed by Timberline geologists to be older than the Carlin-type gold system, likely associated with Cretaceous-aged carbonate-replacement type deposits (CRD).
Patrick Highsmith, Timberline's President and CEO commented, "Drill hole BHSE-192C is an angled hole drilled into the Water Well Zone from the east. It is one of the first core holes to fill in between the high-grade results we reported last quarter. Our core drilling continues to confirm that the breccias at the base of the Dunderberg Shale are consistently mineralized over considerable thickness, but this hole also encountered strong gold grades in sheared and altered mudstones higher up in the Dunderberg. This result also extends the zone well to the east from previous drilling. Given the encouraging gold and silver associated with the IP anomaly in the Graben Zone farther east in BHSE-206C, we look forward to adding more core drilling in this area during the summer."
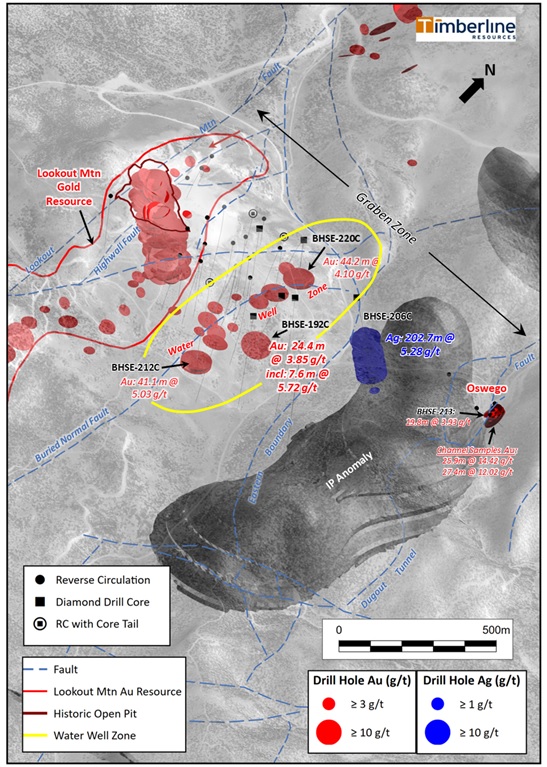
Figure 1 shows how the new results fit into the growing footprint of >3 g/t gold in the Water Well Zone. The long run of highly anomalous silver is also plotted along the trace of BHSE-206C. The IP anomaly occupies the graben between the Lookout-WWZ and Oswego gold occurrences, and it has yet to be tested at depth. Timberline expects to begin offsetting the new high-grade intercepts at the WWZ and near-surface gold at Oswego in June.
Figure 1 - Orthoimage Showing Lookout Mountain Resource, WWZ, and Oswego Target

Geological Details and Interpretation
BHSE-192C was drilled on an azimuth of 300° at an initial inclination of -65°. The hole was designed to pass through an interpreted fault zone and penetrate the base of the east-dipping Dunderberg Shale. BHSE-206C was inclined -75° in a northeast direction (azimuth 050°) and designed to assess the upper reaches of the large IP chargeability anomaly identified in 2021.
Drillhole BHSE-192C was collared in the post-mineral volcanic rocks that occupy the Graben Zone east of the Lookout Mountain resource. The Cambrian-aged Windfall Formation was encountered at approximately 56m depth. The Windfall is a gray to orange (variably oxidized) thin-bedded limestone or silty-carbonate with frequent argillaceous layers or partings. In this area, the unit is highly faulted and brecciated, resulting in significant amounts of fault gouge and some core loss. The drillhole passed into the Dunderberg Shale at approximately 202m depth. The blue gray to greenish Dunderberg alternates between bedded and massive mudstone and is calcite-veined throughout. The upper portions of the unit exhibit frequent argillaceous partings and more reactive (carbonate-rich) bands. There is also ample evidence of faulting and brecciation. Fine-grained disseminated pyrite is first noted at approximately 210m depth, but there are several intervals of oxidation associated with faulting.
The gold zones occur near the base of the Dunderberg, but the highest-grade assays in the hole (13.75 g/t and 8.41 g/t Au) occur above the basal (carbonaceous and silicified) breccias that have characterized much of the WWZ. The upper zone of mineralization is associated with very fine-grained argillaceous mudstones that are sheared and brecciated, but not highly silicified or carbonaceous. The contact with the underlying Hamburg Dolomite is marked by approximately 8m of black, brecciated, silicified breccias containing sooty pyrite, and this interval is consistently rich in gold. Low levels of anomalous gold continue for at least 30m into the light-gray massive dolomite of the Hamburg, in which the hole was terminated.
BHSE-206C passed through a thick section of limestones - often highly fractured, brecciated, and variably oxidized - that are often anomalous in silver and arsenic in zones of fault breccia and gouge. The degree of brecciation and alteration increases with depth as the limestone passes into a chaotic interval of interbedded sanded dolomite (altered) and fine grained felsic intrusive rock with abundant pyrite, which locally exceeds 10%. The felsic dikes or sills begin at approximately 95m depth. The intrusive unit is light gray to green, fine-grained and has apparent granitic composition, termed an aplite. The aplite has been propylitically altered, evidenced in part by the presence of chlorite, calcite, and sericite.
Gold and silver are most abundant in the dolomite, particularly where it is highly fractured and brecciated. There is a good correlation between the presence of pyrite, gold, and silver, but the most intense silver mineralization is associated with a zone of iron oxide occurring between 270m and 321m depth. Arsenic is a well-known pathfinder element for Carlin-type gold, but it is also associated with the older silver-lead-zinc CRD mineralization in the Eureka District. Almost the entirety of this drill hole is enriched in arsenic, but local anomalies in elements such as bismuth, molybdenum and tungsten support the interpretation of nearby intrusive activity that may be driving the abundant silver (0.05 - 61.3 ppm), lead (2 - 7,000 ppm), and zinc (9 - >10,000 ppm) in the Graben Zone.
Pyrite increases as the drill hole passes into a light gray to pale green, fine-grained section of altered sediments, which may be affected by contact metamorphism from nearby intrusive rocks. The hole was terminated in an interval with abundant chlorite-sericite-pyrite veining and considerable evidence of faulting (brecciation and fault gouge).
Superimposed mineral systems are common and considered favorable in larger Carlin-type gold districts. The Ruby Hill - Archimedes Mine (i80 Gold Corp.), north of the Eureka Project, is an excellent example where millions of ounces of Carlin-type gold resources are reported to occur as overprinting earlier silver (gold) - lead - zinc mineralization. Similarly, at least three generations of mineralization are reported in the giant Carlin Trend District. The multiple generations of mineralization may have used the same fluid pathways in the rocks; plus, the earlier stage alteration and mineralization may have enhanced the receptiveness of the host rocks to the later Carlin-type fluids. Timberline is ramping up for its 2022 exploration program, which will target the Water Well Zone, the Oswego Target, and the huge IP anomaly that occupies the graben in between.
Sampling Methodology, Chain of Custody, Quality Control and Quality Assurance
Cutting and sampling of core samples was directed by Timberline representatives. Personnel from Timberline or the drilling contractors transported the samples to Timberline's secure Eureka facility, from which the samples were picked up by personnel from ALS USA Inc. (ALS) for sample preparation in Elko, Nevada or Tucson, Arizona. Quality control was monitored by the insertion of numerous blind certified standard reference materials, field duplicates, and blanks into each sample shipment. Drill samples were assayed by ALS for gold by fire assay of a 30-gram charge with an AA or ICP-ES finish (ALS code Au-AA23). The overlimits for gold samples assaying above 10 g/t were determined by a 30-gram fire assay with gravimetric finish. Satisfactory results were achieved for all quality control samples related to the data reported herein. In addition, gold mineralized samples were submitted for multi-element analysis (33 elements) by four-acid digestion and ICP-ES determination (code ME-ICP61).
Steven Osterberg, Ph.D., P.G., Timberline's Vice President Exploration, is a Qualified Person as defined by National Instrument 43-101 and has reviewed and approved the technical contents of this release. Dr. Osterberg is not independent of the Company as he is an officer.
About Timberline Resources
Timberline Resources Corporation is focused on delivering high-grade Carlin-Type gold discoveries at its district-scale Eureka Project in Nevada. The Eureka Property includes the historic Lookout Mountain and Windfall mines in a total property position of approximately 24 square miles (62 square kilometers). The Lookout Mountain Resource was reported in compliance with Canadian NI 43-101 in an Updated Technical Report on the Lookout Mountain Project by Mine Development Associates, Effective March 1, 2013, filed on SEDAR April 12, 2013 (see Cautionary Note to US Investors below).
Resource Category | Tonnage (million short tons) | Grade (oz/ton) | Grade (grams/tonne) | Contained Au (troy oz) |
Measured | 3.04 | 0.035 | 1.2 | 106,000 |
Indicated | 25.90 | 0.016 | 0.6 | 402,000 |
Inferred | 11.71 | 0.012 | 0.41 | 141,000 |
The Company is also operator of the Paiute Joint Venture Project with Nevada Gold Mines in the Battle Mountain District. These properties lie on the prolific Battle Mountain-Eureka gold trend. Timberline also controls the Seven Troughs Project in northern Nevada, which is one of the state's highest-grade former gold producers. Timberline controls over 43 square miles (111 square kilometers) of mineral rights in Nevada. Detailed maps and mineral resources estimates for the Eureka Project and NI 43-101 technical reports for its projects may be viewed at https://timberlineresources.co/.
Timberline is listed on the OTCQB where it trades under the symbol "TLRS" and on the TSX Venture Exchange where it trades under the symbol "TBR".
On behalf of the Board of Directors,
"Patrick Highsmith"
President and CEO
Tel: 208-664-4859
Cautionary Note to U.S. Investors: The terms "mineral resource," "measured mineral resource," "indicated mineral resource" and "inferred mineral resource," as used on Timberline's website and in its news releases are Canadian mining terms that are defined in accordance with National Instrument 43-101 - Standards of Disclosure for Mineral Projects ("NI 43-101"). These Canadian terms are not defined terms under United States Securities and Exchange Commission ("SEC") Industry Guide 7 and are normally not permitted to be used in reports and registration statements filed with the SEC by U.S. registered companies. The SEC permits U.S. companies, in their filings with the SEC, to disclose only those mineral deposits that a company can economically and legally extract or produce. Accordingly, note that information describing the Company's "mineral resources" is not directly comparable to information made public by U.S. companies subject to reporting requirements under U.S. securities laws. U.S. investors are urged to consider closely the disclosure in the Company's Form 10-K which may be secured from the Company, or online at https://www.sec.gov/edgar.shtml.
Forward-Looking Statements: Statements contained herein that are not based upon current or historical fact are forward-looking in nature and constitute forward-looking statements within the meaning of Section 27A of the Securities Act of 1933 and Section 21E of the Securities Exchange Act of 1934. Such forward-looking statements reflect the Company's expectations about its future operating results, performance and opportunities that involve substantial risks and uncertainties. These include, but are not limited to, statements regarding the advancement of projects, the footprint and continuity of mineralization, the growth of resources, and exploration potential. When used herein, the words "anticipate," "believe," "estimate," "upcoming," "plan," "target," "intend," "growth opportunity," and "expect" and similar expressions, as they relate to Timberline Resources Corporation, its subsidiaries, or its management, are intended to identify such forward-looking statements. These forward-looking statements are based on information currently available to the Company and are subject to a number of risks, uncertainties, and other factors that could cause the Company's actual results, performance, prospects, and opportunities to differ materially from those expressed in, or implied by, these forward-looking statements. Factors that could cause or contribute to risks involving forward-looking statements include, but are not limited to, changes in the Company's business and other factors, including risk factors discussed in the Company's Form 10-K for the year ended September 30, 2021. Except as required by law, the Company does not undertake any obligation to release publicly any revisions to any forward-looking statements.
Neither the TSX Venture Exchange nor its Regulation Services Provider (as that term is defined in the policies of the TSX Venture Exchange) accept responsibility for the adequacy or accuracy of this release.
The Conversation (0)
07 April 2022
Timberline Resources Corporation
Timberline Resources Corp is a mineral exploration company. It is principally engaged in the business of exploring for precious metal deposits and advancing them towards production. The company holds interests in Eureka, Paiute, and Seven Trough properties, all located in Nevada.
2h
What Was the Highest Price for Gold?
Gold has long been considered a store of wealth, and the price of gold often makes its biggest gains during turbulent times as investors look for cover in this safe-haven asset.
The 21st century has so far been heavily marked by episodes of economic and sociopolitical upheaval. Uncertainty has pushed the precious metal to record highs as market participants seek its perceived security.
And each time the gold price rises, there are calls for even higher record-breaking levels.
Gold market gurus from Lynette Zang to Chris Blasi to Jordan Roy-Byrne have shared eye-popping predictions on the gold price that would intrigue any investor — gold bug or not.
Some have posited that the gold price may rise as high as US$4,000 or US$5,000 per ounce, and there are those who believe that US$10,000 gold or even US$40,000 gold could become a reality.
These impressive price predictions have investors wondering, what is gold's all-time high (ATH)?
In the past year, gold has reached new all-time highs dozens of times. Find out what has driven it to these levels, plus how the gold price has moved historically and what has impacted its performance in recent years.
In this article
How is gold traded?
Before discovering what the highest gold price ever was, it’s worth looking at how the precious metal is traded. Knowing the mechanics behind gold's historical moves can help illuminate why and how its price changes.
Gold bullion is traded in dollars and cents per ounce, with activity taking place worldwide at all hours, resulting in a live price. Investors trade gold in major commodities markets such as New York, London, Tokyo and Hong Kong.
London is seen as the center of physical precious metals trading, including for silver. The COMEX division of the New York Mercantile Exchange is home to most paper trading.
There are many popular ways to invest in gold. The first is through purchasing gold bullion products such as bullion bars, bullion coins and rounds. Physical gold is sold on the spot market, meaning that buyers pay a specific price per ounce for the metal and then have it delivered or stored in a secure facility. In some parts of the world, such as India, buying gold in the form of jewelry is the largest and most traditional route to investing in gold.
Another path to gold investment is paper trading, which is done through the gold futures market. Participants enter into gold futures contracts for the delivery of gold in the future at an agreed-upon price.
In such contracts, two positions can be taken: a long position under which delivery of the metal is accepted or a short position to provide delivery of the metal. Paper trading as a means to invest in gold can provide investors with the flexibility to liquidate assets that aren’t available to those who possess physical gold bullion.
One significant long-term advantage of trading in the paper market is that investors can benefit from gold’s safe-haven status without needing to store it. Furthermore, gold futures trading can offer more financial leverage in that it requires less capital than trading in the physical market. Investors can also purchase physical gold via the futures market, but the process is complicated and lengthy and comes with a large investment and additional costs.
Aside from those options, market participants can invest in gold through exchange-traded funds (ETFs). Investing in a gold ETF is similar to trading a gold stock on an exchange, and there are numerous gold ETF options to choose from depending on your preference. For instance, some ETFs focus solely on physical gold bullion, while others focus on gold futures contracts. Other gold ETFs center on gold-mining stocks or follow the gold spot price.
It is important to understand that you will not own any physical gold when investing in an ETF — in general, even a gold ETF that tracks physical gold cannot be redeemed for tangible metal.
Gold has an interesting relationship with the stock market. The two often move in sync during “risk-on periods” when investors are bullish. On the flip side, they tend to become inversely correlated in times of volatility.
According to the World Gold Council, gold's ability to decouple from the stock market during periods of stress makes it “unique amongst most hedges in the marketplace.” It is often during these times that gold outperforms the stock market. For that reason, it is often used as a portfolio diversifier to hedge against uncertainty.
There are a variety of options for investing in gold stocks, including gold-mining stocks on the TSX and ASX, gold juniors, precious metals royalty companies and gold stocks that pay dividends.
What was the highest gold price ever?
The gold price peaked at US$3,702.45, its all-time high, during trading on September 16, 2025.
What drove it to this new ATH? Gold reached its new highest price the first day of the September US Federal Reserve meeting of the Federal Open Market Committee, at which an interest rate cut is widely expected.
On September 12, the prior trading day, the release of US consumer price index (CPI) data for August showed the overall inflation rose to 2.9 percent on an annual basis and 0.4 percent over July. Weak jobs data the week before further fueled expectations of a rate cut at the upcoming US Fed meeting.
Additionally, the US dollar index continued its largely downward trend that started in mid-January, falling to a year-to-date low 96.56 on September 16. Traditionally, gold often trades higher when the US dollar is weak, making gold a popular hedge investment.
While gold's fresh ATH came on September 15, on September 7 gold's record breaking run officially surpassed its inflation adjusted all-time high of US$850 per ounce set in January 1980 the week before.
It has set multiple news highs in the preceding weeks amid significant uncertainty in the US and global economies and surging gold ETF purchases.
One key driver came on August 29, when a US federal appeals court ruled that US President Donald Trump's "Liberation Day" tariffs, announced in April, are illegal, stating that only Congress has the power to enact widespread tariffs. The Trump administration is expected to appeal the ruling, which will go into effect on October 14.
Bond market turmoil in the US and abroad on September 2 also provided tailwinds for the gold price.
2025 gold price performance
Gold price chart, December 31, 2024, to September 16, 2025.
Chart via the Investing News Network.
Why is the gold price setting new highs in 2025?
Gold's record-setting activity extends beyond the last two weeks as well.
Increased economic and geopolitical turmoil caused by the Trump administration has been a tailwind for gold this year, as well as a weakening US dollar, sticky inflation in the country and increased safe-haven gold demand.
Since coming into office in late January, Trump has threatened or enacted tariffs on many countries, including blanket tariffs on longtime US allies Canada and Mexico and tariffs on the EU.
Trump has also implemented 25 percent tariffs on all steel and aluminum imports.
The gold price set a string of new highs in the month of April amid high market volatility as markets reacted to tariff decisions from Trump and the escalating trade war between the US and China. By April 11, Trump had raised US tariffs on Chinese imports to 145 percent and China had raised its tariffs on US products to 125 percent. Trump has reiterated that the US may need to go through a period of economic pain to enter a new "golden age" of economic prosperity.
Falling markets and a declining US dollar have supported gold too, as well as increased buying from China. Elon Musk's call to audit the gold holdings in Fort Knox has also brought attention to the yellow metal.
What factors have driven the gold price in the last five years?
Despite these recent runs, gold has seen its share of both peaks and troughs over the last decade. After remaining rangebound between US$1,100 and US$1,300 from 2014 to early 2019, gold pushed above US$1,500 in the second half of 2019 on a softer US dollar, rising geopolitical issues and a slowdown in economic growth.
Gold’s first breach of the significant US$2,000 price level in mid-2020 was due in large part to economic uncertainty caused by the COVID-19 pandemic. To break through that barrier and reach what was then a record high, the yellow metal added more than US$500, or 32 percent, to its value in the first eight months of 2020.
Gold price chart, September 14, 2020, to September 15, 2025.
Chart via the Investing News Network.
The gold price surpassed that level again in early 2022 as Russia's invasion of Ukraine collided with rising inflation around the world, increasing the allure of safe-haven assets and pulling the yellow metal up to a price of US$2,074.60 on March 8. However, it fell throughout the rest of 2022, dropping below US$1,650 in October.
Although it didn't quite reach the level of volatility as the previous year, the gold price experienced drastic price changes in 2023 on the back of banking instability, high interest rates and the breakout of war in the Middle East.
After central bank buying pushed the gold price up to the US$1,950.17 mark by the end of January, the Fed's 0.25 percent rate hike on February 1 sparked a retreat as the dollar and treasury yields saw gains. The precious metal went on to fall to its lowest price level of the year at US$1,809.87 on February 23.
The banking crisis that hit the US in early March caused a domino effect through the global financial system and led to the mid-March collapse of Credit Suisse, Switzerland’s second-largest bank. The gold price had jumped to US$1,989.13 by March 15. The continued fallout in the global banking system throughout the second quarter of the year allowed gold to break above US$2,000 on April 3, and go on to flirt with a near-record high of US$2,049.92 on May 3.
Those gains were tempered by the Fed’s ongoing rate hikes and improvements in the banking sector, resulting in a downward trend in the gold price throughout the remainder of the second quarter and throughout Q3. By October 4, gold had fallen to a low of US$1,820.01 and analysts expected the precious metal to drop below US$1,800.
That was before the October 7 attacks by Hamas on Israel ignited legitimate fears of a much larger conflict erupting in the Middle East. Reacting to those fears, and to rising expectations that the Fed would begin to reverse course on interest rates, gold broke through the important psychological level of US$2,000 and closed at US$2,007.08 on October 27. As the fighting intensified, gold reached a then-new high of US$2,152.30 in intraday trading on December 3.
That robust momentum in the spot gold price continued into 2024, chasing new highs on fears of a looming US recession, the promise of Fed rate cuts on the horizon, the worsening conflict in the Middle East and the tumultuous US presidential election year. By mid-March, gold was pushing up against the US$2,200 level.
That record-setting momentum continued into the second quarter of 2024, when gold broke through US$2,400 in mid-April on strong central bank buying, sovereign debt concerns in China and investors expecting the Fed to start cutting interest rates. The precious metal went on to hit US$2,450.05 on May 20.
Throughout the summer, the hits kept on coming.
The global macro environment was highly bullish for gold leading up to the US election. Following the failed assassination attempt on Trump and a statement about coming rate cuts by Fed Chair Jerome Powell, the gold spot price hit a then new all-time high on July 16 at US$2,469.30. One week later, news that then-President Joe Biden would not seek re-election and would instead pass the baton to Vice President Kamala Harris eased some of the tension in the stock market and strengthened the US dollar. This also pushed the price of gold down to US$2,387.99 on July 22, 2024.
However, the bullish factors supporting gold remained in play, and the spot price for gold went on to breach US$2,500 on August 2 that year on a less-than-stellar US jobs report; it closed just above the US$2,440 level. A few weeks later, gold pushed past US$2,500 once again on August 16, closing above that level for the first time ever after the US Department of Commerce released data showing a fifth consecutive monthly decrease in a row for homebuilding.
The news that the Chinese government issued new gold import quotas to banks in the country following a two month pause also helped fuel the gold price rally. Central bank gold buying has been a significant tailwind for the gold price this year, and China's central bank has been one of the strongest buyers.
Market watchers expected the Fed to cut interest rates by a quarter point at its September 2024 meeting, but news on September 12 that the regulators were still deciding between the expected cut or a larger half-point cut led the gold price on a rally that carried through into the next day, bringing the metal near US$2,600.
At the September 18 Fed meeting, the committee ultimately made the decision to cut rates by half a point, news that sent gold even higher. By September 20, it had moved above US$2,600 and was holding above US$2,620.
In October 2024, gold first breached the US$2,700 level and continued to higher on a variety of factors, including further rate cuts and economic data anticipation, the escalating conflict in the Middle East between Israel and Hezbollah, and economic stimulus in China — not to mention the very close race between the US presidential candidates.
While the gold price fell following Trump's win in early November and largely held under US$2,700 through the end of the year, it began trending upward in 2025 to the new all-time high discussed earlier in the article.
What's next for the gold price?
What's next for the gold price is never an easy call to make. There are many factors to consider, but some of the most prevalent long-term drivers include economic expansion, market risk, opportunity cost and momentum.
Economic expansion is one of the primary gold price contributors as it facilitates demand growth in several categories, including jewelry, technology and investment. As the World Gold Council explains, “This is particularly true in developing economies where gold is often used as a luxury item and a means to preserve wealth.”
Market risk is also a prime catalyst for gold values as investors view the precious metal as the “ultimate safe haven,” and a hedge against currency depreciation, inflation and other systemic risks.
Going forward, in addition to the Fed, inflation and geopolitical events, experts will be looking for cues from factors like supply and demand. In terms of supply, the world’s five top gold producers are China, Australia, Russia, Canada and the US. The consensus in the gold market is that major miners have not spent enough on gold exploration in recent years. Gold mine production has fallen from around 3,200 to 3,300 metric tons (MT) each year between 2018 and 2020 to around 3,000 to 3,100 MT each year between 2021 and 2023.
On the demand side, China and India are the biggest buyers of physical gold, and are in a perpetual fight for the title of world’s largest gold consumer. That said, it's worth noting that the last few years have brought a big rebound in central bank gold buying, which dropped to a record low in 2020, but reached a 55 year high of 1,136 MT in 2022.
World Gold Council data shows 2024 central bank gold purchases came to 1,044.6 MT, marking the third year in a row above 1,000 MT. In H1 2025, the organization says gold purchases from central banks reached 415.1 MT.
“I expect the Fed’s rate-cutting cycle to be good for gold, but central bank buying has been and remains a major factor," Lobo Tiggre, CEO of IndependentSpeculator.com, told the Investing News Network (INN) at the start of Q4 2024.
David Barrett, CEO of the UK division of global brokerage firm EBC Financial Group, is also keeping an eye on central bank purchases of gold. “I still see the global central bank buying as the main driver — as it has been over the last 15 years,” the expert said in an email to INN. "This demand removes supply from the market. They are the ultimate buy-and-hold participants and they have been buying massive amounts."
In addition to central bank moves, analysts are also watching escalating tensions in the Middle East, a weakening US dollar, declining bond yields and further interest rate cuts as factors that could push gold higher as investors look to secure their portfolios. “When it comes to outside factors that affect the market, it’s just tailwind after tailwind after tailwind. So I don’t really see the trend changing,” said Eric Coffin of Hard Rock Analyst.
Randy Smallwood of Wheaton Precious Metals (TSX:WPM,NYSE:WPM) told INN in March 2025 that gold is seeing support from many factors, including central bank buying, nervousness around the US dollar and stronger institutional interest. Smallwood is seeing an influx of fund managers wanting to learn about precious metals.
Joe Cavatoni, senior market strategist, Americas, at the World Gold Council, believes that market risk and uncertainty surrounding tariffs and continued demand from central banks are the main drivers of gold.
"Market risk in particular is a key strategic driver for the gold price and performance," Cavatoni told INN in a July 2025 interview. "Think strategically when you think about gold, and keep that allocation in mind."
Check out more of INN's interviews to find out what experts have said about the gold price during its 2025 bull run and where it could go next.
Should you beware of gold price manipulation?
It’s important for investors to be aware that gold price manipulation is a hot topic in the industry.
In 2011, when gold hit what was then a record high, it dropped swiftly in just a few short years. This decline after three years of impressive gains led many in the gold sector to cry foul and point to manipulation.
Early in 2015, 10 banks were hit in a US probe on precious metals manipulation.
Evidence provided by Deutsche Bank (NYSE:DB) showed “smoking gun” proof that UBS Group (NYSE:UBS), HSBC Holdings (NYSE:HSBC), the Bank of Nova Scotia (TSX:BNS,NYSE:BNS and other firms were involved in rigging gold and silver rates in the market from 2007 to 2013. Not long after, the long-running London gold fix was replaced by the LBMA gold price in a bid to increase gold price transparency. The twice-a-day process, operated by the ICE Benchmark Administration, still involves a variety of banks collaborating to set the gold price, but the system is now electronic.
Still, manipulation has by no means been eradicated, as a 2020 fine on JPMorgan Chase & Co. (NYSE:JPM) shows. The next year, chat logs were released in a spoofing trial for two former precious metals traders from the Bank of America's (NYSE:BAC) Merrill Lynch unit. They show a trader bragging about how easy it is to manipulate the gold price.
Gold market participants have consistently spoken out about manipulation. In mid-2020, Chris Marcus, founder of Arcadia Economics and author of the book “The Big Silver Short,” said that when gold fell back below the US$2,000 mark after hitting close to US$2,070, he saw similarities to what happened with the gold price in 2011.
Marcus has been following the gold and silver markets with a focus specifically on price manipulation for nearly a decade. His advice? “Trust your gut. I believe we’re witnessing the ultimate ’emperor’s really naked’ moment. This isn’t complex financial analysis. Sometimes I think of it as the greatest hypnotic thought experiment in history.”
Investor takeaway
While we have the answer to what the highest gold price ever is as of now, it remains to be seen how high gold can climb, and if the precious metal can reach as high as US$5,000, US$10,000 or even US$40,000.
Even so, many market participants believe gold is a must have in any investment profile, and there is little doubt investors will continue to see gold price action making headlines this year and beyond.
This is an updated version of an article first published by the Investing News Network in 2020.
Don’t forget to follow us @INN_Resource for real-time updates!
Securities Disclosure: I, Lauren Kelly, hold no direct investment interest in any company mentioned in this article.
Editorial Disclosure: The Investing News Network does not guarantee the accuracy or thoroughness of the information reported in the interviews it conducts. The opinions expressed in these interviews do not reflect the opinions of the Investing News Network and do not constitute investment advice. All readers are encouraged to perform their own due diligence.
Keep reading...Show less
14h
Angkor Resources: Unlocking Cambodia’s Resource Potential through Energy and Minerals Assets
Founded in 2009 and listed in 2011, Angkor Resources (TSXV:ANK,OTCQB:ANKOF) has developed a dual focus on energy and minerals across Asia and North America.
Angkor Resources is advancing a dual-track strategy across energy and minerals. In Canada, its subsidiary EnerCam Exploration generates revenue from oil production, water disposal, and gas processing, while also pioneering carbon capture and conversion solutions.
In Cambodia, subsidiary EnerCam Resources is driving the nation’s first-ever onshore oil and gas exploration on Block VIII, positioning the company for transformational growth. On the mineral side, Angkor is a first-mover in Cambodia’s underexplored belts, with licenses at Andong Meas and Andong Bor targeting both precious and base metals, where exploration has already confirmed copper porphyry systems and high-grade gold mineralization.
Angkor mitigates risk by diversifying revenue, combining recurring Canadian cash flow with high-impact exploration in Cambodia, where management prioritizes hydrocarbons and copper, highlighting 25 million recoverable barrels and significant copper-gold potential.
Company Highlights
- Diversified Energy & Mineral Portfolio: Exposure to high-impact oil and gas exploration in Cambodia (Block VIII), recurring energy revenues in Canada, and copper-gold porphyry systems with gold epithermal near-surface prospects in Cambodia.
- Near-term Catalysts:
- Results from copper porphyry in Cambodia within 30 to 60 days;
- Seismic completion and interpretation for drill targets on Block VIII within 90 days; and
- Acquisition of oil production for increased recurring revenue streams.
- Transformational Asset: Block VIII is Cambodia’s first onshore oil and gas exploration license, strategically located near export infrastructure. Potential minimum targets estimated at 25 to 50+ million recoverable barrels.
- Revenue-backed Model: EnerCam Canada provides recurring revenue streams via oil production, water disposal, gas processing, and carbon capture solutions, insulating Angkor from over-reliance on equity markets.
- Strong ESG Commitment: Recognized at the United Nations for sustainability, Angkor integrates carbon capture, community partnerships and environmental responsibility into every project.
- Aligned Shareholder Base: Over 40 percent insider ownership with regular insider buying, demonstrating management’s confidence in long-term growth.
This Angkor Resources profile is part of a paid investor education campaign.*
Click here to connect with Angkor Resources (TSXV:ANK) to receive an Investor Presentation
Keep reading...Show less
16h
MBK Due Diligence Completed & Whiteheads Drilling Commencing
Metal Bank Limited (ASX:MBK) (‘MBK’ or ‘the Company’) announced on 10 September 2025 that it has signed a non-binding term sheet (Term Sheet) with Hastings Technology Metals Ltd (ASX:HAS) (HAS) for the acquisition of the gold assets of HAS, (subject to due diligence, binding documentation and other conditions precedent including shareholder approval) (Proposed Acquisition), and has commenced a scoping study for the Kingsley and Homestead deposits at the Livingstone Project, furthering its Western Australian focussed gold strategy to expand MBK’s WA gold portfolio and move to production.
- MBK has completed its Due Diligence for the acquisition of the HAS Gold Assets
- HAS has completed a heritage survey at the Seven Leaders prospect and all other approvals are in place to Commence Drilling
- The Seven Leaders Drilling Program will commence on 22 September 2025
- Drilling is focused around the Seven Leaders Project and will include geotechnical drilling for use in pit design
- HAS have set aside $500k to use on advancing the Whiteheads project whilst the MBK Acquisition continues through the regulatory phases
MBK has now completed its Due Diligence and the preparation of binding documentation and other documents required for shareholder and other approvals is proceeding.
Under the Proposed Acquisition MBK is to acquire the following HAS Gold Assets:
- Great Western Gold Pty Ltd (GWG), the holder of a 75% interest in the Whiteheads Gold Project JV tenements and other tenements 100% held by GWG, covering ~380sqkm located approximately 80km NE of Kalgoorlie (Whiteheads Project);
- Ark Gold Pty Ltd (Ark), the holder of the Ark gold project, comprising two exploration licences located approx. 40km southeast of HAS’ Yangibana Project 250 km northeast of Carnarvon in Western Australia (Ark Project); and
- The Darcy’s gold project comprising 3 exploration licenses covering an area of ~ 100 sq kmssituated adjacent to HAS’ Brockman Niobium and Heavy Rare Earths Project in theEast Kimberley region of Western Australia (Darcy Project).
*The Proposed Acquisition is subject to satisfactory completion of mutual due diligence, signing of binding documentation, MBK shareholder approval under Listing Rule 7.1 and other necessary approvals, including ASX review pursuant to Listing Rule 11.1.
A summary of the agreed terms for the Proposed Acquisition is set out in MBK’s ASX Release of 10 September 2025 “MBK Executing WA Gold Strategy”.
HAS is continuing to advance the Whiteheads project prior to completion of the Proposed Acquisition. HAS has advised it has now completed an initial Heritage Survey with the Kakarra people at the Sever Leaders Prospect which has confirmed that no heritage sites are within the initial drill site area. HAS has also confirmed that all other necessary permits and approvals are in place and drilling will commence on 22 September for an initial resource at Seven Leaders and further HAS’ plan to early production.
The initial drill plan consists of c.1,500m of RC drilling to confirm historical drill data and a geotechnical diamond core hole to ensure adequate geotechnical data is available to design and implement the starter pit.
The drill program, including the diamond hole, will take approx. 2 weeks to complete. On completion of drilling and the subsequent drill hole assays, HAS intends to announce an initial Resource on the Seven Leaders project, proceeding to mining lease application and submission of the Mining Proposal.
MBK’s Chair Ines Scotland commented: “HAS are working full-steam ahead on advancing the Whiteheads Gold Project with the $500k of funds set aside for this purpose. Tim Gilbert, who will become MBK’s CEO post the completion of the transaction is an experienced mining engineer and is managing the approvals and upcoming drill program. There will be solid news flow as both the Whiteheads and Livingstone Project have a lot of work underway.”
Click here for the full ASX Release
This article includes content from Metal Bank Limited, licensed for the purpose of publishing on Investing News Australia. This article does not constitute financial product advice. It is your responsibility to perform proper due diligence before acting upon any information provided here. Please refer to our full disclaimer here.
Keep reading...Show less
20h
Over 50% Q-o-Q Production Growth Targeted
22h
John Feneck: Next Gold, Silver Price Targets, 11 Stocks I'm Bullish on Now
John Feneck, portfolio manager and consultant at Feneck Consulting, shares his outlook for gold and silver prices in 2025. His next target for gold is US$3,800 per ounce, and he still expects US$50 per ounce silver by the end of the year.
He also discusses the potential he sees in junior miners.
Don't forget to follow us @INN_Resource for real-time updates!
Securities Disclosure: I, Charlotte McLeod, hold no direct investment interest in any company mentioned in this article.
Keep reading...Show less
23h
Sun Summit Minerals Eyes "Multimillion-Ounce" Gold Deposit at JD Project
Sun Summit Minerals (TSXV:SMN,OTCQB:SMREF) is advancing toward a multimillion-ounce resource at its flagship JD gold project in BC following “fantastic” results from the first drill hole, which showed high-grade, shallow mineralization, according to CEO Niel Marotta.
“The thesis here is that, if we prove up a multimillion-ounce deposit, we really think there's 10x potential in our market cap. We're trading at about a C$40 million market cap now, which is about 10 percent of our neighbors. So that, I think, is what people ought to focus on,” he said.
In a recent announcement, Sun Summit reported that the first hole completed in 2025 returned “one of the strongest intervals of consistent and near-surface gold mineralization” drilled to date at the Creek zone. Results include 78 meters of 3.72 grams per ton gold starting at 30 meters down hole. The company plans to conduct follow-up drilling this season.
“This is a new parallel zone that we think is being expressed and defined here. And so that's very exciting that this deposit continues to grow in scale,” Marotta said.
The chief executive noted that more news about the other 10 drill holes completed at the Creek zone is anticipated in the coming months, with additional drilling also being undertaken in other areas of the property.
Watch the full interview with Niel Marotta, CEO of Sun Summit Minerals, above.
Keep reading...Show less
Latest News
Latest Press Releases
Related News
TOP STOCKS
American Battery4.030.24
Aion Therapeutic0.10-0.01
Cybin Corp2.140.00