Mawson Finland Limited Further Expands the Known Mineralized Zones at Rajapalot: Raja Step-Out Drilling Returns Multiple Significant Intercepts

Mawson Finland Limited Further Expands the Known Mineralized Zones at Rajapalot: Raja Step-Out Drilling Returns Multiple Significant Intercepts

Mawson Finland Limited ("Mawson" or the "Company") (TSXV:MFL) is pleased to announce new drill results from 10 drillholes at the Raja and Joki zones of mineralization which were drilled as part of the Company's 38-hole 2024 winter drilling campaign on the Company's wholly-owned Rajapalot gold-cobalt project in Finland (see Table 1 and Figure 1 in Schedule "A" hereto

Highlights:

  • PAL0347 and PAL0349 drilled multiple intercepts in south-westward step-outs to the Raja gold-cobalt mineral system, extending the envelope of mineralisation significantly by approximately 30 and 50 metres respectively, including;

    • PAL0347 - 5.8 m @ 2.17 g/t gold from 184.3 m (cobalt TBA), 3 m @ 2.43 g/t gold from 201.55 m (cobalt TBA), and 8.6 m @ 1.9 g/t gold from 209 m (cobalt TBA)

    • PAL0349 - 3.6 m @ 1.74 g/t gold and 1007 ppm cobalt from 294.5 m, and 4 m @ 0.65 g/t gold and 32 ppm cobalt from 320.8m

  • PAL0355, PAL0353 and PAL0358 drilled multiple intercepts in north-eastward step-outs to the Raja gold-cobalt mineral system, extending the envelope of mineralisation by between 40 and 90 metres, including;

    • PAL0355 - 2 m @ 2.85 g/t gold and 130 ppm cobalt from 257.5 m, and 2 m @ 1.73 g/t gold and 262 ppm cobalt from 265.6 m

    • PAL0353 - 0.9 m @ 0.37 g/t Au and 77 ppm cobalt from 91.3 m, and 3 m @ 1.81 g/t gold and 288 ppm cobalt from 211 m

    • PAL0358 - 5.95 m @ 1.52 g/t gold and 82 ppm cobalt from 130.25 m, 3 m @ 1.44 g/t gold from and 42 ppm cobalt, and 3 m @ 3.22 g/t cobalt and 142 ppm cobalt from 157.2 m

  • PAL0338 drilled a single intercept in a north-eastward step-out at Joki zone of gold-cobalt mineralisation returning;

    • PAL0338 - 1 m @ 4.03 g/t gold and 749 ppm cobalt from 148 metres

  • Drillhole PAL0360 from Raja, and drillholes PAL0336, PAL0337 and PAL0372 from Joki failed to intercept significant mineralisation.

Ms. Noora Ahola, Mawson Finland CEO, states: "We are pleased to report the latest results from our resource step-out drilling at the Raja and Joki zones of Rajapalot. Of particular note is the up-to 90 meter north-eastward extension of gold-cobalt mineralization at the Raja zone of mineralisation that we can expect will contribute additional gold-cobalt mineralised material to our resource inventory in this area. We are proud to inform our shareholders that we remain on-track with our resource expansion ambitions and will continue to report drill results in the coming weeks".

Detailed Results

The 10 drillholes reported here (Table 1) are from the Raja and Joki zones of mineralization at Rajapalot (drill holes PAL0336, PAL0337, PAL0338, PAL0347, PAL0349, PAL0353, PAL0355, PAL358, PAL0360 & PAL0372; see Figure 1, Figure 2 and Figure 3 in Schedule "A" hereto for collar and intercept locations, and Table 1, Table 2 and Table 3 in Schedule "A" hereto for collar and available assay data) represent 2,295 metres of drilling from the winter programme of a total of 11,376 metres in 38 drillholes. To date, a total of 25 holes for a total of 6,701 m has now been reported. Gold concentrations are reported here for intercepts that contained over 0.3 g/t Au over a minimum sample interval of 1 metre (lower-cut), while corresponding cobalt concentrations are reported from those same intervals where available (cobalt concentrations are available for all but drillhole PAL0347 of this news release, of which results from this hole will be reported in due course as the same become available). Composite assay values recording gold concentrations above the lower-cut limits are presented below in Table 2 in Schedule "A" hereto, and all raw sample intervals are presented in Table 3 in Schedule "A" hereto.

Drillholes PAL0355, PAL0353 and PAL0358 were drilled on the north-eastern margin of the Raja zone of gold-cobalt mineralization where they all intercepted multiple significant intercepts of mineralization between 40 meters (PAL0358) and 90 meters (PAL0355) to the north-east of their closest historical intercepts (refer to Figure 2 and Tables 2 & 3). Drillholes PAL0347, PAL0349 and PAL0360 where drilled on the south-west margin of the Raja zone of mineralization with multiple significant intercepts found between 30 meters (PAL0347) and 50 meters (PAL0349) to the south-west from their nearest historical intercepts, while PAL0360 did not intercept any significant mineralisation in an attempted 90 metre step-out to the south-west of Raja (refer to Figure 2, and Tables 2 & 3). While the host shear-structure was intercepted in hole PAL0360 from between 145 to 162 meters downhole, the host-succession was found to consist of sulfate-rich lithologies which are often found to inhibit gold-cobalt mineralisation at the Rajapalot property. Similarly, drillholes PAL0336, PAL0337 and PAL0372 intercepted unfavourable host lithologies in the projected up-dip position of mineralization at Joki and as such, failed to return significant mineralized intercepts from this zone of gold-cobalt mineralisation. Only PAL0338 returned a thin interval of mineralization at Joki, extending the known mineralization here to the north-east by some 30 meters (refer to Figure 3 and Tables 2 & 3).

Technical Background, Data Verification and Quality Assurance and Quality Control

Three diamond drill rigs from MK Core Drilling Oy, Comadev Oy and Arctic Drilling Company Oy, all with water recirculation and drill cuttings collection systems, were used in this drill program. Core diameter is NQ2 (50.7 mm). Core recoveries are excellent and average close to 100% in fresh rock. After photographing and logging in Mawson's Rovaniemi facilities, core intervals of between 0.5 to 2 metres are taken for sampling, then half-sawn by independent contractors the Geological Survey of Finland (GTK) in Rovaniemi, Palsatech Oy in Kemi and Geopool Oy in Sodankylä. The remaining half core is retained for verification and reference purposes. Analytical samples are transported by commercial transport from site to the independent contractor CRS Minlab Oy ("CRS") facility in Kempele, Finland. Samples are prepared and analyzed for gold using the PAL1000 technique which involves grinding the sample in steel pots with abrasive media in the presence of cyanide, followed by measuring the gold in solution with flame AAS equipment. Samples for multi-element analysis (including cobalt) are pulped at CRS, then transported by air to MSALABS in Vancouver, Canada and analyzed using four acid digest ICP-MS methods. All the foregoing laboratories are independent of the Company. The quality assurance and quality control program of Mawson consists of the systematic insertion of certified standards of known gold content, duplicate samples by quartering the core, and blanks placed within sample runs in interpreted mineralized rock. In addition, CRS inserts blanks and standards into the analytical process. In addition to the sample preparation and security measures described above, data verification procedures are well integrated into the Company's quality assurance and quality control program. Routine ongoing checking of all data is undertaken prior to being uploaded to the database. This will be followed by independent data verification audits at exploration milestones throughout the Rajapalot project's development. Dr. Fromhold (see "Qualified Person" below) has also reviewed the qualifications and analytical procedures of the above-mentioned laboratories, photographs of drill cores, and the PEA in connection with verifying the exploration information presented herein.

All maps have been created within the KKJ3/Finland Uniform Coordinate System (EPSG:2393). Tables 1-3 in Schedule "A" hereto provide collar and assay data. Due to the typically low angles of drill intercepts, the true thickness of the mineralized intervals are interpreted to be approximately 80-90% of the drilled thickness. Table 3 gives detailed individual assay data of all intervals reported in this press release. Intersections are reported with a lower cut of 0.3 g/t Au over 1 metre intervals, with composite data (Table 2 in Schedule "A" hereto) containing no more than 2 consecutive 1 m intervals of waste-rock (i.e., 1 m intervals with

At Rajapalot, all examples of gold-cobalt mineralisation are consistently located within highly-sheared and foliated wall-rocks adjacent to strongly hydrothermally altered, northwest to north dipping shear-zones. Mineralisation is typically encountered as disseminated to semi-massive sulfide lenses (predominantly pyrrhotite and lesser pyrite ± cobaltite), hosted within strongly deformed and altered, mafic volcanic and volcaniclasitic stratigraphy of the upper portions of the Paleoproterozoic-aged Kivalo Group of the Peräpohja Greenstone Belt. Prospects with high-grade gold and cobalt mineralisation at Rajapalot occur across a 3 km (east-west) by 2 km (north-south) area within the larger Rajapalot project area measuring 4 km by 4 km with multiple mineralized boulders, base-of-till (BOT). Gold-Cobalt mineralization at Rajapalot has been drilled to approximately 470 metres below surface at both South Palokas and Raja prospects, and mineralisation remains open at depth across the entire project.

Qualified Person

The technical and scientific information in this news release was reviewed, verified and approved by Dr. Thomas Fromhold, an employee of Fromhold Geoconsult AB, and Member of The Australian Institute of Geosciences (MAIG, Membership No. 8838). Dr. Fromhold is a "qualified person" as defined under NI 43-101. Dr. Fromhold is not considered independent of the Company under NI 43-101 as he is a consultant of the Company.

About Mawson Finland Limited

Mawson Finland Limited is an exploration stage mining development company engaged in the acquisition and exploration of precious and base metal properties in Finland. The Company is primarily focused on gold and cobalt. The Corporation currently holds a 100% interest in the Rajapalot Gold-Cobalt Project located in Finland. The Rajapalot Project represents approximately 5% of the 100-square kilometre Rompas-Rajapalot Property, which is wholly owned by Mawson and consists of 11 granted exploration permits for 10,204 hectares and 2 exploration permit applications and a reservation notification area for a combined total of 40,496 hectares. In Finland, all operations are carried out through the Company's fully owned subsidiary, Mawson Oy. Mawson maintains an active local presence of Finnish staff with close ties to the communities of Rajapalot.

Additional disclosure including the Company's financial statements, technical reports, news releases and other information can be obtained at mawsonfinland.com or on SEDAR+ at www.sedarplus.ca.

Media and Investor Relations Inquiries

Please contact: Neil MacRae Executive Chairman at neil@mawsonfinland.com or +1 (778) 999-4653, or Noora Ahola Chief Executive Officer at nahola@mawson.fi or +358 (505) 213-515.

Neither TSX Venture Exchange nor its Regulation Services Provider (as that term is defined in the policies of the TSX Venture Exchange) accepts responsibility for the adequacy or accuracy of this news release. No securities regulatory authority has reviewed or approved of the contents of this news release.

Forward-looking Information

This news release includes certain "forward-looking information" and "forward-looking statements" within the meaning of applicable securities laws (collectively, "forward-looking information") which are not comprised of historical facts. Forward-looking information includes, without limitation, estimates and statements that describe the Company's future plans, objectives or goals, including words to the effect that the Company or management expects a stated condition or result to occur. Forward-looking information may be identified by such terms as "believes", "anticipates", "expects", "estimates", "aims", "may", "could", "would", "will", "must" or "plan". Since forward-looking information is based on assumptions and address future events and conditions, by their very nature they involve inherent risks and uncertainties. Although these statements are based on information currently available to the Company, and management of the Company believes them to be reasonable based upon, among other information, the contents of the PEA and the exploration information disclosed in this news release, the Company provides no assurance that actual results will meet management's expectations. Risks, uncertainties and other factors involved with forward-looking information could cause actual events, results, performance, prospects and opportunities to differ materially from those expressed or implied by such forward-looking information. Forward-looking information in this news release includes, but is not limited to, the Company's objectives, goals or future plans, any expected receipt of additional assay results or other exploration results and the impact upon the Company thereof, any expected milestone independent data verification, the continuance of the Company's quality assurance and quality control program, potential mineralization whether peripheral to the existing Rajapalot resource or elsewhere, any anticipated disclosure of assay or other exploration results and the timing thereof, the estimation of mineral resources, exploration and mine development plans, including drilling, soil sampling, geophysical and geochemical work, any expected search for additional exploration targets and any results of such searches, potential acquisition by the Company of any property, the growth potential of the Rajapalot resource, all values, estimates and expectations drawn from or based upon the PEA, and estimates of market conditions. Factors that could cause actual results to differ materially from such forward-looking information include, but are not limited to: any change in industry or wider economic conditions which could cause the Company to adjust or cancel entirely its exploration plans, failure to identify mineral resources or any additional exploration targets, failure to convert estimated mineral resources to reserves, any failure to receive the results of completed assays or other exploration work, poor exploration results, the inability to complete a feasibility study which recommends a production decision, the preliminary and uncertain nature of the PEA, the preliminary nature of metallurgical test results, delays in obtaining or failures to obtain required governmental, environmental or other project approvals, political risks, uncertainties relating to the availability and costs of financing needed in the future, changes in equity markets, inflation, changes in exchange rates, fluctuations in commodity prices, delays in the development of projects, capital and operating costs varying significantly from estimates and the other risks involved in the mineral exploration and development industry, and those risks set out in the Company's public documents filed on SEDAR+. Although the Company believes that the assumptions and factors used in preparing the forward-looking information in this news release are reasonable, undue reliance should not be placed on such information, which only applies as of the date of this news release, and no assurance can be given that such events will occur in the disclosed time frames or at all. The Company disclaims any intention or obligation to update or revise any forward-looking information, whether as a result of new information, future events or otherwise, other than as required by law.

SCHEDULE "A" - TABLES AND FIGURES

Hole ID

Easting TM35

Northing TM35

Elevation (mRL)

Azimuth

Dip

Total Depth (m)

Prospect

PAL0335

3408345

7373507

174

50.4

-70.2

405.3

South Palokas

PAL0336

3410540

7372676

151

144.1

-70.1

131

Joki East

PAL0337

3410481

7372590

148

61.2

-70.9

125.3

Joki East

PAL0338

3410422

7372775

153

144.7

-55.4

190

Joki East

PAL0339

3408209

7373303

172

104.3

-44.8

150.1

South Palokas

PAL0340

3408347

7373505

174

118.4

-79.2

395.85

South Palokas

PAL0341

3408222

7373377

173

131

-44.4

136.7

South Palokas

PAL0342

3408715

7373997

175

115.7

-58.3

148.6

Palokas

PAL0343

3408627

7373991

175

88.9

-50.1

193

Palokas

PAL0344

3408300

7373532

174

52.3

-75.9

476.6

South Palokas

PAL0345

3408606

7374008

174

60.8

-71.9

278.1

Palokas

PAL0346

3408571

7373723

174

45

-65

184.4

Palokas

PAL0347

3408710

7372442

175

134.4

-72.1

273.6

Raja

PAL0348

3408306

7373530

175

119.1

-80.2

242.1

South Palokas

PAL0349

3408694

7372549

179

170

-80

341.85

Raja

PAL0350

3408402

7373671

174

75

-52

290.1

South Palokas

PAL0351

3408461

7373877

175

143

-69.5

334.5

Palokas

PAL0352

3408247

7373715

172

62.4

-66.4

474.1

South Palokas

PAL0353

3408850

7372504

176

160

-70

260.55

Raja

PAL0354

3408308

7373984

175

126.1

-50.9

466.9

Palokas

PAL0355

3408817

7372720

174

168

-77

428.9

Raja

PAL0356

3408138

7373637

174

80.4

-74.4

496.9

South Palokas

PAL0357

3408558

7374143

175

168.8

-82.9

445.6

Palokas

PAL0358

3408984

7372343

173

244.5

-79.1

178.75

Raja

PAL0359

3408138

7373933

172

150.9

-77.7

47.2

South Palokas

PAL0360

3408679

7372340

174

75

-80.4

251.7

Raja

PAL0361

3408088

7373643

173

51.1

-81.9

665.95

South Palokas

PAL0362

3408576

7373723

174

95.3

-47.6

258.55

Palokas

PAL0363

3407996

7373198

172

88.2

-55.3

338.8

Hut

PAL0364

3408346

7373509

174

65.7

-66.4

359.2

South Palokas

PAL0365

3408347

7373434

174

71

-70.1

304.4

South Palokas

PAL0366

3407996

7373198

172

88.6

-70.6

374.4

Hut

PAL0367

3408138

7373935

172

150.8

-79.2

785.3

South Palokas

PAL0368

3407940

7373069

173

137.5

-47.7

250.9

Hut

PAL0369

3408026

7373279

172

82.5

-44.6

253.5

South Palokas

PAL0370

3408231

7372823

182

124

-55.1

175.9

Terry's Hammer

PAL0371

3408231

7372823

182

172.6

-44.8

148

Terry's Hammer

PAL0372

3410436

7372555

149

106.7

-69.4

113.4

Joki East

Table 1: Drillhole collar locations (finish KKJ grid), with corresponding hole orientations (azimuth and dip), total depth, and prospect target. Holes reported in this news release are highlighted in bold text, and holes reported in prior releases highlighted in italics.

Hole ID

From (m)

To (m)

Drilled Thickness1 (m)

Gold (g/t)

Gold (gram-metres)

Cobalt ppm

PAL0336

-

-

-

-

-

-

PAL0337

-

-

-

-

-

-

PAL0338

148.00

149.00

1.00

4.03

4.03

748.5

PAL0347

184.30

190.10

5.80

2.17

12.60

TBA

PAL0347

201.55

204.55

3.00

2.43

7.30

TBA

PAL0347

209.00

217.60

8.60

1.90

16.35

TBA

PAL0349

294.50

298.10

3.60

1.74

6.27

1006.7

PAL0349

320.80

324.80

4.00

0.65

2.60

32.4

PAL0353

91.30

92.20

0.90

0.37

0.33

76.5

PAL0353

211.00

214.00

3.00

1.81

5.43

288.0

PAL0355

257.50

259.50

2.00

2.85

5.70

130.0

PAL0355

265.60

267.60

2.00

1.73

3.46

261.7

PAL0358

130.25

136.20

5.95

1.52

9.04

82.3

PAL0358

143.20

146.20

3.00

1.44

4.33

42.1

PAL0358

157.20

160.20

3.00

3.22

9.66

142.0

PAL0360

-

-

-

-

-

-

PAL0372

-

-

-

-

-

-

1True-thickness of the mineralized intervals are interpreted to be approximately 80-90% of the Drilled Thickness. True-thickness is not precisely known at this time.

Table 2: Composited gold and cobalt concentrations from the drillholes reported in this news release. Individual assay values are listed in Table 3 hereinbelow.

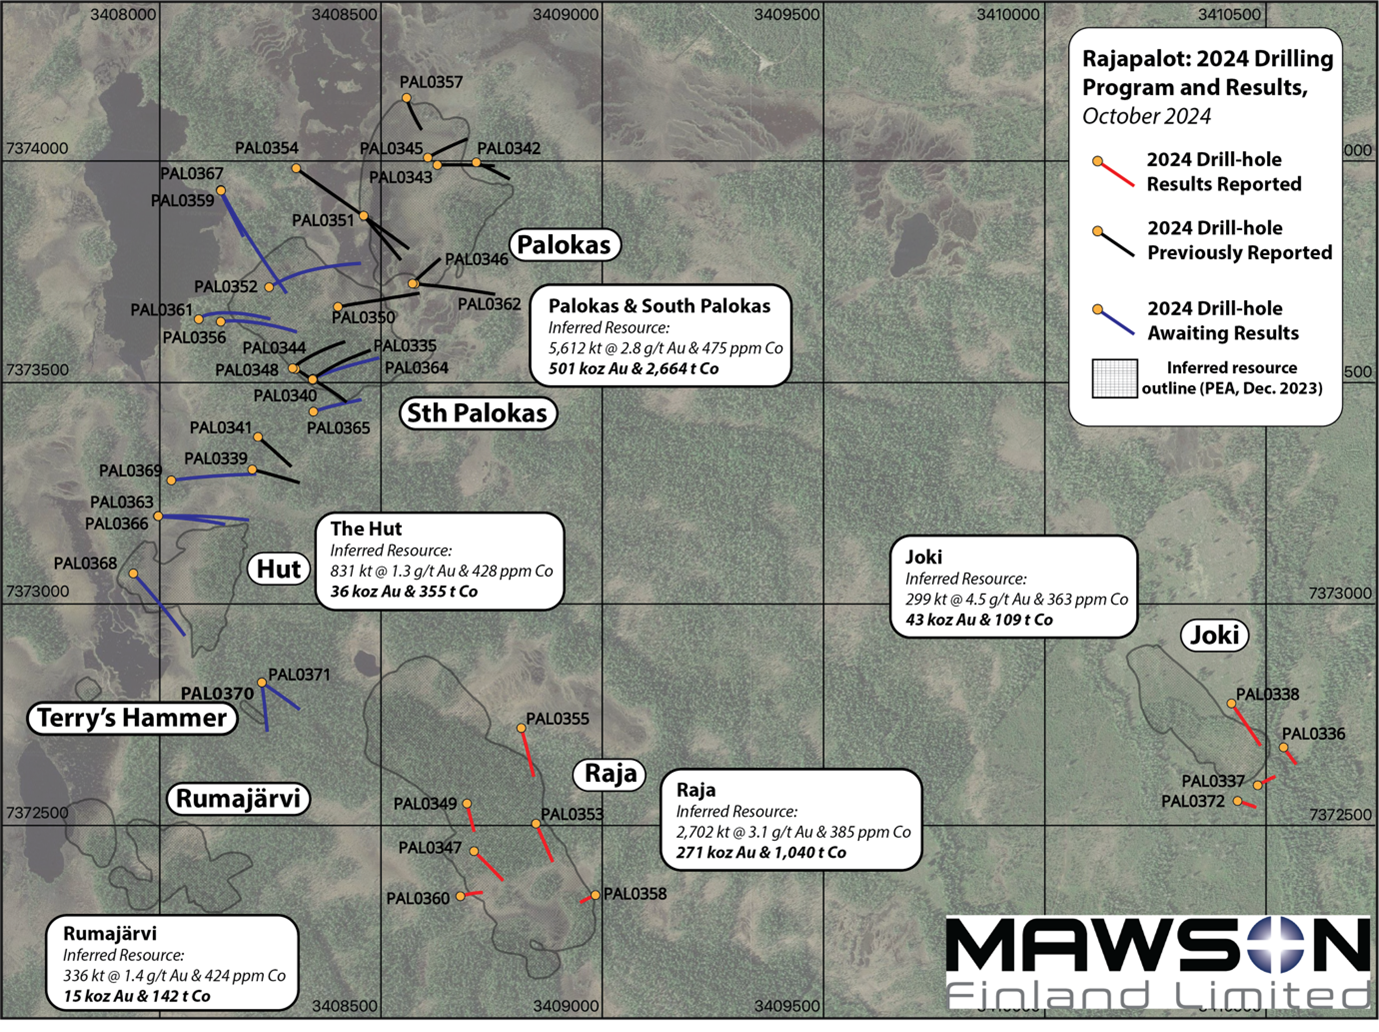
Figure 1: Locality map illustrating collar positions and drill-hole traces from Mawson's 2024 winter drilling campaign. Drillholes coloured red are those reported in this news release, while holes coloured black have been reported in previous releases, and blue coloured holes are awaiting results and publication.

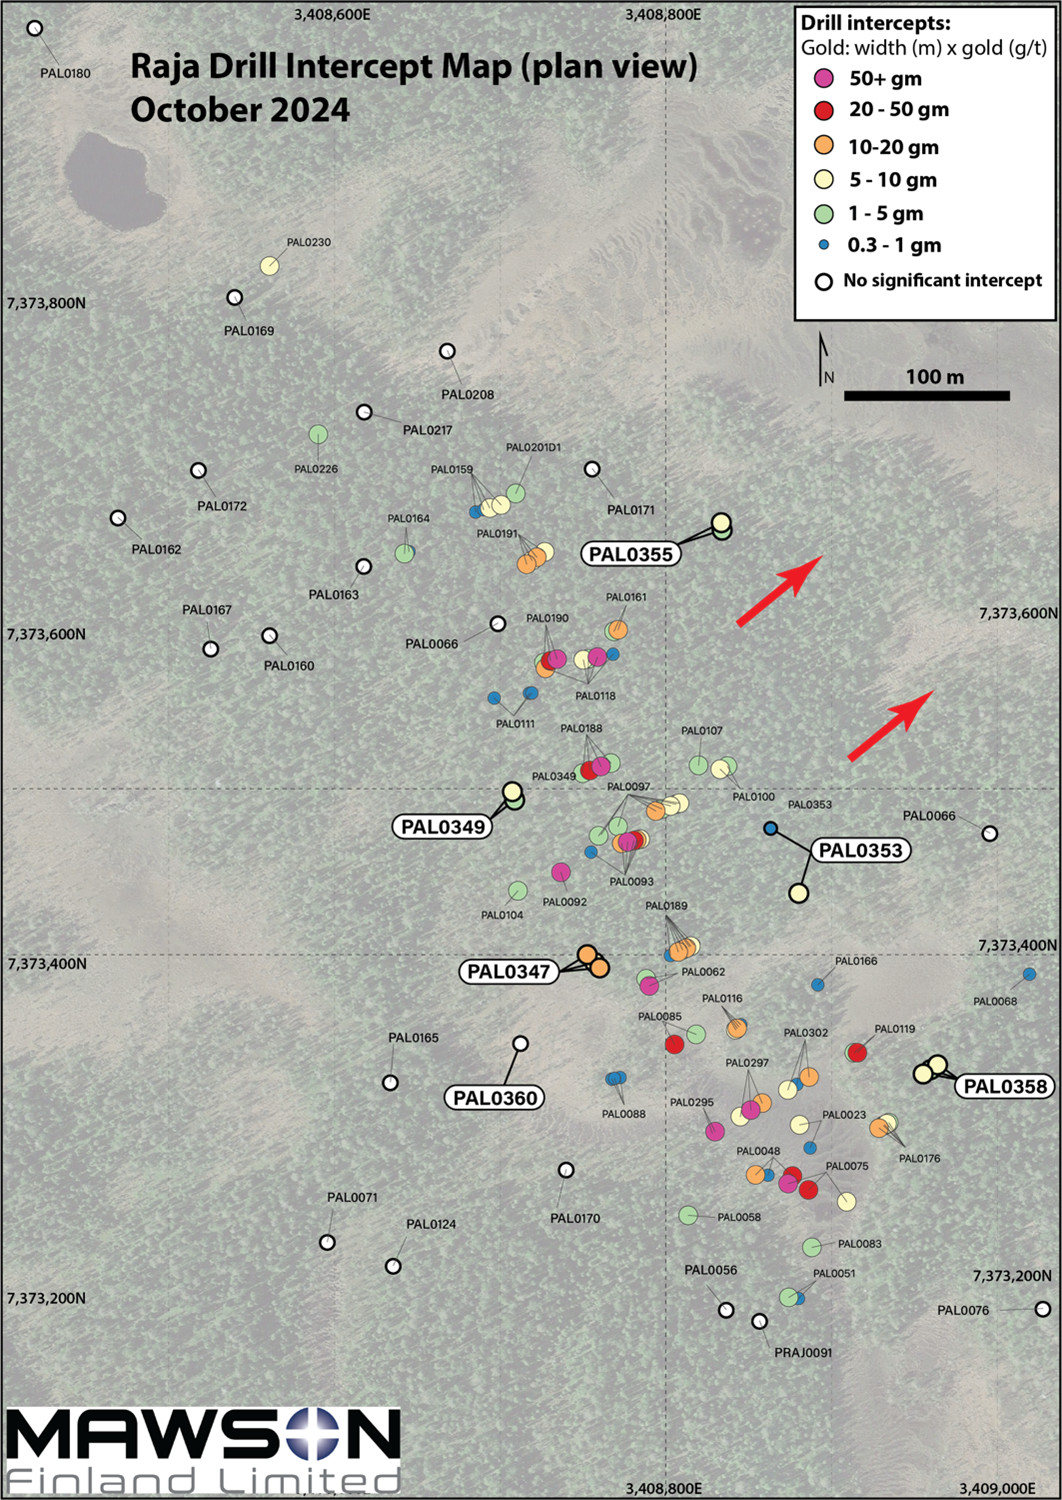
Figure 2: Plan-view illustration demonstrating both historical and 2024 drill intercepts in the Raja prospect. Intercepts from the 2024 drilling season are labelled in bold with their results represented in gold gram-metres (gold g/t x intercept thickness in metres). The small black rings indicate ‘no significant intercept'. Red arrows demonstrate the direction in which gold-cobalt mineralisation remains ‘open' and untested.

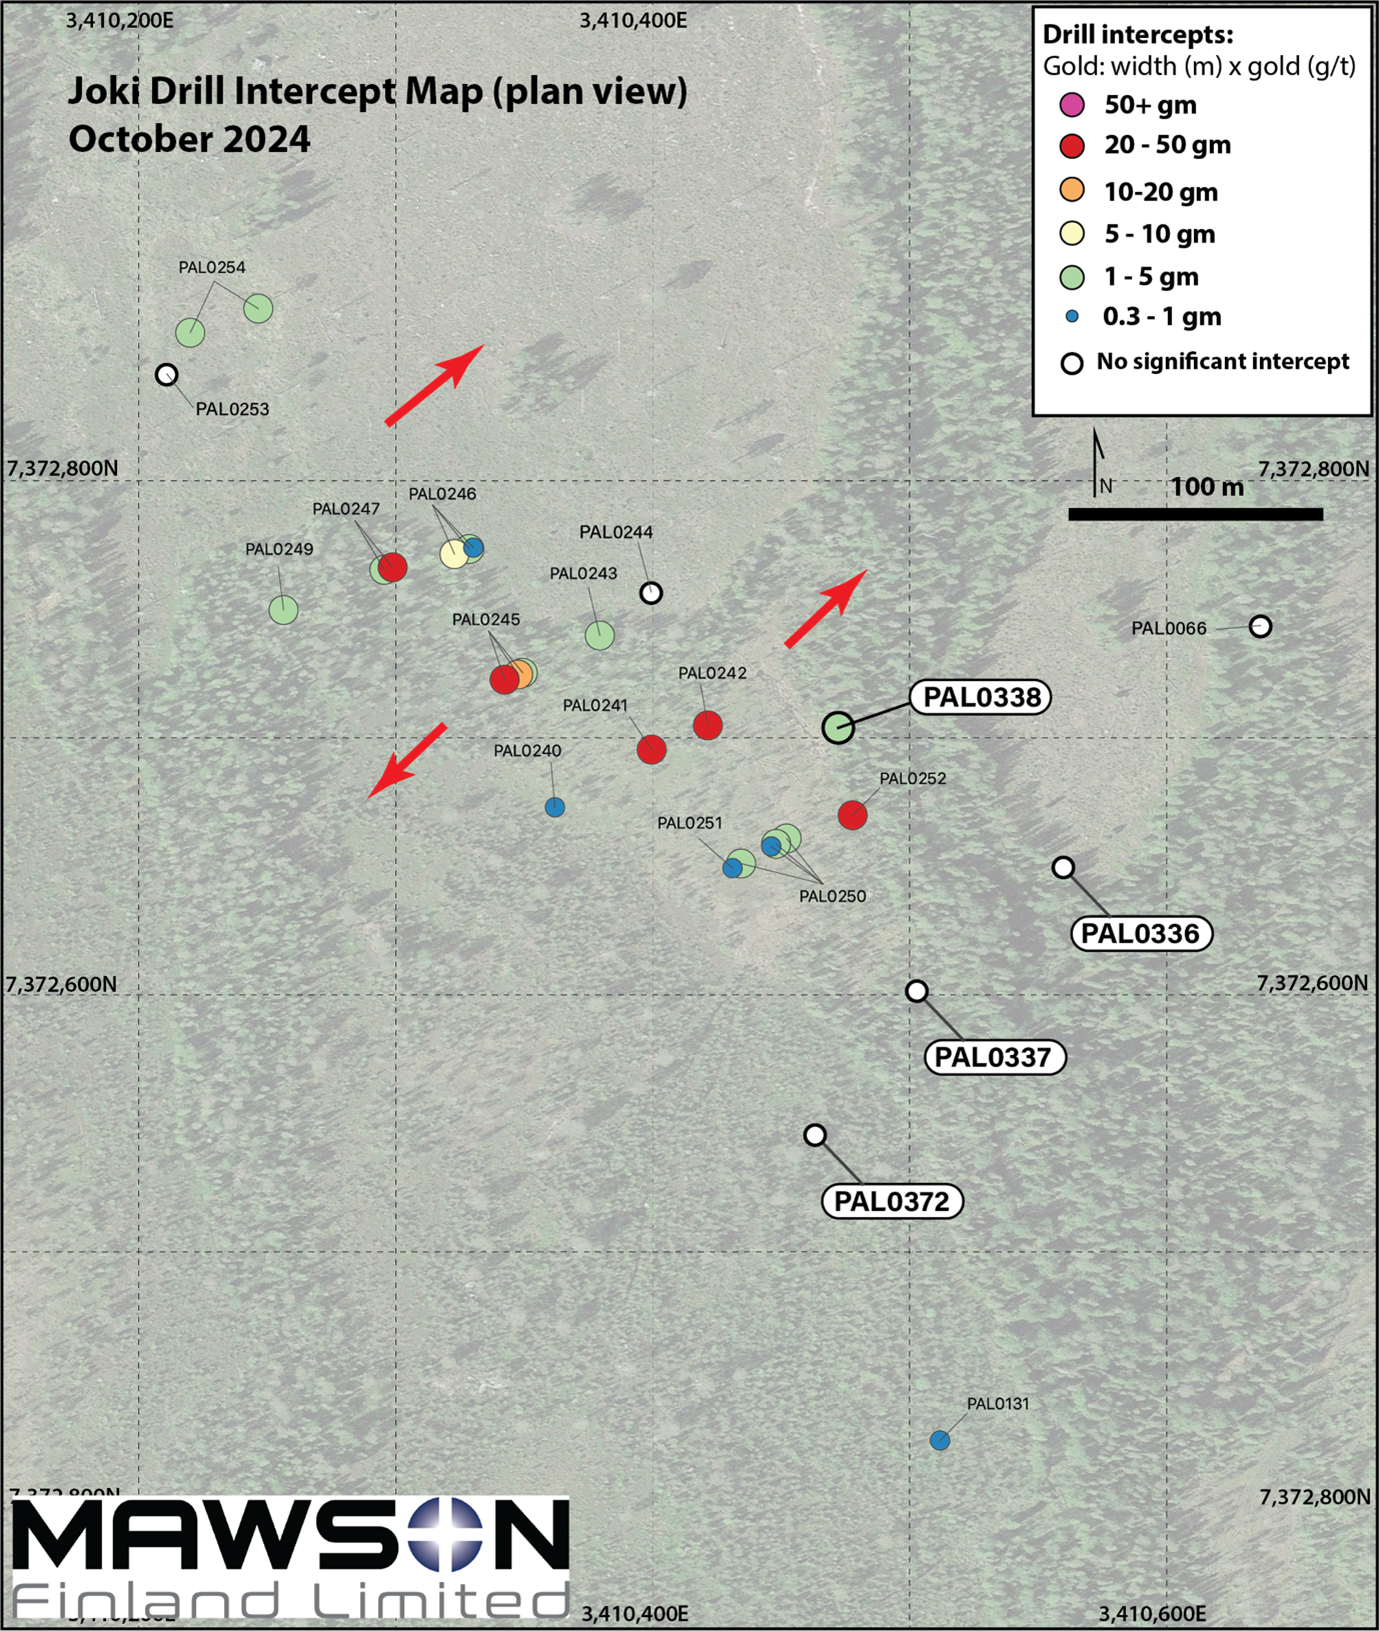
Figure 3: Plan-view illustration demonstrating both historical and 2024 drill intercepts in the Joki prospect. Intercepts from the 2024 drilling season are labelled in bold with their results represented in gold gram-metres (gold g/t x intercept thickness in metres). The small black rings indicate ‘no significant intercept'. Red arrows demonstrate the direction in which gold-cobalt mineralisation remains ‘open' and untested.

Hole ID

From (m)

To (m)

Length (m)

Gold g/t

Cobalt ppm

Mineralisation

PAL0338

148.00

149.00

1.00

4.03

748.5

Joki

PAL0347

184.30

185.30

1.00

1.44

TBA

Raja

185.30

186.30

1.00

4.26

TBA

Raja

186.30

187.10

0.80

0.12

TBA

Raja

187.10

188.10

1.00

2.73

TBA

Raja

188.10

189.10

1.00

2.77

TBA

Raja

189.10

190.10

1.00

1.31

TBA

Raja

201.55

202.55

1.00

0.99

TBA

Raja

202.55

203.55

1.00

1.28

TBA

Raja

203.55

204.55

1.00

5.03

TBA

Raja

209.00

210.00

1.00

1.15

TBA

Raja

210.00

211.00

1.00

0.82

TBA

Raja

211.00

212.05

1.05

1.14

TBA

Raja

212.05

212.80

0.75

0.05

TBA

Raja

212.80

214.15

1.35

0.60

TBA

Raja

214.15

215.20

1.05

0.55

TBA

Raja

215.20

216.40

1.20

7.09

TBA

Raja

216.40

217.60

1.20

2.71

TBA

Raja

PAL0349

294.50

295.50

1.00

1.17

655.0

Raja

295.50

296.50

1.00

0.86

941.2

Raja

296.50

297.50

1.00

3.90

1876.6

Raja

297.50

298.10

0.60

0.56

252.4

Raja

320.80

321.80

1.00

1.62

29.6

Raja

321.80

322.80

1.00

0.25

9.9

Raja

322.80

323.80

1.00

0.05

30.0

Raja

323.80

324.80

1.00

0.68

60.2

Raja

PAL0353

91.30

92.20

0.90

0.37

76.5

Raja

211.00

212.00

1.00

1.49

506.5

Raja

212.00

213.00

1.00

3.08

235.1

Raja

213.00

214.00

1.00

0.86

122.4

Raja

PAL0355

257.50

258.50

1.00

5.39

148.2

Raja

258.50

259.50

1.00

0.31

111.9

Raja

265.60

266.60

1.00

2.40

490.1

Raja

266.60

267.60

1.00

1.06

33.2

Raja

PAL0358

130.25

131.20

0.95

0.74

72.0

Raja

131.20

132.20

1.00

-0.05

117.9

Raja

132.20

133.20

1.00

0.22

124.6

Raja

133.20

134.20

1.00

1.48

73.6

Raja

134.20

135.20

1.00

5.60

90.7

Raja

135.20

136.20

1.00

1.09

14.8

Raja

143.20

144.20

1.00

0.81

50.1

Raja

144.20

145.20

1.00

3.14

40.3

Raja

145.20

146.20

1.00

0.38

35.9

Raja

157.20

158.20

1.00

3.35

68.6

Raja

158.20

159.20

1.00

5.91

341.3

Raja

159.20

160.20

1.00

0.40

16.2

Raja

Table 3: All gold and cobalt sample intervals with their corresponding gold and cobalt concentrations (where available), that are contained within above composited intervals, that meet the lower-cut criteria of 1 metre intervals at greater than 0.3 g/t gold.

SOURCE:Mawson Finland Limited


View the original press release on accesswire.com

News Provided by ACCESSWIRE via QuoteMedia

MFL:CC
The Conversation (0)
Mawson Finland Announces Closing of Brokered Private Placement for $6.0 Million

Mawson Finland Announces Closing of Brokered Private Placement for $6.0 Million

NOT FOR DISTRIBUTION TO UNITED STATES NEWSWIRE SERVICES OR FOR DISSEMINATION IN THE UNITED STATES

Mawson Finland Limited (" Mawson " or the " Company ") (TSX-V: MFL) is pleased to confirm the closing of its previously announced brokered private placement financing (the " Offering ") for gross proceeds of C$6,000,000.50 from the issuance and sale of 3,157,895 common shares of the Company (each, a " Share ") at a price of C$1.90 per Share (the " Offering Price ").

News Provided by GlobeNewswire via QuoteMedia

Keep reading...Show less
Mawson Finland Announces Upsize of Brokered Private Placement

Mawson Finland Announces Upsize of Brokered Private Placement

/NOT FOR DISTRIBUTION TO UNITED STATES NEWSWIRE SERVICES OR FOR DISSEMINATION IN THE UNITED STATES /

Mawson Finland Limited (" Mawson " or the " Company ") (TSXV: MFL) is pleased to announce that due to significant demand, it has entered into an agreement with Stifel Nicolaus Canada Inc. (the " Agent ") to upsize its previously announced "best efforts" private placement financing (the " Offering ") to up to C$6,000,000 in gross proceeds from the issuance and sale of up to 3,157,895 common shares of the Company (each, a " Share ") at a price of C$1.90 per Share (the " Offering Price ").

News Provided by Canada Newswire via QuoteMedia

Keep reading...Show less
Canadian Investment Regulatory Organization Trade Resumption - MFL

Canadian Investment Regulatory Organization Trade Resumption - MFL

Trading resumes in:

Company: Mawson Finland Limited

News Provided by PR Newswire via QuoteMedia

Keep reading...Show less
Mawson Finland Announces Brokered Private Placement for Up to C$5,000,000

Mawson Finland Announces Brokered Private Placement for Up to C$5,000,000

/NOT FOR DISTRIBUTION TO UNITED STATES NEWSWIRE SERVICES OR FOR DISSEMINATION IN THE UNITED STATES /

Mawson Finland Limited (" Mawson " or the " Company ") (TSXV: MFL) is pleased to announce that it has entered into an agreement with Stifel Nicolaus Canada Inc. (the " Agent ") to act as lead agent and sole bookrunner in connection with a "best efforts" private placement financing (the " Offering ") for aggregate gross proceeds of up to C$5,000,000 from the issuance and sale of up to 2,631,579 common shares of the Company (each, a " Share ") at a price of C$1.90 per Share (the " Offering Price ").

News Provided by Canada Newswire via QuoteMedia

Keep reading...Show less
Mawson Finland Begins 2025 Drill Program, Mobilizing Multiple Drill Rigs at Rajapalot

Mawson Finland Begins 2025 Drill Program, Mobilizing Multiple Drill Rigs at Rajapalot

Mawson Finland Limited ("Mawson" or the "Company") (TSX-V:MFL) is pleased to announce the mobilization of four diamond drill rigs, and a ‘base-of-till' (BOT) drilling rig to site, kicking-off the 2025 drill program at the Company's wholly-owned Rajapalot gold-cobalt project in Finland

Highlights:

News Provided by ACCESSWIRE via QuoteMedia

Keep reading...Show less
SAGA Metals Announces Non-Brokered Private Placement and Provides Corporate Update

SAGA Metals Announces Non-Brokered Private Placement and Provides Corporate Update

NOT FOR DISTRIBUTION TO U.S. NEWS WIRE SERVICES OR FOR DISSEMINATION IN THE UNITED STATES.

Saga Metals Corp. (the "Company" or "SAGA") (TSXV: SAGA) (OTCQB: SAGMF) (FSE: 20H) a North American exploration company focused on critical mineral discovery in Canada, is pleased to announce that it intends to complete a financing by way of a non-brokered private placement for aggregate gross proceeds of C$2,500,000 comprised of: (i) 2,500,000 flow-through common share units of the Company (the " FT Units ") at C$0.30 per FT Unit for gross proceeds of C$750,000, and, (ii) 7,000,000 hard dollar common share units of the Company (the " HD Units ", and together with the FT Units, the " Securities ") at C$0.25 per HD Unit for gross proceeds of C$1,750,000 (collectively, the " Offering ").

News Provided by GlobeNewswire via QuoteMedia

Keep reading...Show less
Aben Minerals Ltd. Receives Name Change Approval to Aben Gold Corp.

Aben Minerals Ltd. Receives Name Change Approval to Aben Gold Corp.

Aben Minerals Ltd. (TSX-V: ABM ) (OTCQB: ABNAF ) (Frankfurt: R26 ) ("Aben" or "the Company") announces change of name to Aben Gold Corp ., effective at market open on Tuesday, May 6, 2025, as approved by the TSX Venture Exchange.

News Provided by GlobeNewswire via QuoteMedia

Keep reading...Show less
International Lithium Announces Upsize and Extension of Private Placement

International Lithium Announces Upsize and Extension of Private Placement

International Lithium Corp. (TSXV: ILC) (OTCQB: ILHMF) (FSE: IAH) (the "Company" or "ILC") is pleased to announce that it is increasing the size of its non-brokered private placement financing (the "Offering") from $600,000 to $855,000 and extending the closing of the Offering to May 30, 2025. The Offering was originally announced on February 5, 2025. The upsized Offering is comprised of up to 57,000,000 common shares of the Company at a price of $0.015 per share for gross proceeds of up to $855,000.

On March 31, 2025, the Company closed the first tranche the Offering and issued 23,666,666 common shares at $0.015 per share for proceeds of $355,000. The proposed payments from the first tranche proceeds included $183,600 to pay the outstanding fees to non-arm's length creditors.

News Provided by Newsfile via QuoteMedia

Keep reading...Show less
American Salars Signs Letter Of Intent To Acquire Cauchari Lithium Brine Project, Argentina

American Salars Signs Letter Of Intent To Acquire Cauchari Lithium Brine Project, Argentina

(TheNewswire)

American Salars Lithium Inc

VANCOUVER, BC MAY 1 st 2025 TheNewswire - American Salars Lithium Inc. ("AMERICAN SALARS" OR THE "COMPANY") (CSE: USLI, OTC: USLIF, FWB: Z3P, WKN: A3E2NY ) announces it has signed a Letter of Intent ("LOI") with an arms length Vendor to acquire a 100% interest in the Cauchari Minas Ines 01 Lithium Salar Project ("Cauchari" or  "Project"), located o n the south end of the Cauchari Salt Lake, Department Los Andes in the Province of Salta, Argentina.

News Provided by TheNewsWire via QuoteMedia

Keep reading...Show less
Albemarle Reports First Quarter 2025 Results

Albemarle Reports First Quarter 2025 Results

Albemarle Corporation (NYSE: ALB), a global leader in providing essential elements for mobility, energy, connectivity and health, today announced its results for the first quarter ended March 31, 2025 .

Albemarle Corp. Logo. (PRNewsFoto/Albemarle Corporation)

First-Quarter   2025 and Recent Highlights
(Unless otherwise stated, all percentage changes represent year-over-year comparisons)

  • Net sales of $1.1 billion , with double-digit volume growth in Specialties (+11%) and record Energy Storage lithium salt production from the company's integrated conversion network
  • Net income of $41 million , or ($0.00) per diluted share attributable to common shareholders; adjusted diluted loss per share attributable to common shareholders of ($0.18)
  • Adjusted EBITDA of $267 million ; year-over-year gains in Specialties (+30%) and Ketjen (+76%)
  • Cash from operations of $545 million , which included a $350 million customer prepayment; excluding the prepayment, operating cash flow conversion (a) was 73%; line of sight to breakeven free cash flow assuming current lithium market pricing
  • Through April, achieved approximately 90% run-rate against midpoint $350 million cost and productivity improvement target; identified opportunities to reach high-end of the $300 to $400 million range
  • Maintaining full-year 2025 outlook considerations, including ranges based on recently observed lithium market price scenarios; ranges include the anticipated direct impact of tariffs announced as of April 29, 2025

(a)   Defined as Operating Cash Flow divided by Adj. EBITDA, which is a non-GAAP measure. See Non-GAAP Reconciliations for further details.

"Our business continues to perform in line with our outlook considerations, including first-quarter adjusted EBITDA of $267 million with strong year-over-year improvements in Specialties and Ketjen," said Kent Masters , Chairman and CEO. "We continue to focus on what we can control - taking decisive actions to reduce costs, optimize our lithium conversion network and increase efficiencies to preserve our long-term competitive position. While the full economic impact of the recently announced tariffs and other global trade actions is unclear, we benefit from our global footprint and the current exemptions for critical minerals; as a result, we are maintaining our full year 2025 outlook considerations."

First Quarter 2025 Results

In millions, except per share amounts

Q1 2025


Q1 2024


$ Change


% Change

Net sales

$    1,076.9


$    1,360.7


$      (283.9)


(20.9) %

Net income attributable to Albemarle Corporation

$         41.3


$           2.4


$         38.9


1,620.8 %

Adjusted EBITDA (a)

$       267.1


$       291.2


$       (24.1)


(8.3) %

Diluted loss per share attributable to common
shareholders

$       (0.00)


$       (0.08)


$         0.08


(100.0) %

Non-recurring and other unusual items (a)

(0.18)


0.34


Adjusted diluted (loss) earnings per share attributable
to common shareholders (a)(b)

$       (0.18)


$         0.26


$       (0.44)


(169.2) %


(a)    See Non-GAAP Reconciliations for further details.

(b)    Totals may not add due to rounding.

Net sales for the first quarter of 2025 were $1.1 billion compared to $1.4 billion for the prior-year quarter, a decline of 21% driven primarily by lower pricing in Energy Storage, partially offset by higher volumes in Specialties (+11%). Adjusted EBITDA of $267 million declined by $24 million from the prior-year quarter as lower net sales were mostly offset by lower average input costs and on-going cost reduction efforts. Net income attributable to Albemarle of $41 million increased year-over-year by $39 million .

The effective income tax rate for the first quarter of 2025 was 21.0% compared to 2.2% in the same period of 2024. On an adjusted basis, the effective income tax rates were (42.8)% and (12.4)% for the first quarters of 2025 and 2024, respectively, with the decrease primarily due to changes in geographic income mix and the impact of tax valuation allowances in Australia and China.

Energy Storage Results

In millions

Q1 2025


Q1 2024


$ Change


% Change

Net Sales

$           524.6


$           800.9


$          (276.3)


(34.5) %

Adjusted EBITDA

$           186.4


$           198.0


$           (11.6)


(5.9) %

Energy Storage net sales for the first quarter of 2025 were $525 million , a decrease of $276 million , or 35%, due to lower pricing (-34%). Volumes were flat as record production at our integrated conversion network offset reduced tolling volumes. Adjusted EBITDA of $186 million decreased $12 million , as lower net sales were mostly offset by lower average input costs and on-going cost reduction efforts.

Specialties Results

In millions

Q1 2025


Q1 2024


$ Change


% Change

Net Sales

$           321.0


$           316.1


$               4.9


1.6 %

Adjusted EBITDA

$             58.7


$             45.2


$             13.5


29.8 %

Specialties net sales for the first quarter of 2025 were $321 million , an increase of $5 million , or 2%, primarily due to higher volumes (+11%), which more than offset lower prices (-8%). Adjusted EBITDA of $59 million increased $13 million versus the year-ago quarter due to higher sales volumes and decreased manufacturing costs related to productivity initiatives.

Ketjen Results

In millions

Q1 2025


Q1 2024


$ Change


% Change

Net Sales

$           231.3


$           243.8


$           (12.5)


(5.1) %

Adjusted EBITDA

$             38.6


$             22.0


$             16.6


75.6 %

Ketjen net sales for the first quarter of 2025 were $231 million , down 5% compared to the prior-year quarter as higher prices (+4%) were more than offset by lower volumes (-8%), primarily due to the timing of sales, offset by favorable pricing due to product mix. Adjusted EBITDA of $39 million increased $17 million , driven by favorable product mix and higher equity income from joint ventures.

2025 Outlook Considerations

Total Corporate Outlook Considerations are Unchanged
The table below reflects expected outcomes for the total company based on recently observed lithium market price scenarios, unchanged from the prior quarter. Ranges include the anticipated direct impact of announced tariffs as of April 29, 2025 . Ranges are based on variation in sales volume and mix, including a projected increase in Energy Storage volumes of 0% to 10% in 2025 compared to 2024. All three scenarios assume flat market pricing flowing through Energy Storage's current contract book. Scenarios also assume spodumene pricing averages 10% of the lithium carbonate equivalent (LCE) price, while other costs are assumed to be constant.


Total Corporate FY 2025E

Including Energy Storage Scenarios

Observed market price case (a)

YE 2024

H1 2024 range

Q4 2023 average

Average lithium market price ($/kg LCE) (a)

~$9

$12-15

~$20

Net sales

$4.9 - $5.2 billion

$5.3 - $6.1 billion

$6.5 - $7.0 billion

Adjusted EBITDA (b)

$0.8 - $1.0 billion

$1.2 - $1.8 billion

$2.5 - $2.7 billion


(a)

Price represents blend of relevant market pricing including spot and regional indices for the periods referenced.

(b)

The company does not provide a reconciliation of forward-looking non-GAAP financial measures to the most directly comparable financial measures calculated and reported in accordance with GAAP, as the company is unable to estimate significant non-recurring or unusual items without unreasonable effort. See "Additional information regarding Non-GAAP Measures" for more information.

Energy Storage Market Price Scenarios


Energy Storage FY 2025E

Observed market price case (a)

YE 2024

H1 2024 range

Q4 2023 average

Average lithium market price ($/kg LCE) (a)

~$9

$12-15

~$20

Net sales

$2.5 - $2.6 billion

$2.9 - $3.5 billion

$4.2 - $4.5 billion

Adjusted EBITDA

$0.6 - $0.7 billion

$1.0 - $1.5 billion

$2.2 - $2.4 billion

Equity in net income of unconsolidated investments
(net of tax) (b)

$0.2 - $0.3 billion

$0.3 - $0.5 billion

$0.6 - $0.7 billion


(a)

Price represents blend of relevant market pricing including spot and regional indices for the periods referenced.

(b)

Included in adjusted EBITDA on a pre-tax basis.

Specialties and Ketjen Outlook Considerations
Specialties outlook reflects modest volume growth in key end markets led by pharma, automotive, and oilfield, partially offset by weakness in building and construction.

Ketjen outlook assumes favorable product revenue mix, lower input costs and the continuation of its turnaround plan execution.


Segment FY 2025E

Specialties net sales

$1.3 - $1.5 billion

Specialties adjusted EBITDA

$210 - $280 million

Ketjen net sales

$1.0 - $1.1 billion

Ketjen adjusted EBITDA

$120 - $150 million

Other Corporate Outlook Considerations
Albemarle expects its 2025 capital expenditures to be in the range of $700 million to $800 million , down more than 50% from $1.7 billion in 2024. This level of spending reflects a prioritization on sustaining existing assets and resources, with the remainder allocated to select growth projects and high-return, quick payback improvements.


Other Corporate FY 2025E

Capital expenditures

$700 - $800 million

Depreciation and amortization

$630 - $670 million

Adjusted effective tax rate (a)

(40%) - 25%

Corporate costs (b)

$70 - $100 million

Interest and financing expenses

$180 - $210 million

Weighted-average common shares outstanding (diluted)

118 million


(a)    Adjusted effective tax rate dependent on lithium market prices and geographic income mix

(b)    FY 2025E outlook includes FX impact year to date

Cash Flow and Capital Deployment
Cash from operations of $545 million increased $447 million compared to the prior-year period. A customer prepayment received in January and improved working capital more than offset lower adjusted EBITDA and reduced dividends received from equity investments. Capital expenditures of $183 million decreased by $397 million versus the prior-year period, reflecting the impact of decisions that stopped or slowed spending and the completion of capacity expansions in Energy Storage and Specialties.

Balance Sheet and Liquidity
As of March 31, 2025, Albemarle had estimated liquidity of approximately $3.1 billion , including $1.5 billion of cash and cash equivalents, $1.5 billion available under its revolver and $106 million available under other credit lines. Total debt was $3.5 billion , representing a debt covenant net debt to adjusted EBITDA ratio of approximately 2.4 times.

Earnings Call

Date:

Thurs., May 1, 2025

Time:

8:00 AM Eastern time

Dial-in (U.S.):

1-800-590-8290

Dial-in (International):

1-240-690-8800

Conference ID:

ALBQ1

The company's earnings presentation and supporting material are available on Albemarle's website at https://investors.albemarle.com .

About Albemarle
Albemarle Corporation (NYSE: ALB) is a global leader in transforming essential resources into critical ingredients for mobility, energy, connectivity, and health. We partner to pioneer new ways to move, power, connect and protect with people and planet in mind. A reliable and high-quality global supply of lithium and bromine allow us to deliver advanced solutions for our customers. Learn more about how the people of Albemarle are enabling a more resilient world at albemarle.com and on X (formerly Twitter) @AlbemarleCorp.

Albemarle regularly posts information to www.albemarle.com , including notification of events, news, financial performance, investor presentations and webcasts, non-GAAP reconciliations, Securities and Exchange Commission ("SEC") filings and other information regarding the company, its businesses and the markets it serves.

Forward-Looking Statements
This press release contains statements concerning our expectations, anticipations and beliefs regarding the future, which constitute "forward-looking statements" within the meaning of the Private Securities Litigation Reform Act of 1995. These forward-looking statements, which are based on assumptions that we have made as of the date hereof and are subject to known and unknown risks and uncertainties, often contain words such as "anticipate," "believe," "estimate," "expect," "guidance," "intend," "may," "outlook," "scenario," "should," "would," and "will". Forward-looking statements may include statements regarding: our 2025 company and segment outlooks, including expected market pricing of lithium and spodumene and other underlying assumptions and outlook considerations; expected capital expenditure amounts and the corresponding impact on cash flow; expected impact of tariffs and other trade restrictions; market pricing of lithium carbonate equivalent and spodumene; plans and expectations regarding other projects and activities, cost reductions and accounting charges, and all other information relating to matters that are not historical facts. Factors that could cause Albemarle's actual results to differ materially from the outlook expressed or implied in any forward-looking statement include: changes in economic and business conditions; changes in trade policies and tariffs; financial and operating performance of customers; timing and magnitude of customer orders; fluctuations in lithium market prices; production volume shortfalls; increased competition; changes in product demand; availability and cost of raw materials and energy; technological change and development; fluctuations in foreign currencies; changes in laws and government regulation; regulatory actions, proceedings, claims or litigation; cyber-security breaches, terrorist attacks, industrial accidents or natural disasters; geopolitical conflicts and political unrest; trade policies and tariffs; changes in inflation or interest rates; volatility in the debt and equity markets; acquisition and divestiture transactions; timing and success of projects; performance of Albemarle's partners in joint ventures and other projects; changes in credit ratings; and the other factors detailed from time to time in the reports Albemarle files with the SEC, including those described under "Risk Factors" in Albemarle's most recent Annual Report on Form 10-K and any subsequently filed Quarterly Reports on Form 10-Q, which are filed with the SEC and available on the investor section of Albemarle's website (investors.albemarle.com) and on the SEC's website at www.sec.gov . These forward-looking statements speak only as of the date of this press release. Albemarle assumes no obligation to provide any revisions to any forward-looking statements should circumstances change, except as otherwise required by securities and other applicable laws.

Albemarle Corporation and Subsidiaries
Consolidated Statements of Income
(In Thousands Except Per Share Amounts) (Unaudited)


Three Months Ended


March 31,


2025


2024

Net sales

$ 1,076,881


$ 1,360,736

Cost of goods sold

920,582


1,321,798

Gross profit

156,299


38,938

Selling, general and administrative expenses

123,502


161,376

Restructuring charges and asset write-offs

(1,063)


33,536

Research and development expenses

14,099


23,532

Operating profit (loss)

19,761


(179,506)

Interest and financing expenses

(48,977)


(37,969)

Other income, net

10,250


49,901

Loss before income taxes and equity in net income of unconsolidated investments

(18,966)


(167,574)

Income tax benefit

(3,978)


(3,721)

Loss before equity in net income of unconsolidated investments

(14,988)


(163,853)

Equity in net income of unconsolidated investments (net of tax)

64,286


180,500

Net income

49,298


16,647

Net income attributable to noncontrolling interests

(7,950)


(14,199)

Net income attributable to Albemarle Corporation

41,348


2,448

Mandatory convertible preferred stock dividends

(41,688)


(11,584)

Net loss attributable to Albemarle Corporation common shareholders

$         (340)


$      (9,136)

Basic loss per share attributable to common shareholders

$        (0.00)


$        (0.08)

Diluted loss per share attributable to common shareholders

$        (0.00)


$        (0.08)


Weighted-average common shares outstanding – basic

117,603


117,451

Weighted-average common shares outstanding – diluted

117,603


117,451

Albemarle Corporation and Subsidiaries
Condensed Consolidated Balance Sheets
(In Thousands) (Unaudited)


March 31,


December 31,


2025


2024

ASSETS


Current assets:


Cash and cash equivalents

$        1,518,511


$        1,192,230

Trade accounts receivable

670,775


742,201

Other accounts receivable

137,080


238,384

Inventories

1,656,365


1,502,531

Other current assets

124,551


166,916

Total current assets

4,107,282


3,842,262

Property, plant and equipment

12,660,018


12,523,368

Less accumulated depreciation and amortization

3,356,979


3,191,898

Net property, plant and equipment

9,303,039


9,331,470

Investments

1,124,777


1,117,739

Other assets

628,277


504,711

Goodwill

1,606,144


1,582,714

Other intangibles, net of amortization

229,739


230,753

Total assets

$      16,999,258


$      16,609,649

LIABILITIES AND EQUITY


Current liabilities:


Accounts payable to third parties

$           778,658


$           793,455

Accounts payable to related parties

139,296


150,432

Accrued expenses

379,871


467,997

Current portion of long-term debt

410,477


398,023

Dividends payable

61,312


61,282

Income taxes payable

174,779


95,275

Total current liabilities

1,944,393


1,966,464

Long-term debt

3,128,655


3,118,142

Postretirement benefits

31,908


31,930

Pension benefits

115,846


116,192

Other noncurrent liabilities

1,125,943


819,204

Deferred income taxes

378,171


358,029

Commitments and contingencies


Equity:


Albemarle Corporation shareholders' equity:


Common stock

1,177


1,176

Mandatory convertible preferred stock

2,235,105


2,235,105

Additional paid-in capital

2,991,389


2,985,606

Accumulated other comprehensive loss

(633,136)


(742,062)

Retained earnings

5,433,704


5,481,692

Total Albemarle Corporation shareholders' equity

10,028,239


9,961,517

Noncontrolling interests

246,103


238,171

Total equity

10,274,342


10,199,688

Total liabilities and equity

$      16,999,258


$      16,609,649

Albemarle Corporation and Subsidiaries
Selected Consolidated Cash Flow Data
(In Thousands) (Unaudited)


Three Months Ended

March 31,


2025


2024

Cash and cash equivalents at beginning of year

$   1,192,230


$      889,900

Cash flows from operating activities:


Net income

49,298


16,647

Adjustments to reconcile net income to cash flows from operating activities:


Depreciation and amortization

161,754


123,751

Stock-based compensation and other

6,966


9,317

Equity in net income of unconsolidated investments (net of tax)

(64,286)


(180,500)

Dividends received from unconsolidated investments and nonmarketable
securities

60,335


50,756

Pension and postretirement expense

1,696


1,273

Pension and postretirement contributions

(5,196)


(4,824)

Realized loss on investments in marketable securities

—


33,746

Unrealized loss on investments in marketable securities

5,331


6,737

Deferred income taxes

(5,669)


116,447

Working capital changes

(21,992)


(52,320)

Noncurrent liability changes and other, net

357,146


(23,076)

Net cash provided by operating activities

545,383


97,954

Cash flows from investing activities:


Capital expenditures

(182,624)


(579,322)

Sales of marketable securities, net

3,381


84,893

Investments in equity investments and nonmarketable securities

(60)


(74)

Net cash used in investing activities

(179,303)


(494,503)

Cash flows from financing activities:


Proceeds from issuance of mandatory convertible preferred stock

—


2,236,750

Repayments of long-term debt and credit agreements

(9,615)


(29,019)

Proceeds from borrowings of long-term debt and credit agreements

—


29,019

Other debt repayments, net

(1,195)


(620,753)

Dividends paid to common shareholders

(47,607)


(46,908)

Dividends paid to mandatory convertible preferred shareholders

(41,688)


—

Dividends paid to noncontrolling interests

(18,169)


—

Proceeds from exercise of stock options

1,186


86

Withholding taxes paid on stock-based compensation award distributions

(2,904)


(10,619)

Other

(14)


(1,256)

Net cash (used in) provided by financing activities

(120,006)


1,557,300

Net effect of foreign exchange on cash and cash equivalents

80,207


5,162

Increase in cash and cash equivalents

326,281


1,165,913

Cash and cash equivalents at end of period

$   1,518,511


$   2,055,813

Albemarle Corporation and Subsidiaries
Consolidated Summary of Segment Results
(In Thousands) (Unaudited)


Three Months Ended


March 31,


2025


2024

Net sales:


Energy Storage

$   524,565


$   800,898

Specialties

321,014


316,065

Ketjen

231,302


243,773

Total net sales

$ 1,076,881


$ 1,360,736


Adjusted EBITDA:


Energy Storage

$   186,355


$   197,996

Specialties

58,666


45,181

Ketjen

38,588


21,979

Total segment adjusted EBITDA

283,609


265,156

Corporate

(16,465)


26,080

Total adjusted EBITDA

$   267,144


$   291,236

See accompanying non-GAAP reconciliations below.

Additional Information regarding Non-GAAP Measures

It should be noted that adjusted net income attributable to Albemarle Corporation, adjusted net (loss) income attributable to Albemarle Corporation common shareholders, adjusted diluted loss per share attributable to common shareholders, non-operating pension and other post-employment benefit ("OPEB") items per diluted share, non-recurring and other unusual items per diluted share, adjusted effective income tax rates, EBITDA, adjusted EBITDA (on a consolidated basis), EBITDA margin and adjusted EBITDA margin, and operating cash flow conversion are financial measures that are not required by, or presented in accordance with, accounting principles generally accepted in the United States , or GAAP. These non-GAAP measures should not be considered as alternatives to Net income attributable to Albemarle Corporation ("earnings") or other comparable measures calculated and reported in accordance with GAAP. These measures are presented here to provide additional useful measurements to review the company's operations, provide transparency to investors and enable period-to-period comparability of financial performance. The company's chief operating decision maker uses these measures to assess the ongoing performance of the company and its segments, as well as for business and enterprise planning purposes.

A description of other non-GAAP financial measures that Albemarle uses to evaluate its operations and financial performance, and reconciliation of these non-GAAP financial measures to the most directly comparable financial measures calculated and reported in accordance with GAAP can be found on the following pages of this press release, which is also is available on Albemarle's website at https://investors.albemarle.com . The company does not provide a reconciliation of forward-looking non-GAAP financial measures to the most directly comparable financial measures calculated and reported in accordance with GAAP, as the company is unable to estimate significant non-recurring or unusual items without unreasonable effort. The amounts and timing of these items are uncertain and could be material to the company's results calculated in accordance with GAAP.

Albemarle Corporation AND SUBSIDIARIES

Non-GAAP Reconciliations

(Unaudited)

See below for a reconciliation of adjusted net income attributable to Albemarle Corporation, adjusted net (loss) income attributable to Albemarle Corporation common shareholders, EBITDA and adjusted EBITDA (on a consolidated basis), which are non-GAAP financial measures, to Net income attributable to Albemarle Corporation, the most directly comparable financial measure calculated and reported in accordance with GAAP. Adjusted net (loss) income attributable to Albemarle Corporation common shareholders is defined as net income (loss) after mandatory convertible preferred stock dividends, but before the non-recurring, other unusual and non-operating pension and other post-employment benefit (OPEB) items as listed below. The non-recurring and unusual items may include acquisition and integration related costs, gains or losses on sales of businesses, restructuring charges, facility divestiture charges, certain litigation and arbitration costs and charges, and other significant non-recurring items. EBITDA is defined as net income attributable to Albemarle Corporation before interest and financing expenses, income tax expense, and depreciation and amortization. Adjusted EBITDA is defined as EBITDA plus or minus the proportionate share of Windfield Holdings income tax expense, non-recurring, other unusual and non-operating pension and OPEB items as listed below.


Three Months Ended


March 31,


2025


2024

In thousands, except percentages and per share amounts

$


% of
net
sales


$


% of
net
sales

Net income attributable to Albemarle Corporation

$41,348


$    2,448


Add back:


Non-operating pension and OPEB items (net of tax)

125


(351)


Non-recurring and other unusual items (net of tax)

(21,200)


40,044


Adjusted net income attributable to Albemarle Corporation

20,273


42,141


Mandatory convertible preferred stock dividends

(41,688)


(11,584)


Adjusted net (loss) income attributable to Albemarle Corporation common shareholders

$ (21,415)


$  30,557


Adjusted diluted (loss) earnings per share attributable to common shareholders

$     (0.18)


$      0.26


Adjusted weighted-average common shares outstanding – diluted

117,603


117,451


Net income attributable to Albemarle Corporation

$41,348


3.8 %


$    2,448


0.2 %

Add back:


Interest and financing expenses

48,977


4.5 %


37,969


2.8 %

Income tax (benefit)

(3,978)


(0.4) %


(3,721)


(0.3) %

Depreciation and amortization

161,754


15.0 %


123,751


9.1 %

EBITDA

248,101


23.0 %


160,447


11.8 %

Proportionate share of Windfield income tax expense

25,326


2.4 %


73,689


5.4 %

Non-operating pension and OPEB items

275


— %


(325)


— %

Non-recurring and other unusual items

(6,558)


(0.6) %


57,425


4.2 %

Adjusted EBITDA

$ 267,144


24.8 %


$ 291,236


21.4 %


Net sales

$  1,076,881


$  1,360,736


Non-operating pension and OPEB items, consisting of mark-to-market actuarial gains/losses, settlements/curtailments, interest cost and expected return on assets, are not allocated to Albemarle's operating segments and are included in the Corporate category. In addition, the company believes that these components of pension cost are mainly driven by market performance, and the company manages these separately from the operational performance of the company's businesses. In accordance with GAAP, these non-operating pension and OPEB items are included in Other income, net. Non-operating pension and OPEB items were as follows (in thousands):


Three Months Ended


March 31,


2025


2024

Interest cost

$       8,810


$       8,505

Expected return on assets

(8,535)


(8,830)

Total

$          275


$        (325)

In addition to the non-operating pension and OPEB items disclosed above, the company has identified certain other items and excluded them from Albemarle's adjusted net income calculation for the periods presented. A listing of these items, as well as a detailed description of each follows below (per diluted share):


Three Months Ended


March 31,


2025


2024

Restructuring charges and asset write-offs (1)

$       (0.02)


$         0.23

Acquisition and integration related costs (2)

0.01


0.01

Loss in fair value of public equity securities (3)

0.03


0.35

Other (4)

(0.08)


(0.15)

Tax related items (5)

(0.12)


(0.10)

Total non-recurring and other unusual items

$       (0.18)


$         0.34


(1)

The Company took several actions during 2024 as part of a broader effort that will focus on preserving its world-class resource advantages, optimizing its global conversion network, improving the Company's cost competitiveness and efficiency, reducing capital intensity and enhancing the Company's financial flexibility. Those actions included stopping construction of Kemerton Trains 3 and 4, as well as certain other capital projects, placing Kemerton Train 2 in care and maintenance and transitioning the Company's operating structure to a fully integrated functional model (excluding Ketjen). Subsequently, in early 2025, the Company announced its additional decision to put the Chengdu, China conversion plant into care and maintenance by mid-year 2025. As a result, the Company recorded restructuring and asset write-off charges of ($1.1 million) in Restructuring charges and asset write-offs and losses of $0.2 million in Other income, net for the three months ended March 31, 2025. Due to the impact of valuation allowances, this resulted in total after-tax gains of $2.1 million, or $0.02 per share for the three months ended March 31, 2025. During the three months ended March 31, 2024, the Company recorded restructuring and asset write-off charges of $33.5 million in Restructuring charges and asset write-offs and losses of $2.7 million in Other income, net. In total, this resulted in after-tax losses of ($27.0 million after income taxes, or $0.23 per share) for the three months ended March 31, 2024.


(2)

Costs related to the acquisition, integration and divestitures for various significant projects, recorded in Selling, general and administrative expenses for the three months ended March 31, 2025 and 2024 were $1.4 million and $1.9 million ($1.1 million and $1.5 million after income taxes, or $0.01 and $0.01 per share), respectively.


(3)

Loss of $5.0 million ($3.9 million after income taxes, or $0.03 per share) recorded in Other income, net resulting from the net change in fair value of investments in public equity securities for the three months ended March 31, 2025. Losses of $33.7 million and $9.4 million recorded in Other income, net resulting from the sale of investments in public equity securities and the change in fair value of investments in public equity securities, respectively, for the three months ended March 31, 2024 ($41.1 million after income taxes, or $0.35 per share).


(4)

Other adjustments for the three months ended March 31, 2025 included amounts recorded in:


•

Selling, general and administrative expenses - $3.2 million of gains from the sale of assets at a site not part of our operations, partially offset by $0.6 million of expenses related to certain historical legal matters.

•

Other income, net - $9.8 million of income from PIK dividends of preferred equity in a Grace subsidiary and a $1.9 million gain primarily resulting from the adjustment of indemnification related to previously disposed businesses, partially offset by $1.9 million of charges for asset retirement obligations at a site not part of our operations.

After income taxes, these net gains totaled $9.8 million, or $0.08 per share.


Other adjustments for the three months ended March 31, 2024 included amounts recorded in:

•

Cost of goods sold - $1.4 million of expenses related to non-routine labor and compensation related costs that are outside normal compensation arrangements.

•

Selling, general and administrative expenses - $0.1 million of expenses related to certain legal costs.

•

Other income, net - $17.3 million gain primarily from the sale of assets at a site not part of our operations, an $8.7 million gain from PIK dividends of preferred equity in a Grace subsidiary and a $2.4 million gain primarily resulting from the adjustment of indemnification related to a previously disposed business, partially offset by $2.9 million of charges for asset retirement obligations at a site not part of our operations.


After income taxes, these net gains totaled $17.3 million, or $0.15 per share.


(5)

Included in Income tax benefit for the three months ended March 31, 2025 are discrete net tax benefits of $14.2 million, or $0.12 per share, primarily related to the reduction in a foreign tax reserve and excess tax benefits realized from stock-based compensation arrangements.


Included in Income tax benefit for the three months ended March 31, 2024 are discrete net tax benefits of $12.3 million, or $0.10 per share primarily related to the reduction in a foreign tax reserve and excess tax benefits realized from stock-based compensation arrangements.

See below for a reconciliation of the adjusted effective income tax rate, the non-GAAP financial measure, to the effective income tax rate, the most directly comparable financial measure calculated and reporting in accordance with GAAP (in thousands, except percentages).


(Loss) income
before income taxes
and equity in net
income of
unconsolidated
investments


Income tax (benefit)
expense


Effective income tax
rate

Three months ended March 31, 2025


As reported

$                     (18,966)


$                       (3,978)


21.0 %

Non-recurring, other unusual and non-operating pension and OPEB
items

(6,283)


14,792


As adjusted

$                     (25,249)


$                      10,814


(42.8) %


Three months ended March 31, 2024


As reported

$                   (167,574)


$                       (3,721)


2.2 %

Non-recurring, other unusual and non-operating pension and OPEB
items

57,100


17,407


As adjusted

$                   (110,474)


$                      13,686


(12.4) %

See below for the calculation of operating cash flow conversion, which the Company defines as Net cash provided by operating activities from the statement of cash flows divided by adjusted EBITDA, which is a non-GAAP measure. A reconciliation of adjusted EBITDA, the non-GAAP financial measure, from net income attributable to Albemarle Corporation, the most directly comparable financial measure calculated and reporting in accordance with GAAP, is provided in the above tables (in thousands, except percentages).


Three Months Ended


March 31, 2025

Net cash provided by operating activities

$                545,383

Less: Customer prepayment

350,000

Net cash provided by operating activities excluding customer prepayment

$                195,383


Adjusted EBITDA

$                267,144


Operating cash flow conversion

204 %

Operating cash flow conversion excluding customer prepayment

73 %

Contact:


invest@albemarle.com

1.980.299.5700

Cision View original content to download multimedia: https://www.prnewswire.com/news-releases/albemarle-reports-first-quarter-2025-results-302442938.html

SOURCE Albemarle Corporation

News Provided by PR Newswire via QuoteMedia

Keep reading...Show less

Latest Press Releases

Related News

×