The Conversation (0)

Expansionary Drilling at Los Gatos Intersects Significant Silver and Base Metal Mineralization
First Majestic Silver Corp. (NYSE: AG) (TSX: AG) (FSE: FMV) (the "Company" or "First Majestic") is pleased to announce positive drilling results from its 20242025 exploration programs at the Los Gatos Silver Mine in Chihuahua, Mexico. The drilling programs were designed to expand silver, zinc, lead, copper and gold mineralization in the South-East Deeps, Central Deeps and North-West Deeps zones. None of the reported drill results were included in the Company's year-end Mineral Reserve and Mineral Resource Estimates.
"Following the acquisition of Gatos Silver, the exploration program has advanced smoothly alongside all other aspects of the operation," stated Keith Neumeyer, President & CEO of First Majestic. "A major driver for acquiring Los Gatos was the district's significant exploration upside, and the latest drilling results reinforce that potential. Ongoing drilling continues to expand mineralization across multiple zones, supporting our expectation for meaningful Mineral Resource growth at Los Gatos."
KEY DRILLING HIGHLIGHTS:
Ongoing exploration drilling intersected significant silver and base metals mineralization across all three zones tested: South-East Deeps, Central Deeps and North-West Deeps. A selection of significant drill hole intercepts from these zones (Figure 1) are highlighted in Tables 1 and 2 below:
South-East Deeps Drilling Highlights
Table 1: South-East Deeps Significant Intercepts
| Drill Hole | Significant Intercept | |||
| From (m) | To (m) | True Length (m) | Metal Grades | |
| GA-SE-611 | 929.3 | 931.3 | 9.0 | 366 g/t AgEq - 196 g/t Ag, 5.43% Zn, 1.67% Pb, 0.23 g/t Au and 0.04% Cu |
| Include 1 | 697.0 | 698.5 | 1.2 | 589 g/t AgEq - 353 g/t Ag, 6.65% Zn, 3.03% Pb, 0.24 g/t Au and 0.08% Cu |
| Include 2 | 704.0 | 705.3 | 1.0 | 742 g/t AgEq - 365 g/t Ag, 9.89% Zn, 5.50% Pb, 0.32 g/t Au and 0.06% Cu |
| And | 735.0 | 738.0 | 2.6 | 444 g/t AgEq - 97 g/t Ag, 11.58% Zn, 2.90% Pb, 0.59 g/t Au and 0.09% Cu |
| And | 784.0 | 787.0 | 2.6 | 206 g/t AgEq - 105 g/t Ag, 1.48% Zn, 0.81% Pb, 0.44 g/t Au and 0.33% Cu |
| GA-SE-DV-612 | 893.0 | 903.0 | 8.0 | 711 g/t AgEq - 130 g/t Ag, 18.16% Zn, 6.31% Pb, 0.14 g/t Au and 0.22% Cu |
| Include 1 | 899.0 | 901.0 | 1.6 | 1080 g/t AgEq - 224 g/t Ag, 23.20% Zn, 12.35% Pb, 0.09 g/t Au and 0.20% |
| GA-SE-615 | 926.0 | 929.5 | 2.7 | 330 g/t AgEq - 173 g/t Ag, 4.32% Zn, 1.95% Pb, 0.38 g/t Au and 0.04% Cu |
Central Deeps Drilling Highlights
Table 2: Central Deeps Significant Intercepts
| Drill Hole | Significant Intercept | |||
| From (m) | To (m) | True Length (m) | Metal Grades | |
| GA-CZ-617 | 706.0 | 710.0 | 3.7 | 534 AgEq g/t - 106 g/t Ag, 10.83% Zn, 2.75% Pb, 0.07 g/t Au and 1.01% Cu |
| Include 1 | 708.0 | 710.0 | 1.3 | 713 AgEq g/t - 154 g/t Ag, 10.65%Zn, 4.58% Pb, 0.06 g/t Au and 1.77% Cu |
| GA-CZ-620 | 630.0 | 633.0 | 2.9 | 538 AgEq g/t - 126 g/t Ag, 13.43% Zn, 1.73% Pb, 0.16 g/t Au and 0.60% Cu |
| Include 1 | 630.0 | 631.5 | 1.4 | 694 AgEq g/t - 216 g/t Ag, 14.05% Zn, 2.34% Pb, 0.10 g/t Au and 0.92% Cu |
| GA-CZ-620 | 561.5 | 568.5 | 6.9 | 713 AgEq g/t - 167 g/t Ag, 17.11% Zn, 4.99% Pb, 0.33 g/t Au and 0.42% Cu |
| Include 1 | 561.5 | 563.0 | 1.4 | 657 AgEq g/t - 165 g/t Ag, 12.45% Zn, 4.82% Pb, 0.03 g/t Au and 0.77% Cu |
| Include 2 | 563.0 | 565.0 | 1.9 | 545 AgEq g/t - 237 g/t Ag, 6.86% Zn, 4.97% Pb, 0.08 g/t Au and 0.48% Cu |
| Include 3 | 565.0 | 567.0 | 1.9 | 1013 AgEq g/t - 154 g/t Ag, 30.09% Zn, 6.66% Pb, 0.62 g/t Au and 0.27% Cu |
| Include 4 | 567.0 | 568.6 | 1.4 | 593 AgEq g/t - 92 g/t Ag, 18.15% Zn, 2.97% Pb, 0.57 g/t Au and 0.21% Cu |
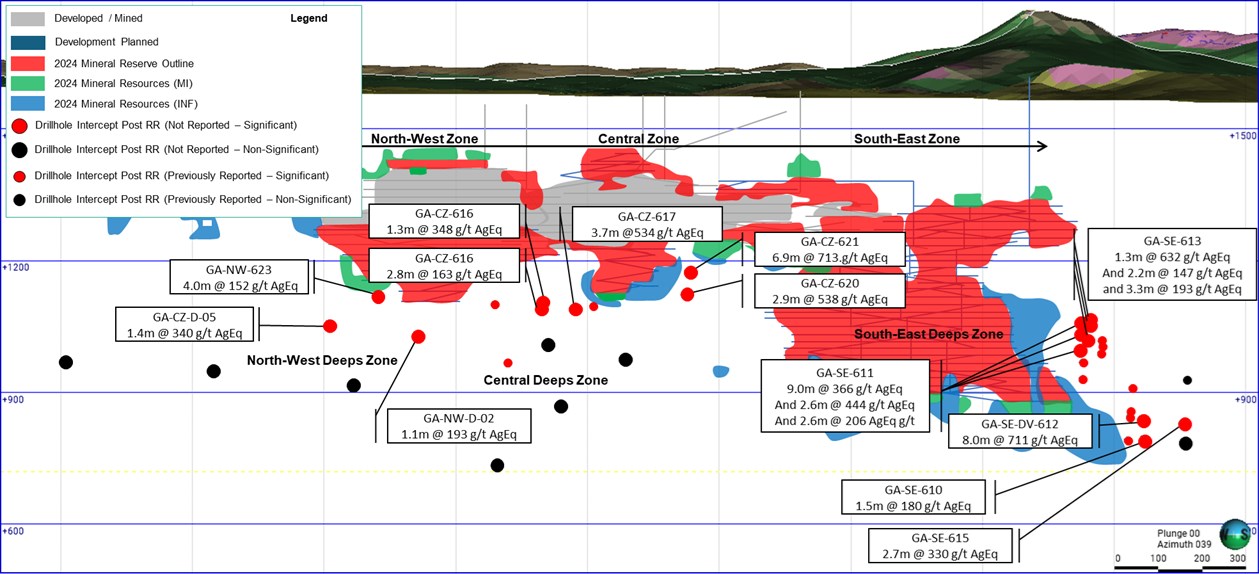
Figure 1: Los Gatos Long Section with Drill Hole Intersections Looking to the Northeast (See Table 3 for all Assay Results used in the AgEq Calculation)
To view an enhanced version of this graphic, please visit:
https://images.newsfilecorp.com/files/1475/265027_5f9ffe58340b9a17_002full.jpg
EXPLORATION RESULTS
Exploration drilling designed to expand near-mine mineralization intersected significant silver and base metal mineralization while targeting the extension of the South-East Deeps orebody, along with exploration of the recently identified Central and North-West Deeps mineralization zones. Results from the program are summarized below (Figure 2).
South-East Deeps Zone
Exploration drilling of the South-East Deeps zone extended silver and base metals mineralization along plunge in the southeast portion of the vein system (Figure 3). The drilling continues to target an Inferred drill spacing, as the extensions of the system are tested. Results of the drilling program confirm the continuity of the South-East Deeps, as the known limits to the mineralization are extended. Future drilling will target the down-plunge potential at a wider spacing to test the geological limits of the system. Infill and Resource conversion drilling will be executed from the underground mine, once ramp and level access is established. Select significant drill hole intervals are shown below in Figure 4.
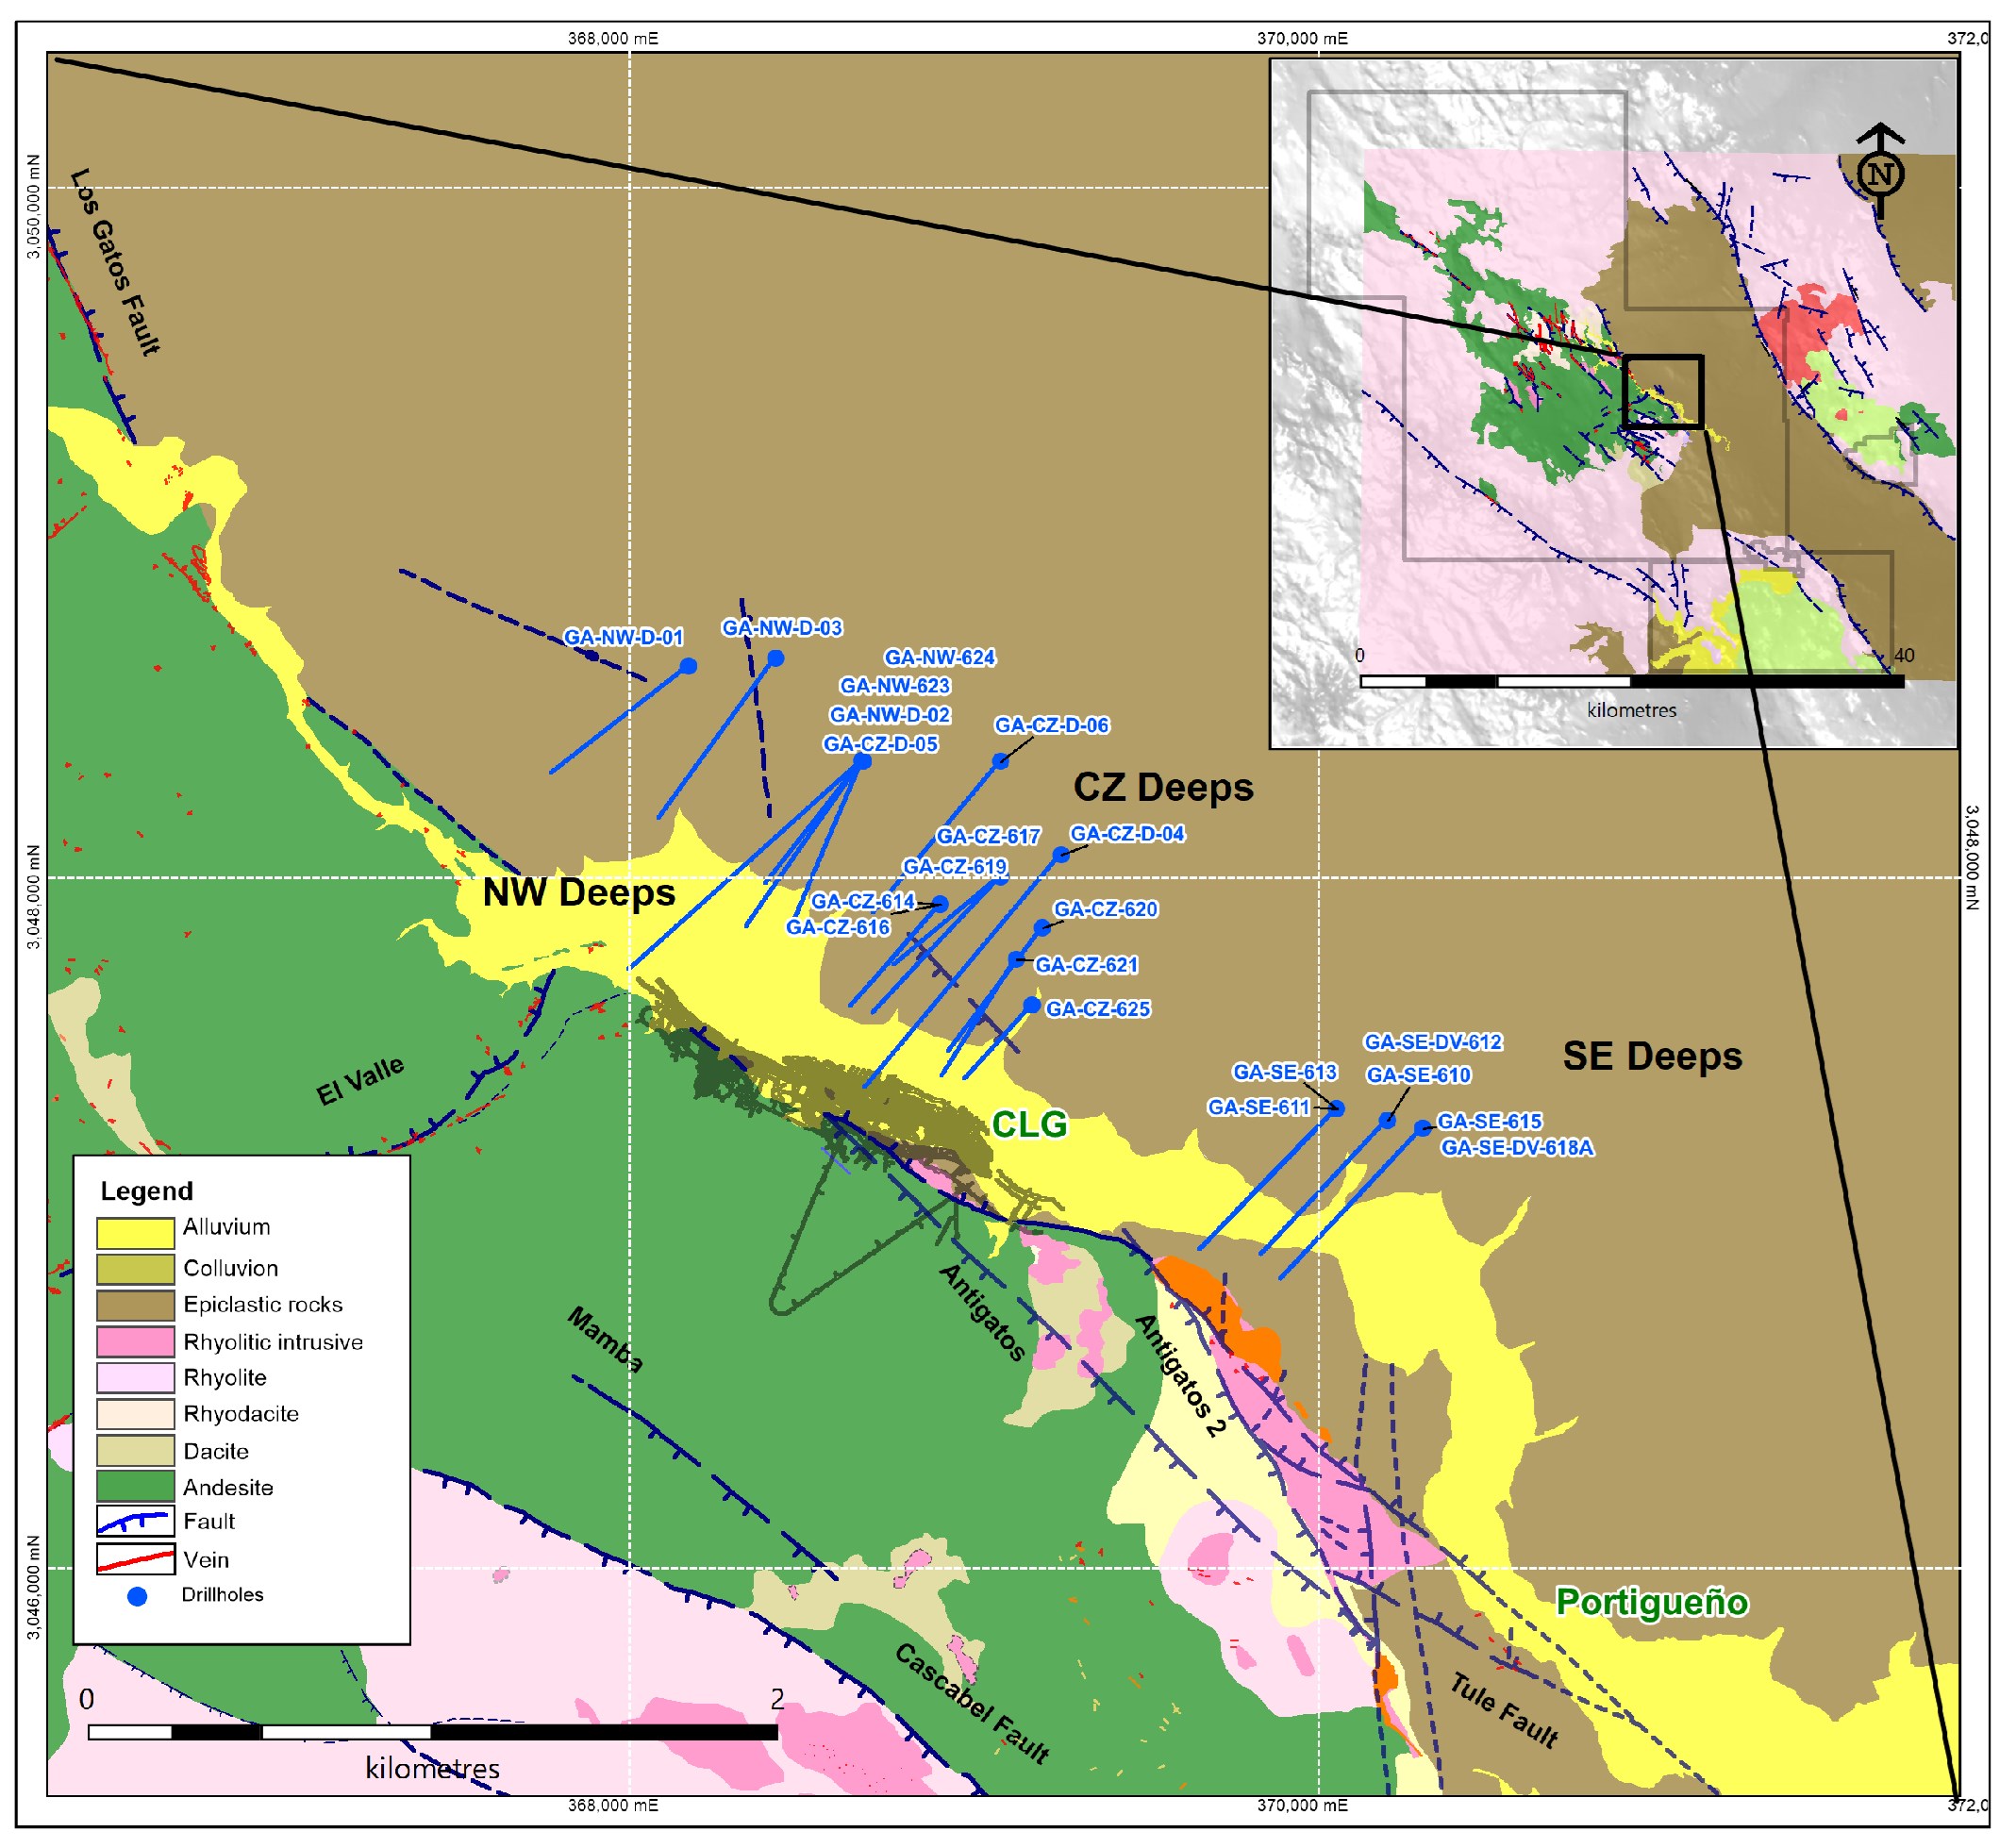
Figure 2: Los Gatos Near Mine Exploration Targets and Drill Hole Traces
To view an enhanced version of this graphic, please visit:
https://images.newsfilecorp.com/files/1475/265027_5f9ffe58340b9a17_003full.jpg
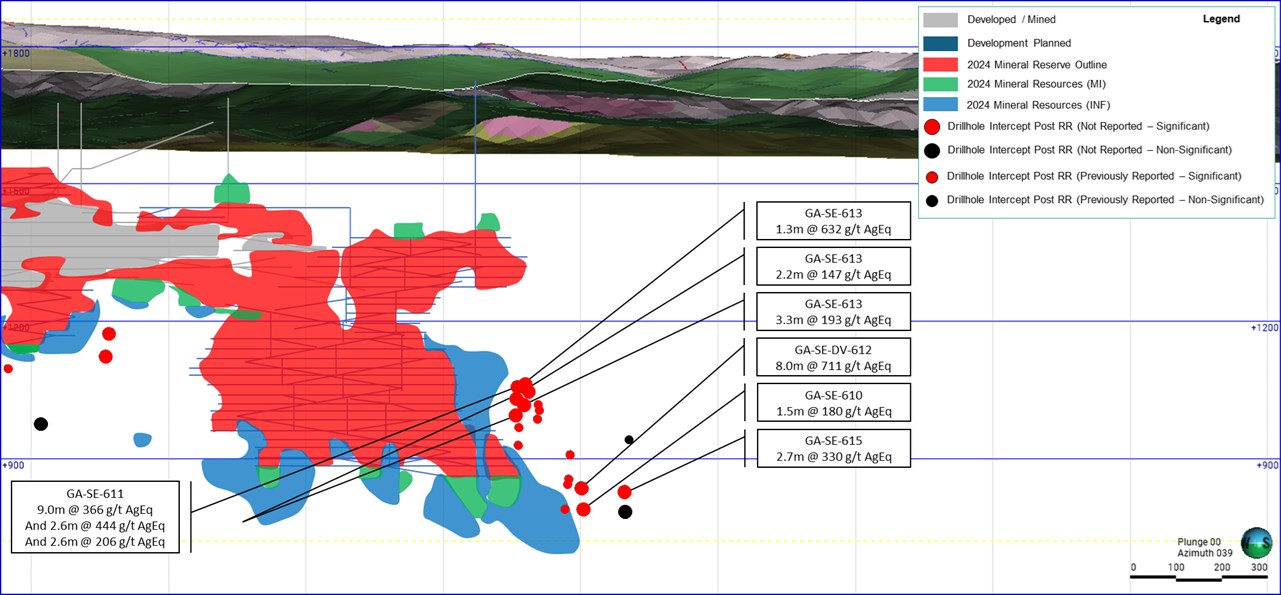
Figure 3: South-East Deeps Long Section and Drill Hole Intersections Looking Northeast (See Table 3 for all Assay Results used in the AgEq Calculation)
To view an enhanced version of this graphic, please visit:
https://images.newsfilecorp.com/files/1475/265027_5f9ffe58340b9a17_004full.jpg
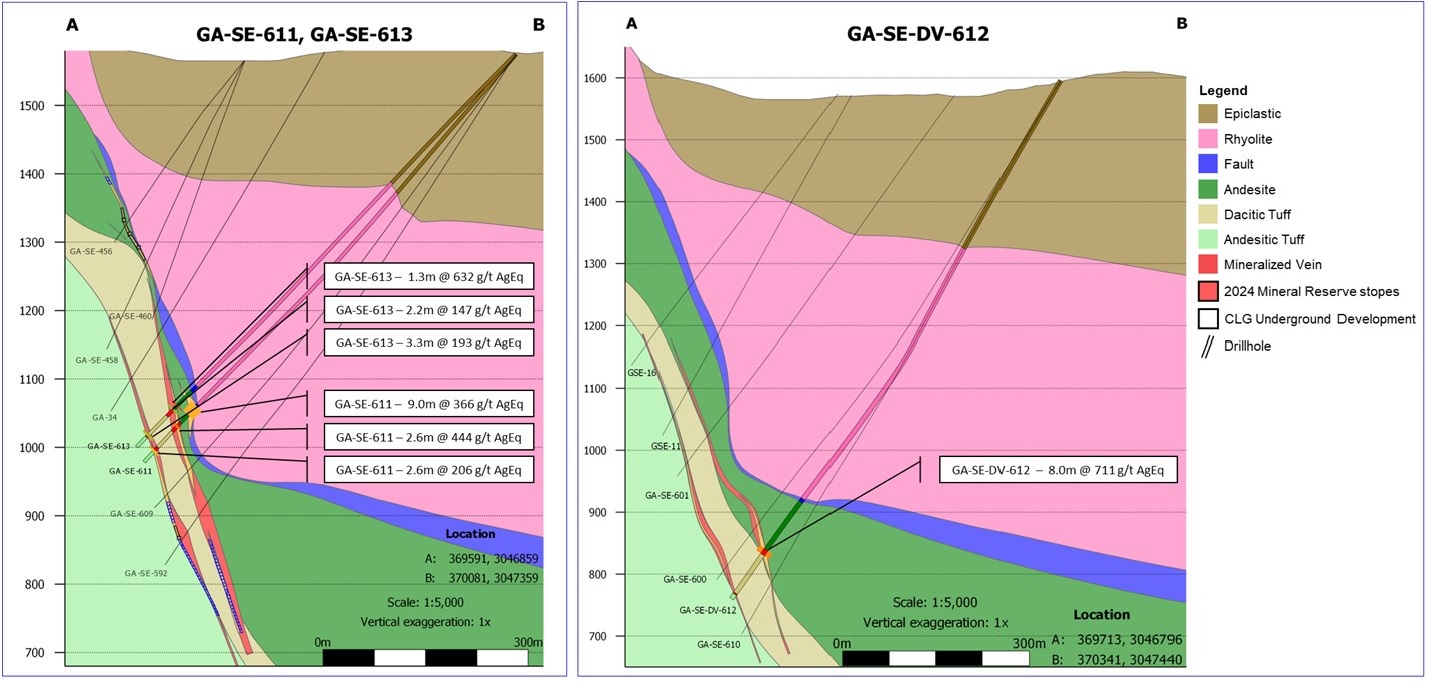
Figure 4: South-East Deeps Cross Sections for Drill Holes GA-SE-611 / 613, and GA-SE-DV-612, Section Thickness +/- 25m Looking Northwest (See Table 3 for all Assay Results used in the AgEq Calculation)
To view an enhanced version of this graphic, please visit:
https://images.newsfilecorp.com/files/1475/265027_first%20majestic%20figure%204.jpg
Central and North-West Deeps Zones
Drilling at the exploration targets in the Central and North-West Deeps zones confirmed the presence of silver and base metals mineralization at depth and identified a faulted offset from the main Los Gatos deposit (See Figure 5). Ongoing drilling is testing the lithological-structural model in these zones, to determine accurate mineralization controls. Drilling was conducted at a widely spaced exploration stage, targeting areas of interest, and will tighten to Inferred drill hole spacing throughout the remainder of 2025. All drilling has intersected the geological target as projected, with grade variability controlled by geological criteria.
The significant intervals returned from this drill program continue to grow and refine the areas of interest, with recent results indicating that the system remains open along strike to the northwest. Select significant drill hole intervals are shown in cross sections below in Figure 5.
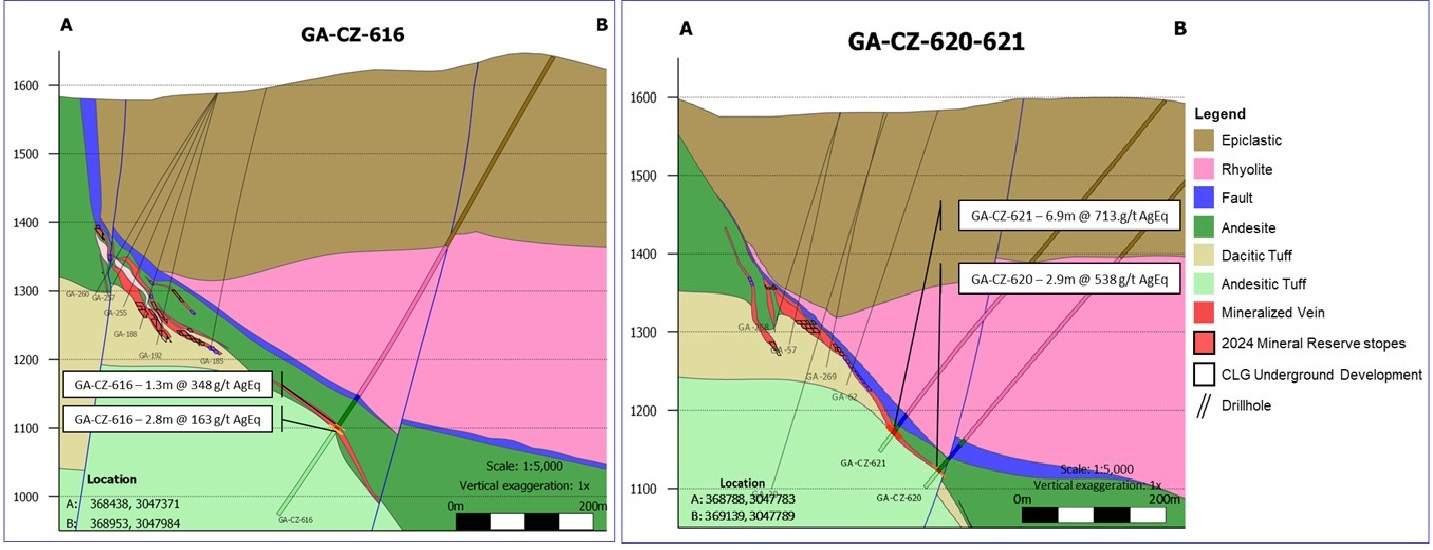
Figure 5: Central Deeps Cross Sections for Drill Holes GA-CZ-616, and GA-CZ-620 / 621, Section Thickness +/- 25m looking Northwest (See Table 3 for all Assay Results used in the AgEq Calculation)
To view an enhanced version of this graphic, please visit:
https://images.newsfilecorp.com/files/1475/265027_first%20majestic%20fig%205.jpg
Table 3: Summary of Significant Gold and Silver Drill Hole Intercepts at Los Gatos
| Drill Hole | Target | Target Type | Actual | |||||||||
| From (m) | To (m) | Length (m) | True Length (m) | Ag (g/t) | Zn (%) | Pb (%) | Au (g/t) | Cu (%) | AgEq (g/t) | |||
| GA-SE-610 | South-East Deeps | Resource Addition | 929.3 | 931.3 | 2.0 | 1.5 | 45 | 2.92 | 2.18 | 0.06 | 0.24 | 180 |
| GA-SE-611 | South-East Deeps | Resource Addition | 695.2 | 705.3 | 10.1 | 9.0 | 196 | 5.43 | 1.67 | 0.23 | 0.04 | 366 |
| Include 1 | 697.0 | 698.5 | 1.5 | 1.2 | 353 | 6.65 | 3.03 | 0.24 | 0.08 | 589 | ||
| Include 2 | 704.0 | 705.3 | 1.3 | 1.0 | 365 | 9.89 | 5.50 | 0.32 | 0.06 | 742 | ||
| Include 3 | 735.0 | 738.0 | 3.0 | 2.6 | 97 | 11.58 | 2.90 | 0.59 | 0.09 | 444 | ||
| Include 4 | 784.0 | 787.0 | 3.0 | 2.6 | 105 | 1.48 | 0.81 | 0.44 | 0.33 | 206 | ||
| GA-SE-DV-612 | South-East Deeps | Resource Addition | 893.0 | 903.0 | 10.0 | 8.0 | 130 | 18.16 | 6.31 | 0.14 | 0.22 | 711 |
| Include 1 | 899.0 | 901.0 | 2.0 | 1.6 | 224 | 23.20 | 12.35 | 0.09 | 0.20 | 1080 | ||
| GA-SE-613 | South-East Deeps | Resource Addition | 713.0 | 714.5 | 1.5 | 1.3 | 151 | 15.90 | 4.51 | 0.26 | 0.12 | 632 |
| And | 720.5 | 723.0 | 2.5 | 2.2 | 26 | 3.92 | 1.06 | 0.26 | 0.03 | 147 | ||
| And | 772.5 | 776.0 | 3.5 | 3.3 | 23 | 4.48 | 1.20 | 0.10 | 0.36 | 193 | ||
| GA-SE-615 | Central Deeps | Resource Addition | 926.0 | 929.5 | 3.5 | 2.7 | 173 | 4.32 | 1.95 | 0.38 | 0.04 | 330 |
| GA-CZ-616 | Central Deeps | Resource Addition | 622.5 | 624.0 | 1.5 | 1.3 | 173 | 5.41 | 0.58 | 0.02 | 0.36 | 348 |
| And | 628.5 | 631.5 | 3.0 | 2.8 | 104 | 0.74 | 0.23 | 0.03 | 0.32 | 163 | ||
| GA-CZ-617 | Central Deeps | Resource Addition | 706.0 | 710.0 | 4.0 | 3.7 | 106 | 10.83 | 2.75 | 0.07 | 1.01 | 534 |
| Include 1 | 708.0 | 710.0 | 1.5 | 1.3 | 154 | 10.65 | 4.58 | 0.06 | 1.77 | 713 | ||
| GA-CZ-620 | Central Deeps | Resource Addition | 630.0 | 633.0 | 3.0 | 2.9 | 126 | 13.43 | 1.73 | 0.16 | 0.60 | 538 |
| Include 1 | 630.0 | 631.5 | 1.5 | 1.4 | 216 | 14.05 | 2.34 | 0.10 | 0.92 | 694 | ||
| GA-CZ-621 | Central Deeps | Resource Addition | 561.5 | 568.5 | 7.0 | 6.9 | 167 | 17.11 | 4.99 | 0.33 | 0.42 | 713 |
| Include 1 | 561.5 | 563.0 | 1.5 | 1.4 | 165 | 12.45 | 4.82 | 0.03 | 0.77 | 657 | ||
| Include 2 | 563.0 | 565.0 | 2.0 | 1.9 | 237 | 6.86 | 4.97 | 0.08 | 0.48 | 545 | ||
| Include 3 | 565.0 | 567.0 | 2.0 | 1.9 | 154 | 30.09 | 6.66 | 0.62 | 0.27 | 1013 | ||
| Include 4 | 567.0 | 568.6 | 1.5 | 1.4 | 92 | 18.15 | 2.97 | 0.57 | 0.21 | 593 | ||
| GA-CZ-D-05 | Exploration | 791.1 | 793.0 | 1.9 | 1.4 | 26 | 9.87 | 3.46 | 0.03 | 0.05 | 340 | |
| GA-NW-623 | Resource Addition | 791.0 | 795.0 | 4.0 | 4.0 | 33 | 3.06 | 0.39 | 0.06 | 0.35 | 152 | |
| GA-NW-D-02 | Exploration | 802.9 | 804.5 | 1.6 | 1.1 | 36 | 3.90 | 0.63 | 0.05 | 0.48 | 193 | |
Notes: