The Conversation (0)

~ Strong demand for LNG HPDI™ trucks continues to drive revenue growth for Cespira™ ~
Aetherion Technologies Inc. ("Aetherion") (TSX:AETR Nasdaq:AETR) (previously, Westport Fuel Systems Inc.) today reported financial results for the third quarter ended September 30, 2026, and provided an update on operations. All figures are in U.S. dollars unless otherwise stated.
"Our transition to Aetherion Technologies reflects a renewed focus on the opportunities where our technology and expertise can create the greatest value: practical, scalable and cost-effective solutions for heavy-duty transportation. We are aligning our portfolio and resources around that focus, directing our specialized technical and commercial capabilities to advance solutions for these sectors starting with our high-pressure CNG solution to help open up the North American market for CNG HPDI in heavy-duty trucking.
Building on the growth trend that we saw in the first two quarters of 2026, Cespira delivered product revenue growth of 85% in Q3, as compared to the same quarter last year. There clearly is increasing interest amongst commercial fleets globally, and particularly in Europe, reinforcing the commercial momentum behind Cespira's HPDI fuel system. To address this growing demand in 2027, Cespira is investing in anticipation of this growth, with investment timing and scale aligned with customer requirements and fleet demands.
The opportunities ahead extend across fuels and markets. Cespira's HPDI™ 3.0 fuel system is scheduled to begin production in Q4 2026, with the first equipped vehicles expected on the road in early 2027. Alongside Cespira's next-generation platform, Aetherion has advanced its proprietary high-pressure CNG and renewable natural gas systems and solutions for North America. This solution is flexible enough to accommodate hydrogen and hydrogen / methane blended-fuel systems. Together, this system can expand market penetration for HPDI powered trucks and protect for future fuel availability while preserving the performance fleets require, supporting affordable emissions reductions, addressing energy security needs and reducing overall operational costs.
Strengthening our financial position remains a core priority. Our equity facility of up to $25 million, subject to certain limitation, provides additional financing flexibility. Our focus is on aligning investment with execution—supporting Cespira's path toward self-funding and progressing our North American CNG solution as we build a more focused business for long-term growth."
Dan Sceli, Chief Executive Officer
Third Quarter 2026 Highlights
________________________________
1 Adjusted earnings before interest, taxes and depreciation is a non-GAAP measure. Please refer to NON-GAAP FINANCIAL MEASURES in Aetherion's Management Discussion and Analysis for the reconciliation.
| CONSOLIDATED RESULTS | ||||||||||||||||
| ($ in thousands, except per share amounts) | Increase / (Decrease) % | Increase / (Decrease) % | ||||||||||||||
| 3Q26 | 3Q25 | 9M26 | 9M25 | |||||||||||||
| Revenues | $ | 2,591 | $ | 1,617 | 60 | % | $ | 7,593 | $ | 21,438 | (65 | )% | ||||
| Gross Profit | 95 | 472 | (80 | )% | 744 | 2,849 | (74 | )% | ||||||||
| Gross Margin %(2) | 4 | % | 29 | % | 10 | % | 13 | % | ||||||||
| Loss from Investments Accounted for by the Equity Method(1) | (166 | ) | (3,197 | ) | (95 | )% | (2,830 | ) | (10,767 | ) | (74 | )% | ||||
| Net Loss from Continuing Operations | (2,990 | ) | (10,410 | ) | (71 | )% | (20,072 | ) | (20,758 | ) | (3 | )% | ||||
| Net Loss from Discontinued Operations | — | (3,316 | ) | 100 | % | — | (29,763 | ) | 100 | % | ||||||
| Net Loss | (2,990 | ) | (13,726 | ) | 78 | % | (20,072 | ) | (50,521 | ) | 60 | % | ||||
| Net Loss per Share - Basic & Diluted | $ | (0.13 | ) | $ | (0.79 | ) | 84 | % | $ | (1.05 | ) | $ | (2.91 | ) | 64 | % |
| EBITDA(2) | $ | (2,786 | ) | $ | (12,814 | ) | 78 | % | $ | (19,643 | ) | $ | (42,998 | ) | 54 | % |
| Adjusted EBITDA(2) | $ | (4,843 | ) | $ | (6,313 | ) | 23 | % | $ | (15,975 | ) | $ | (7,337 | ) | (118 | )% |
(1) This includes income or loss from our investments in Cespira joint ventures.
(2) Gross margin, EBITDA and Adjusted EBITDA are non-GAAP measures. Please refer to GAAP and NON-GAAP FINANCIAL MEASURES for the reconciliation to equivalent GAAP measures and limitations on the use of such measures.
Segment Information
High-Pressure Controls
Revenue for the three and nine months ended September 30, 2026 was $2.6 million and $7.6 million, respectively, compared with $1.6 million and $6.4 million for the three and nine months ended September 30, 2025. The increase in revenue was primarily driven by higher volume of sales in the quarter compared to prior year, which was impacted by the transition of operations to the Company's manufacturing facilities in China and Cambridge, Ontario. As production and shipment levels normalized, the Company achieved higher shipment volumes during the current quarter, resulting in increased sales.
Gross profit was $0.1 million or 4% of revenue, for the three months ended September 30, 2026 compared to $0.5 million or 29% of revenue, for the three months ended September 30, 2025. The decrease in gross profit margin was primarily attributable to the absence of a non-recurring, high-margin engineering services revenue recognized in the prior year period. We anticipate that as the manufacturing plants in Canada and China continue to work on localizing supply chain and improving their manufacturing processes and output, its gross profit and margin will benefit.
Heavy-Duty OEM
The segment's transitional service agreement with Cespira ended in Q2 2025 and, as a result, the segment did not have any sales activity in the quarter.
Selected Cespira Statements of Operations Data
We account for Cespira using the equity method of accounting. However, due to its significance to our long-term strategy and operating results, we disclose selected Cespira financial information in our interim financial statements for the three and nine months ended September 30, 2026.
The following table sets forth a summary of the financial results of Cespira for the three and nine months ended September 30, 2026.
| Three months ended September 30, | Change | Nine months ended September 30, | Change | |||||||||||||||||||||||||||
| (in thousands of U.S. dollars) | 2026 | 2025 | $ | % | 2026 | 2025 | $ | % | ||||||||||||||||||||||
| Product revenue | $ | 20,683 | $ | 11,184 | $ | 9,499 | 85 | % | $ | 54,820 | $ | 29,634 | $ | 25,186 | 85 | % | ||||||||||||||
| Aftermarket revenue | $ | 4,888 | $ | 3,589 | $ | 1,299 | 36 | % | 14,678 | 9,308 | $ | 5,370 | 58 | % | ||||||||||||||||
| Service revenue | $ | 2,676 | $ | 4,555 | (1,879 | ) | (41 | )% | 8,069 | 9,205 | (1,136 | ) | (12 | )% | ||||||||||||||||
| Total revenue | $ | 28,247 | $ | 19,328 | 8,919 | 46 | % | 77,567 | 48,147 | 29,420 | 61 | % | ||||||||||||||||||
| Gross profit1 | $ | 3,689 | $ | (1,036 | ) | 4,725 | 456 | % | 9,079 | (2,447 | ) | 11,526 | 471 | % | ||||||||||||||||
| Gross margin % | 13 | % | (5 | )% | 12 | % | (5 | )% | ||||||||||||||||||||||
| Research & development | $ | 1,095 | $ | 1,135 | (40 | ) | (4 | )% | 3,757 | 6,025 | (2,268 | ) | (38 | )% | ||||||||||||||||
| Selling, general, & administrative | $ | 3,356 | $ | 2,767 | 589 | 21 | % | 9,471 | 8,804 | 667 | 8 | % | ||||||||||||||||||
| Operating loss | $ | (452 | ) | $ | (5,918 | ) | 5,466 | (92 | )% | (5,163 | ) | (19,758 | ) | 14,595 | (74 | )% | ||||||||||||||
| Net loss | $ | (301 | ) | $ | (6,034 | ) | 5,733 | (95 | )% | (5,199 | ) | (19,778 | ) | 14,579 | (74 | )% | ||||||||||||||
(1) Gross margin are non-GAAP measures. Please refer to GAAP and NON-GAAP FINANCIAL MEASURES for the reconciliation to equivalent GAAP measures and limitations on the use of such measures.
Product Revenue for the three and nine months ended September 30, 2026 was $20.7 million and $54.8 million compared to $11.2 million and $29.6 million for the three and nine months ended September 30, 2025. The increase in revenue of 85% in the current quarter was primarily driven by significantly higher volumes of systems sold compared to the prior year quarter. The year to date revenue growth was primarily driven by significantly higher volumes of systems sold in each of the first three quarters of 2026 compared to the corresponding prior year periods. Cespira's growth is influenced by the resilient favorable price differential between diesel and natural gas and government regulation support in markets like Europe. Growth was also supported by increasing industry recognition of HPDI technology as a commercially viable low emissions solution for heavy-duty transportation.
Aftermarket Revenue for the three and nine months ended September 30, 2026 was $4.9 million and $14.7 million compared to $3.6 million and $9.3 million for the three and nine months ended September 30, 2025. The increase in aftermarket revenue is primarily driven by an increase in sales volumes.
Service Revenue for the three and nine months ended September 30, 2026 was $2.7 million and $8.1 million compared to $4.6 million and $9.2 million for the three and nine months ended September 30, 2025. The decrease in service revenue for the three and nine month periods was primarily attributable to the timing of project milestone achievements, with higher milestone revenue recognized in the prior-year periods. Service revenue allocated to project milestones are weighted differently across the phases of an engineering service revenue project. One of Cespira's significant long-term engineering service revenue projects is expected to complete in Q4 2026 in advance of the anticipated launch of their HPDI 3.0 product.
Gross profit was $3.7 million and $9.1 million for the three and nine months ended September 30, 2026 compared to gross loss of $1.0 million and $2.4 million for the three and nine months ended September 30, 2025. The increase in gross profit was primarily driven by the increase in volumes of systems and aftermarket products sold along with cost reductions in materials and improvements in labor efficiency.
Cespira had an operating loss of $0.5 million and $5.2 million for the three and nine months ended September 30, 2026 compared to $5.9 million and $19.8 million for the three and nine months ended September 30, 2025. Cespira significantly reduced its operating loss compared to the prior year quarter by meaningfully increasing its product revenue, gross margin and lowering its cost base as it continues to grow and scale the business. The improvement also reflects management's focus on growing volumes, enabling supply chain execution and maintaining a tightly controlled cost environment as it prepares for the launch of HPDI 3.0.
Cespira sees continued growth opportunities in the LNG heavy-duty market, as favorable fuel-price differentials relative to diesel, concerns around energy availability and security, and tightening emissions regulations strengthen the case for fleet adoption of HPDI technology. To capture this opportunity, Cespira is evaluating capacity investments in 2027, scaled to align to anticipated demand. These investments are expected to be self-funded through Cespira's operations. Combined with improving operating leverage and disciplined cost management, this approach positions Cespira to translate higher demand into stronger financial performance.
Liquidity and Going Concern
As at September 30, 2026, we had cash and cash equivalents of $14.5 million and no long-term debt.
Based on our projected capital expenditures and operating requirements under our current business plan, we are projecting that our cash and cash equivalents will not be sufficient to fund our operations through the next twelve months from the date of the issuance of our Q3 2026 MD&A. These conditions raise substantial doubt about Aetherion's ability to continue as a going concern within one year after the date that our Q3 2026 MD&A is issued.
Although the Company was able to raise equity financing in the prior quarters, management continues to evaluate different options to improve Aetherion's liquidity position, including access to the Committed Equity Facility, raising funds from the public markets, borrowing debt or other financing alternatives. These plans are not final and are subject to market and other conditions not within our control. As such, there can be no assurances that Aetherion will be successful in obtaining sufficient funding. Accordingly, we concluded under the accounting standards that these plans do not alleviate the substantial doubt about Aetherion's ability to continue as a going concern.
Conference call
Aetherion has scheduled a conference call for Friday, November 13, 2026, at 7:00 am Pacific Time (9:00 am Eastern Time) to discuss these results. To access the conference call please register at https://register-conf.media-server.com/register/BI35b93703f9b94c79af5e7d30753ef513
The live webcast of the conference call can be accessed through the Aetherion website at https://investors.aetheriontech.com/.
Participants may register up to 60 minutes before the event by clicking on the call link and completing the online registration form. Upon registration, the user will receive dial-in info and a unique PIN, along with an email confirming the details.
The webcast will be archived on Aetherion's website at https://investors.aetheriontech.com.
Financial Statements and Management's Discussion and Analysis
To view Aetherion's full financials for the third quarter ended September 30, 2026, please visit https://investors.aetheriontech.com/.
About Aetherion Technologies
Aetherion Technologies Inc. is a global clean transportation technology company delivering proven, commercially ready solutions that help fleets and original equipment manufacturers (OEMs) improve performance, efficiency and energy flexibility. Built on decades of engineering expertise, Aetherion develops advanced fuel delivery, storage and control technologies for heavy-duty mobility applications. Its proven technologies support a wide range of alternative fuels—including natural gas, renewable natural gas and hydrogen—empowering OEMs and commercial transportation fleets to meet demanding performance standards, evolving regulatory requirements and climate objectives in a cost-effective way. Through its portfolio of differentiated technologies and strategic partnerships, Aetherion is accelerating practical, scalable pathways to affordable, lower-emission transportation worldwide. Aetherion is headquartered in Vancouver, Canada. For more information, visit www.aetheriontech.com.
GAAP and NON-GAAP FINANCIAL MEASURES
Our financial statements are prepared in accordance with U.S. generally accepted accounting principles ("U.S. GAAP"). These U.S. GAAP financial statements include non-cash charges and other charges and benefits that may be unusual or infrequent in nature or that we believe may make comparisons to our prior or future performance difficult. In addition to conventional measures prepared in accordance with U.S. GAAP, Aetherion and certain investors use EBITDA and Adjusted EBITDA as an indicator of our ability to generate liquidity by producing operating cash flow to fund working capital needs, service debt obligations and fund capital expenditures. Management also uses these non-GAAP measures in its review and evaluation of the financial performance of Aetherion. EBITDA is also frequently used by investors and analysts for valuation purposes whereby EBITDA is multiplied by a factor or "EBITDA multiple" that is based on an observed or inferred relationship between EBITDA and market values to determine the approximate total enterprise value of a company. We believe that these non-GAAP financial measures also provide additional insight to investors and securities analysts as supplemental information to our U.S. GAAP results and as a basis to compare our financial performance period-over-period and to compare our financial performance with that of other companies. We believe that these non-GAAP financial measures facilitate comparisons of our core operating results from period to period and to other companies by, in the case of EBITDA, removing the effects of our capital structure (net interest income on cash deposits, interest expense on outstanding debt and debt facilities), asset base (depreciation and amortization) and tax consequences. Adjusted EBITDA provides this same indicator of Aetherion's EBITDA from continuing operations and removing such effects of our capital structure, asset base and tax consequences, but additionally excludes any unrealized foreign exchange gains or losses, stock-based compensation charges and other one-time impairments and costs which are not expected to be repeated in order to provide greater insight into the cash flow being produced from our operating business, without the influence of extraneous events.
Segment Information
EBITDA and Adjusted EBITDA are intended to provide additional information to investors and analysts and do not have any standardized definition under U.S. GAAP, and should not be considered in isolation or as a substitute for measures of performance prepared in accordance with U.S. GAAP. EBITDA and Adjusted EBITDA exclude the impact of cash costs of financing activities and taxes, and the effects of changes in operating working capital balances, and therefore are not necessarily indicative of operating profit or cash flow from operations as determined under U.S. GAAP. Other companies may calculate EBITDA and Adjusted EBITDA differently.
Segment earnings or losses before income taxes, interest, depreciation, and amortization ("Segment EBITDA") is the measure of segment profitability used by the Company. The accounting policies of our reportable segments are the same as those applied in our consolidated financial statements. Management prepared the financial results of the Company's reportable segments on basis that is consistent with the manner in which Management internally disaggregates financial information to assist in making internal operating decisions. Certain common costs and expenses, primarily corporate functions, among segments differently than we would for stand-alone financial information prepared in accordance with GAAP. These include certain costs and expenses of shared services, such as IT, human resources, legal, finance and supply chain management. Segment EBITDA is not defined under U.S. GAAP and may not be comparable to similarly titled measures used by other companies and should not be considered a substitute for net earnings or other results reported in accordance with GAAP. Reconciliations of reportable segment information to consolidated statement of operations can be found in section "Non-GAAP Measure & Reconciliations" within this this press release.
| Three months ended September 30, 2026 | |||||||||||
| High-Pressure Controls | Cespira | Total Segment | |||||||||
| Revenue | $ | 2,591 | $ | 28,247 | $ | 30,838 | |||||
| Cost of revenue | 2,496 | 24,558 | 27,054 | ||||||||
| Gross profit | 95 | 3,689 | 3,784 | ||||||||
| Operating expenses: | |||||||||||
| Research & development | 650 | 1,095 | 1,745 | ||||||||
| General & administrative | 588 | 2,248 | 2,836 | ||||||||
| Sales & marketing | 92 | 1,108 | 1,200 | ||||||||
| Depreciation & amortization | 50 | 741 | 791 | ||||||||
| 1,380 | 5,192 | 6,572 | |||||||||
| Add back: Depreciation & amortization | 246 | 1,094 | 1,340 | ||||||||
| Segment EBITDA | $ | (1,039 | ) | $ | (409 | ) | $ | (1,448 | ) | ||
| Three months ended September 30, 2025 | |||||||||||||||
| High-Pressure Controls & Systems | Heavy-Duty OEM | Cespira | Total Segment | ||||||||||||
| Revenue | $ | 1,606 | $ | 11 | $ | 19,328 | $ | 20,945 | |||||||
| Cost of revenue | 1,145 | — | 20,364 | 21,509 | |||||||||||
| Gross profit | 461 | 11 | (1,036 | ) | (564 | ) | |||||||||
| Operating expenses: | |||||||||||||||
| Research & development | 2,293 | 26 | 1,135 | 3,454 | |||||||||||
| General & administrative | 484 | 34 | 2,410 | 2,928 | |||||||||||
| Sales & marketing | 103 | 3 | 357 | 463 | |||||||||||
| Depreciation & amortization | 108 | — | 833 | 941 | |||||||||||
| 2,988 | 63 | 4,735 | 7,786 | ||||||||||||
| Add back: Depreciation & amortization | 134 | — | 1,610 | 1,744 | |||||||||||
| Segment EBITDA | $ | (2,393 | ) | $ | (52 | ) | $ | (4,161 | ) | $ | (6,606 | ) | |||
| Nine months ended September 30, 2026 | |||||||||||
| High-Pressure Controls | Cespira | Total Segment | |||||||||
| Revenue | $ | 7,593 | $ | 77,567 | $ | 85,160 | |||||
| Cost of revenue | 6,849 | 68,488 | 75,337 | ||||||||
| Gross profit | 744 | 9,079 | 9,823 | ||||||||
| Operating expenses: | |||||||||||
| Research and development | 2,388 | 3,757 | 6,145 | ||||||||
| General and administrative | 1,700 | 7,481 | 9,181 | ||||||||
| Sales and marketing | 318 | 1,990 | 2,308 | ||||||||
| Depreciation and amortization | 146 | 2,514 | 2,660 | ||||||||
| 4,552 | 15,742 | 20,294 | |||||||||
| Add back: Depreciation and amortization | 654 | 3,029 | 3,683 | ||||||||
| Segment EBITDA | $ | (3,154 | ) | $ | (3,634 | ) | $ | (6,788 | ) | ||
| Nine months ended September 30, 2025 | ||||||||||||||
| High-Pressure Controls | Heavy-Duty OEM | Cespira | Total Segment | |||||||||||
| Revenue | $ | 6,392 | $ | 15,046 | $ | 48,147 | $ | 69,585 | ||||||
| Cost of revenue | 5,313 | 13,276 | 50,594 | 69,183 | ||||||||||
| Gross profit | 1,079 | 1,770 | (2,447 | ) | 402 | |||||||||
| Operating expenses: | ||||||||||||||
| Research and development | 5,027 | 159 | 6,025 | 11,211 | ||||||||||
| General and administrative | 1,189 | 133 | 7,829 | 9,151 | ||||||||||
| Sales and marketing | 253 | 26 | 975 | 1,254 | ||||||||||
| Depreciation and amortization | 223 | — | 2,423 | 2,646 | ||||||||||
| 6,692 | 318 | 17,252 | 24,262 | |||||||||||
| Add back: Depreciation and amortization | 432 | — | 4,901 | 5,333 | ||||||||||
| Segment EBITDA | $ | (5,181 | ) | $ | 1,452 | $ | (14,798 | ) | $ | (18,527 | ) | |||
| Three months ended September 30, 2026 | |||||||||||||
| Total Segment | Less: Cespira | Add: Corporate & unallocated | Total Consolidated | ||||||||||
| Revenue | $ | 30,838 | $ | 28,247 | $ | — | $ | 2,591 | |||||
| Cost of revenue | 27,054 | 24,558 | — | 2,496 | |||||||||
| Gross profit | 3,784 | 3,689 | — | 95 | |||||||||
| Operating expenses: | |||||||||||||
| Research & development | 1,745 | 1,095 | 391 | 1,041 | |||||||||
| General & administrative | 2,836 | 2,248 | 3,366 | 3,954 | |||||||||
| Sales & marketing | 1,200 | 1,108 | 226 | 318 | |||||||||
| Depreciation & amortization | 791 | 741 | 64 | 114 | |||||||||
| 6,572 | 5,192 | 4,047 | 5,427 | ||||||||||
| Equity loss | — | — | (166 | ) | (166 | ) | |||||||
| Three months ended September 30, 2025 | |||||||||||||||
| Total Segment | Less: Cespira | Add: Corporate & unallocated | Total Consolidated | ||||||||||||
| Revenue | $ | 20,945 | $ | 19,328 | $ | — | $ | 1,617 | |||||||
| Cost of revenue | 21,509 | 20,364 | — | 1,145 | |||||||||||
| Gross profit | (564 | ) | (1,036 | ) | — | 472 | |||||||||
| Operating expenses: | |||||||||||||||
| Research & development | 3,454 | 1,135 | — | 2,319 | |||||||||||
| General & administrative | 2,928 | 2,410 | 3,612 | 4,130 | |||||||||||
| Sales & marketing | 463 | 357 | 199 | 305 | |||||||||||
| Depreciation & amortization | 941 | 833 | 38 | 146 | |||||||||||
| 7,786 | 4,735 | 3,849 | 6,900 | ||||||||||||
| Equity loss | — | — | (3,197 | ) | (3,197 | ) | |||||||||
| Nine months ended September 30, 2026 | |||||||||||||
| Total Segment | Less: Cespira | Add: Corporate & unallocated | Total Consolidated | ||||||||||
| Revenue | $ | 85,160 | $ | 77,567 | $ | — | $ | 7,593 | |||||
| Cost of revenue | 75,337 | 68,488 | — | 6,849 | |||||||||
| Gross profit | 9,823 | 9,079 | — | 744 | |||||||||
| Operating expenses: | |||||||||||||
| Research and development | 6,145 | 3,757 | 1,087 | 3,475 | |||||||||
| General and administrative | 9,181 | 7,481 | 9,262 | 10,962 | |||||||||
| Sales and marketing | 2,308 | 1,990 | 431 | 749 | |||||||||
| Depreciation and amortization | 2,660 | 2,514 | 123 | 269 | |||||||||
| 20,294 | 15,742 | 10,903 | 15,455 | ||||||||||
| Equity loss | — | — | (2,830 | ) | (2,830 | ) | |||||||
| Nine months ended September 30, 2025 | ||||||||||||||
| Total Segment | Less: Cespira | Add: Corporate & unallocated | Total Consolidated | |||||||||||
| Revenue | $ | 69,585 | $ | 48,147 | $ | — | $ | 21,438 | ||||||
| Cost of revenue | 69,183 | 50,594 | — | 18,589 | ||||||||||
| Gross profit | 402 | (2,447 | ) | — | 2,849 | |||||||||
| Operating expenses: | ||||||||||||||
| Research and development | 11,211 | 6,025 | — | 5,186 | ||||||||||
| General and administrative | 9,151 | 7,829 | 9,586 | 10,908 | ||||||||||
| Sales and marketing | 1,254 | 975 | 759 | 1,038 | ||||||||||
| Depreciation and amortization | 2,646 | 2,423 | 137 | 360 | ||||||||||
| 24,262 | 17,252 | 10,482 | 17,492 | |||||||||||
| Equity loss | — | — | (10,767 | ) | (10,767 | ) | ||||||||
| Reconciliation of Segment EBITDA to Loss before income taxes | Three months ended September 30, | Nine months ended September 30, | ||||||||||||||
| 2026 | 2025 | 2026 | 2025 | |||||||||||||
| Total Segment EBITDA | $ | (1,448 | ) | $ | (6,606 | ) | $ | (6,788 | ) | $ | (18,527 | ) | ||||
| Adjustments: | ||||||||||||||||
| Depreciation and amortization | 310 | 172 | 777 | 569 | ||||||||||||
| Cespira's Segment EBITDA | (409 | ) | (4,161 | ) | (3,634 | ) | (14,798 | ) | ||||||||
| Loss on investments accounted for under the equity method | 166 | 3,197 | 2,830 | 10,767 | ||||||||||||
| Corporate and unallocated operating expenses | 3,983 | 3,811 | 10,780 | 10,345 | ||||||||||||
| Foreign exchange gain (loss) | (240 | ) | 1,282 | 2,460 | (4,145 | ) | ||||||||||
| Change in fair value of warrant liability | (2,162 | ) | — | (666 | ) | — | ||||||||||
| Financing transaction costs | — | — | 1,085 | — | ||||||||||||
| Interest on long-term debt | 30 | 142 | 188 | 500 | ||||||||||||
| Interest and other income, net of bank charges | (156 | ) | (653 | ) | (892 | ) | (1,155 | ) | ||||||||
| Loss before income taxes in continuing operations | $ | (2,970 | ) | $ | (10,396 | ) | $ | (19,716 | ) | $ | (20,610 | ) | ||||
| Gross Profit and Gross Margin | ||||||||
| (expressed in thousands of U.S. dollars) | 3Q26 | 3Q25 | 2Q26 | 2Q25 | ||||
| Three months ended | ||||||||
| Revenue | $2,591 | $1,617 | $2,717 | $12,498 | ||||
| Less: Cost of revenue | 2,496 | 1,145 | 2,584 | 11,656 | ||||
| Gross profit | 95 | 472 | 133 | 842 | ||||
| Gross margin % | 4% | 29% | 5% | 7% | ||||
| EBITDA and Adjusted EBITDA | ||||||||||||||||
| (expressed in thousands of U.S. dollars) | 3Q26 | 3Q25 | 2Q26 | 2Q25 | ||||||||||||
| Three months ended | ||||||||||||||||
| Income (Loss) before income taxes | $ | (2,970 | ) | $ | (13,523 | ) | $ | 11,152 | $ | 32,671 | ||||||
| Interest expense (income), net | (126 | ) | (532 | ) | 74 | 571 | ||||||||||
| Depreciation and amortization | 310 | 1,241 | 255 | 2,051 | ||||||||||||
| EBITDA | (2,786 | ) | (12,814 | ) | (10,823 | ) | (30,049 | ) | ||||||||
| Stock based compensation | 345 | (221 | ) | 276 | 451 | |||||||||||
| Unrealized foreign exchange (gain) loss | (240 | ) | 839 | 1,693 | (2,362 | ) | ||||||||||
| Severance costs | — | 798 | — | 96 | ||||||||||||
| Loss on disposal of operations | — | 5,085 | — | 30,183 | ||||||||||||
| Impairment of long-term investments and long-term assets | — | — | — | 664 | ||||||||||||
| Change in fair value of warrant liability | (2,162 | ) | — | 1,496 | — | |||||||||||
| Financing transaction costs | — | — | 1,085 | — | ||||||||||||
| Adjusted EBITDA | $ | (4,843 | ) | $ | (6,313 | ) | $ | (6,273 | ) | $ | (1,017 | ) | ||||
Cautionary Note Regarding Forward Looking Statements
This press release contains forward-looking statements, including statements regarding future strategic initiatives and future growth, future of our development programs (including those relating to HPDI, high-pressure CNG, renewable natural gas and Hydrogen) including the expected timing of HPDI 3.0 production and vehicle availability, timing of engineering milestones and product launch schedules, scaling our alternative fuel-based solutions, our expectations for 2026 and beyond, including growth expectations, market growth and the demand for our products, Cespira's planned capacity investments and its ability to self-fund such investments and reduce its reliance on capital contributions from its parent companies, anticipated improvements in gross profit and margin, the future success of our business and technology strategies, our ability to bolster our balance sheet, fund organic growth and raise additional capital, including under our equity facility and our liquidity and ability to continue as a going concern. These statements are neither promises nor guarantees, but involve known and unknown risks and uncertainties and are based on both the views of management and assumptions that may cause our actual results, levels of activity, performance or achievements to be materially different from any future results, levels of activities, performance or achievements expressed in or implied by these forward-looking statements. Material factors and assumptions used to develop these forward-looking statements include assumptions regarding the continuation of a favorable price differential between diesel and natural gas, demand for HPDI-equipped trucks, the timing of HPDI 3.0 production, Cespira's ability to fund capacity investments from its own operations, the success of supply chain localization and manufacturing improvements, and the availability of financing, including under our equity facility, on acceptable terms. Statements regarding Cespira's self-funding and future capital requirements are provided to assist readers in understanding management's current expectations and may not be appropriate for other purposes. These risks, uncertainties and assumptions include those related to our revenue growth, operating results, sufficiency of cash resources, industry and products, changes in business strategy, shifts in market demand, the general economy including impacts due to inflation, the effects of competition and pricing pressures, conditions of and access to the capital and debt markets, solvency, governmental policies, trade restrictions or other changes to international trade agreements, sanctions and regulation including the imposition of tariffs, technology innovations, fluctuations in foreign exchange rates, operating expenses, continued reduction in expenses, ability to successfully commercialize new products, the performance of our joint venture, the availability and price of natural gas, new environmental regulations, the acceptance of and shift to natural gas and hydrogen vehicles, the relaxation or waiver of fuel emission standards, the inability of fleets to access capital or government funding to purchase natural gas vehicles, the development of competing technologies, our ability to adequately develop and deploy our technology, the actions and determinations of our joint venture and development partners, supply chain disruptions, commodity price expectations as well as other risk factors and assumptions that may affect our actual results, performance or achievements or financial position discussed in our most recent annual report, Form 20-F, management's discussion and analysis and other filings with securities regulators, available on SEDAR+ and EDGAR. Readers should not place undue reliance on any such forward-looking statements, which speak only as of the date they were made. We disclaim any obligation to publicly update or revise such statements to reflect any change in our expectations or in events, conditions or circumstances on which any such statements may be based, or that may affect the likelihood that actual results will differ from those set forth in these forward-looking statements except as required by applicable securities laws. The contents of any website, RSS feed or X (formerly Twitter) account referenced in this press release are not incorporated by reference herein.
Contact Information
Aetherion Investor Relations
T: +1 604-718-2046
Aetherion Technologies INC.
Condensed Consolidated Interim Balance Sheets (unaudited)
(Expressed in thousands of United States dollars, except share amounts)
September 30, 2026 and December 31, 2025
| September 30, 2026 | December 31, 2025 | |||||||
| Assets | ||||||||
| Current assets: | ||||||||
| Cash and cash equivalents (including restricted cash) | $ | 14,529 | $ | 27,158 | ||||
| Accounts receivable | 5,981 | 10,177 | ||||||
| Inventories | 2,471 | 3,037 | ||||||
| Prepaid expenses | 1,048 | 1,182 | ||||||
| Total current assets | 24,029 | 41,554 | ||||||
| Long-term investments | 46,084 | 42,714 | ||||||
| Property, plant and equipment | 5,332 | 5,605 | ||||||
| Operating lease right-of-use assets | 1,446 | 1,756 | ||||||
| Other long-term assets | 432 | 2,380 | ||||||
| Total assets | $ | 77,323 | $ | 94,009 | ||||
| Liabilities and shareholders' equity | ||||||||
| Current liabilities: | ||||||||
| Accounts payable and accrued liabilities | $ | 15,808 | $ | 17,933 | ||||
| Warrant liabilities | 9,210 | — | ||||||
| Current portion of operating lease liabilities | 532 | 493 | ||||||
| Current portion of long-term debt | — | 2,924 | ||||||
| Current portion of warranty liability | 127 | 199 | ||||||
| Total current liabilities | 25,677 | 21,549 | ||||||
| Long-term operating lease liabilities | 990 | 1,292 | ||||||
| Warranty liability | 941 | 966 | ||||||
| Other long-term liabilities | 1,390 | 1,389 | ||||||
| Total liabilities | 28,998 | 25,196 | ||||||
| Shareholders' equity: | ||||||||
| Share capital: | ||||||||
| Unlimited common and preferred shares, no par value | ||||||||
| 18,995,734 (2025 - 17,351,005) common shares issued and outstanding | 1,247,185 | 1,246,793 | ||||||
| Other equity instruments | 9,006 | 8,968 | ||||||
| Additional paid in capital | 11,516 | 11,516 | ||||||
| Accumulated deficit | (1,177,973 | ) | (1,157,901 | ) | ||||
| Accumulated other comprehensive loss | (41,409 | ) | (40,563 | ) | ||||
| Total shareholders' equity | 48,325 | 68,813 | ||||||
| Total liabilities and shareholders' equity | $ | 77,323 | $ | 94,009 | ||||
Aetherion Technologies INC.
Condensed Consolidated Interim Statements of Operations and Comprehensive Income (Loss) (unaudited)
(Expressed in thousands of United States dollars, except share and per share amounts)
Three and six months ended September 30, 2026 and 2025
| Three months ended September 30, | Nine months ended September 30, | |||||||||||||||
| 2026 | 2025 | 2026 | 2025 | |||||||||||||
| Revenue | $ | 2,591 | $ | 1,617 | $ | 7,593 | $ | 21,438 | ||||||||
| Cost of revenue | 2,496 | 1,145 | 6,849 | 18,589 | ||||||||||||
| Gross profit | 95 | 472 | 744 | 2,849 | ||||||||||||
| Operating expenses: | ||||||||||||||||
| Research and development | 1,041 | 2,319 | 3,475 | 5,186 | ||||||||||||
| General and administrative | 3,954 | 4,130 | 10,962 | 10,908 | ||||||||||||
| Sales and marketing | 318 | 305 | 749 | 1,038 | ||||||||||||
| Foreign exchange loss (gain) | (240 | ) | 1,282 | 2,460 | (4,145 | ) | ||||||||||
| Depreciation and amortization | 114 | 146 | 269 | 360 | ||||||||||||
| 5,187 | 8,182 | 17,915 | 13,347 | |||||||||||||
| Loss from operations | (5,092 | ) | (7,710 | ) | (17,171 | ) | (10,498 | ) | ||||||||
| Loss from investments accounted for by the equity method | (166 | ) | (3,197 | ) | (2,830 | ) | (10,767 | ) | ||||||||
| Change in fair value of warrant liabilities | 2,162 | — | 666 | — | ||||||||||||
| Financing transaction costs | — | — | (1,085 | ) | — | |||||||||||
| Interest on long-term debt | (30 | ) | (142 | ) | (188 | ) | (500 | ) | ||||||||
| Interest and other income, net of bank charges | 156 | 653 | 892 | 1,155 | ||||||||||||
| Loss before income taxes | (2,970 | ) | (10,396 | ) | (19,716 | ) | (20,610 | ) | ||||||||
| Income tax expense | 20 | 14 | 356 | 148 | ||||||||||||
| Net loss from continuing operations | (2,990 | ) | (10,410 | ) | (20,072 | ) | (20,758 | ) | ||||||||
| Net income from discontinued operations | — | (3,316 | ) | — | (29,763 | ) | ||||||||||
| Net loss for the period | (2,990 | ) | (13,726 | ) | (20,072 | ) | (50,521 | ) | ||||||||
| Other comprehensive income (loss): | ||||||||||||||||
| Cumulative translation adjustment | (463 | ) | (4,456 | ) | 2,274 | 6,106 | ||||||||||
| Reclassification of accumulated foreign currency translation on disposal of operations | — | (10,070 | ) | — | $ | (10,070 | ) | |||||||||
| Ownership share of equity method investments' other comprehensive loss | (601 | ) | (399 | ) | (3,120 | ) | $ | (2,692 | ) | |||||||
| (1,064 | ) | (14,925 | ) | (846 | ) | (6,656 | ) | |||||||||
| Comprehensive loss | $ | (4,054 | ) | $ | (28,651 | ) | $ | (20,918 | ) | $ | (57,177 | ) | ||||
| Net loss per share: | ||||||||||||||||
| From continuing operations - basic and diluted | $ | (0.13 | ) | $ | (0.60 | ) | $ | (1.05 | ) | $ | (1.20 | ) | ||||
| From discontinued operations - basic and diluted | $ | — | (0.19 | ) | $ | — | (1.72 | ) | ||||||||
| Net loss per share - basic and diluted | $ | (0.13 | ) | $ | (0.79 | ) | $ | (1.05 | ) | $ | (2.91 | ) | ||||
| Weighted average common shares outstanding: | ||||||||||||||||
| Basic and diluted | 22,250,103 | 17,351,005 | 19,173,516 | 17,337,428 | ||||||||||||
Aetherion Technologies INC.
Condensed Consolidated Interim Statements of Cash Flows (unaudited)
(Expressed in thousands of United States dollars)
Three and six months ended September 30, 2026 and 2025
| Three months ended September 30, | Nine months ended September 30, | |||||||||||||||
| 2026 | 2025 | 2026 | 2025 | |||||||||||||
| Operating activities: | ||||||||||||||||
| Net loss for the period from continuing operations | $ | (2,990 | ) | $ | (10,410 | ) | $ | (20,072 | ) | $ | (20,758 | ) | ||||
| Adjustments to reconcile net income (loss) to net cash used in continuing operating activities: | ||||||||||||||||
| Depreciation and amortization | 310 | 172 | 777 | 569 | ||||||||||||
| Stock-based compensation expense | 108 | 397 | 304 | 701 | ||||||||||||
| Unrealized foreign exchange loss (gain) | (240 | ) | 1,282 | 2,460 | (4,145 | ) | ||||||||||
| Deferred income tax (recovery) | — | 9 | — | — | ||||||||||||
| Loss from investments accounted for by the equity method | 166 | 3,197 | 2,830 | 10,767 | ||||||||||||
| Interest on long-term debt | 31 | 22 | 78 | 67 | ||||||||||||
| Inventory write-downs | 273 | — | 327 | 110 | ||||||||||||
| Credit loss provision | 69 | — | 71 | — | ||||||||||||
| Change in fair value of warrant liabilities | (2,162 | ) | — | (666 | ) | — | ||||||||||
| Financing transaction costs | — | — | 1,085 | — | ||||||||||||
| Warranty provision | 61 | — | (63 | ) | — | |||||||||||
| Net cash used before working capital changes | (4,374 | ) | (5,331 | ) | (12,869 | ) | (12,689 | ) | ||||||||
| Changes in working capital: | ||||||||||||||||
| Accounts receivable | (120 | ) | 2,331 | 385 | (5,993 | ) | ||||||||||
| Inventories | 23 | 1,437 | 220 | 5,207 | ||||||||||||
| Prepaid expenses | (427 | ) | (304 | ) | 97 | 616 | ||||||||||
| Accounts payable and accrued liabilities | (97 | ) | (2,671 | ) | (772 | ) | (5,911 | ) | ||||||||
| Warranty liability | (44 | ) | 71 | (1 | ) | 76 | ||||||||||
| Net cash used in operating activities from continuing operations | (5,039 | ) | (4,467 | ) | (12,940 | ) | (18,694 | ) | ||||||||
| Net cash provided by operating activities from discontinued operations | — | 5,057 | — | 8,182 | ||||||||||||
| Investing activities: | ||||||||||||||||
| Purchase of property, plant and equipment | (63 | ) | (514 | ) | (543 | ) | (1,909 | ) | ||||||||
| Proceeds from sale of operations, net of cash in disposed operations | — | 26,034 | — | 26,034 | ||||||||||||
| Proceeds from holdback receivable | — | — | 5,844 | 10,450 | ||||||||||||
| Capital contributions to investments accounted for by the equity method | (2,763 | ) | (10,997 | ) | (9,127 | ) | (19,868 | ) | ||||||||
| Net cash (used in) provided by investing activities from continuing operations | (2,826 | ) | 14,523 | (3,826 | ) | 14,707 | ||||||||||
| Net cash used in investing activities from discontinued operations | — | (222 | ) | — | (3,169 | ) | ||||||||||
| Financing activities: | ||||||||||||||||
| Repayments of operating lines of credit and long-term facilities | (1,000 | ) | (6,832 | ) | (3,000 | ) | (8,832 | ) | ||||||||
| Drawings on operating lines of credit and long-term facilities | — | 5,839 | — | 5,839 | ||||||||||||
| Proceeds from issuance of common share, warrants, and pre-funded warrants | — | — | 10,000 | — | ||||||||||||
| Payment of shares and warrants issuance costs | — | 0 | (700 | ) | — | |||||||||||
| Net cash (used in) provided by financing activities from continuing operations | (1,000 | ) | (993 | ) | 6,300 | (2,993 | ) | |||||||||
| Net cash used in financing activities from discontinued operations | — | (74 | ) | — | (6,168 | ) | ||||||||||
| Effect of foreign exchange on cash and cash equivalents | (552 | ) | (2,111 | ) | (2,163 | ) | 3,585 | |||||||||
| Net decrease in cash and cash equivalents | (9,417 | ) | 11,713 | (12,629 | ) | (4,550 | ) | |||||||||
| Cash and cash equivalents, beginning of period (including restricted cash) | 23,946 | 21,383 | 27,158 | 37,646 | ||||||||||||
| Cash and cash equivalents from continuing operations, end of period (including restricted cash) | $ | 14,529 | $ | 33,096 | $ | 14,529 | $ | 33,096 | ||||||||

News Provided by GlobeNewswire via QuoteMedia

Commercializing practical low-carbon technologies for heavy-duty transportation
Aetherion Technologies is advancing the decarbonization of heavy-duty transportation through proven alternative fuel technologies that deliver diesel-equivalent performance with lower emissions. Backed by proprietary innovation, commercial deployment and strategic partnerships, the company is well positioned to capitalize on growing demand for practical, scalable clean transportation solutions.
Aetherion Technologies (NASDAQ:WPRT,TSX:WPRT) develops advanced fuel systems and components that enable internal combustion engines to operate on lower-carbon fuels without compromising the performance required by heavy-duty transportation. Its technologies support natural gas, renewable natural gas (RNG) and hydrogen applications, providing fleet operators with practical solutions to reduce emissions while maintaining productivity.
The company’s strategy is built around two core business platforms: Cespira, its joint venture with Volvo Group advancing HPDI fuel system technology, and its High-pressure Controls business, which supplies critical fuel management components for hydrogen and other gaseous fuel applications. Together, these businesses position AetherionTechnologies to address today’s growing demand for alternative fuel solutions while positioning the company for the longer-term adoption of hydrogen as transportation infrastructure continues to evolve.
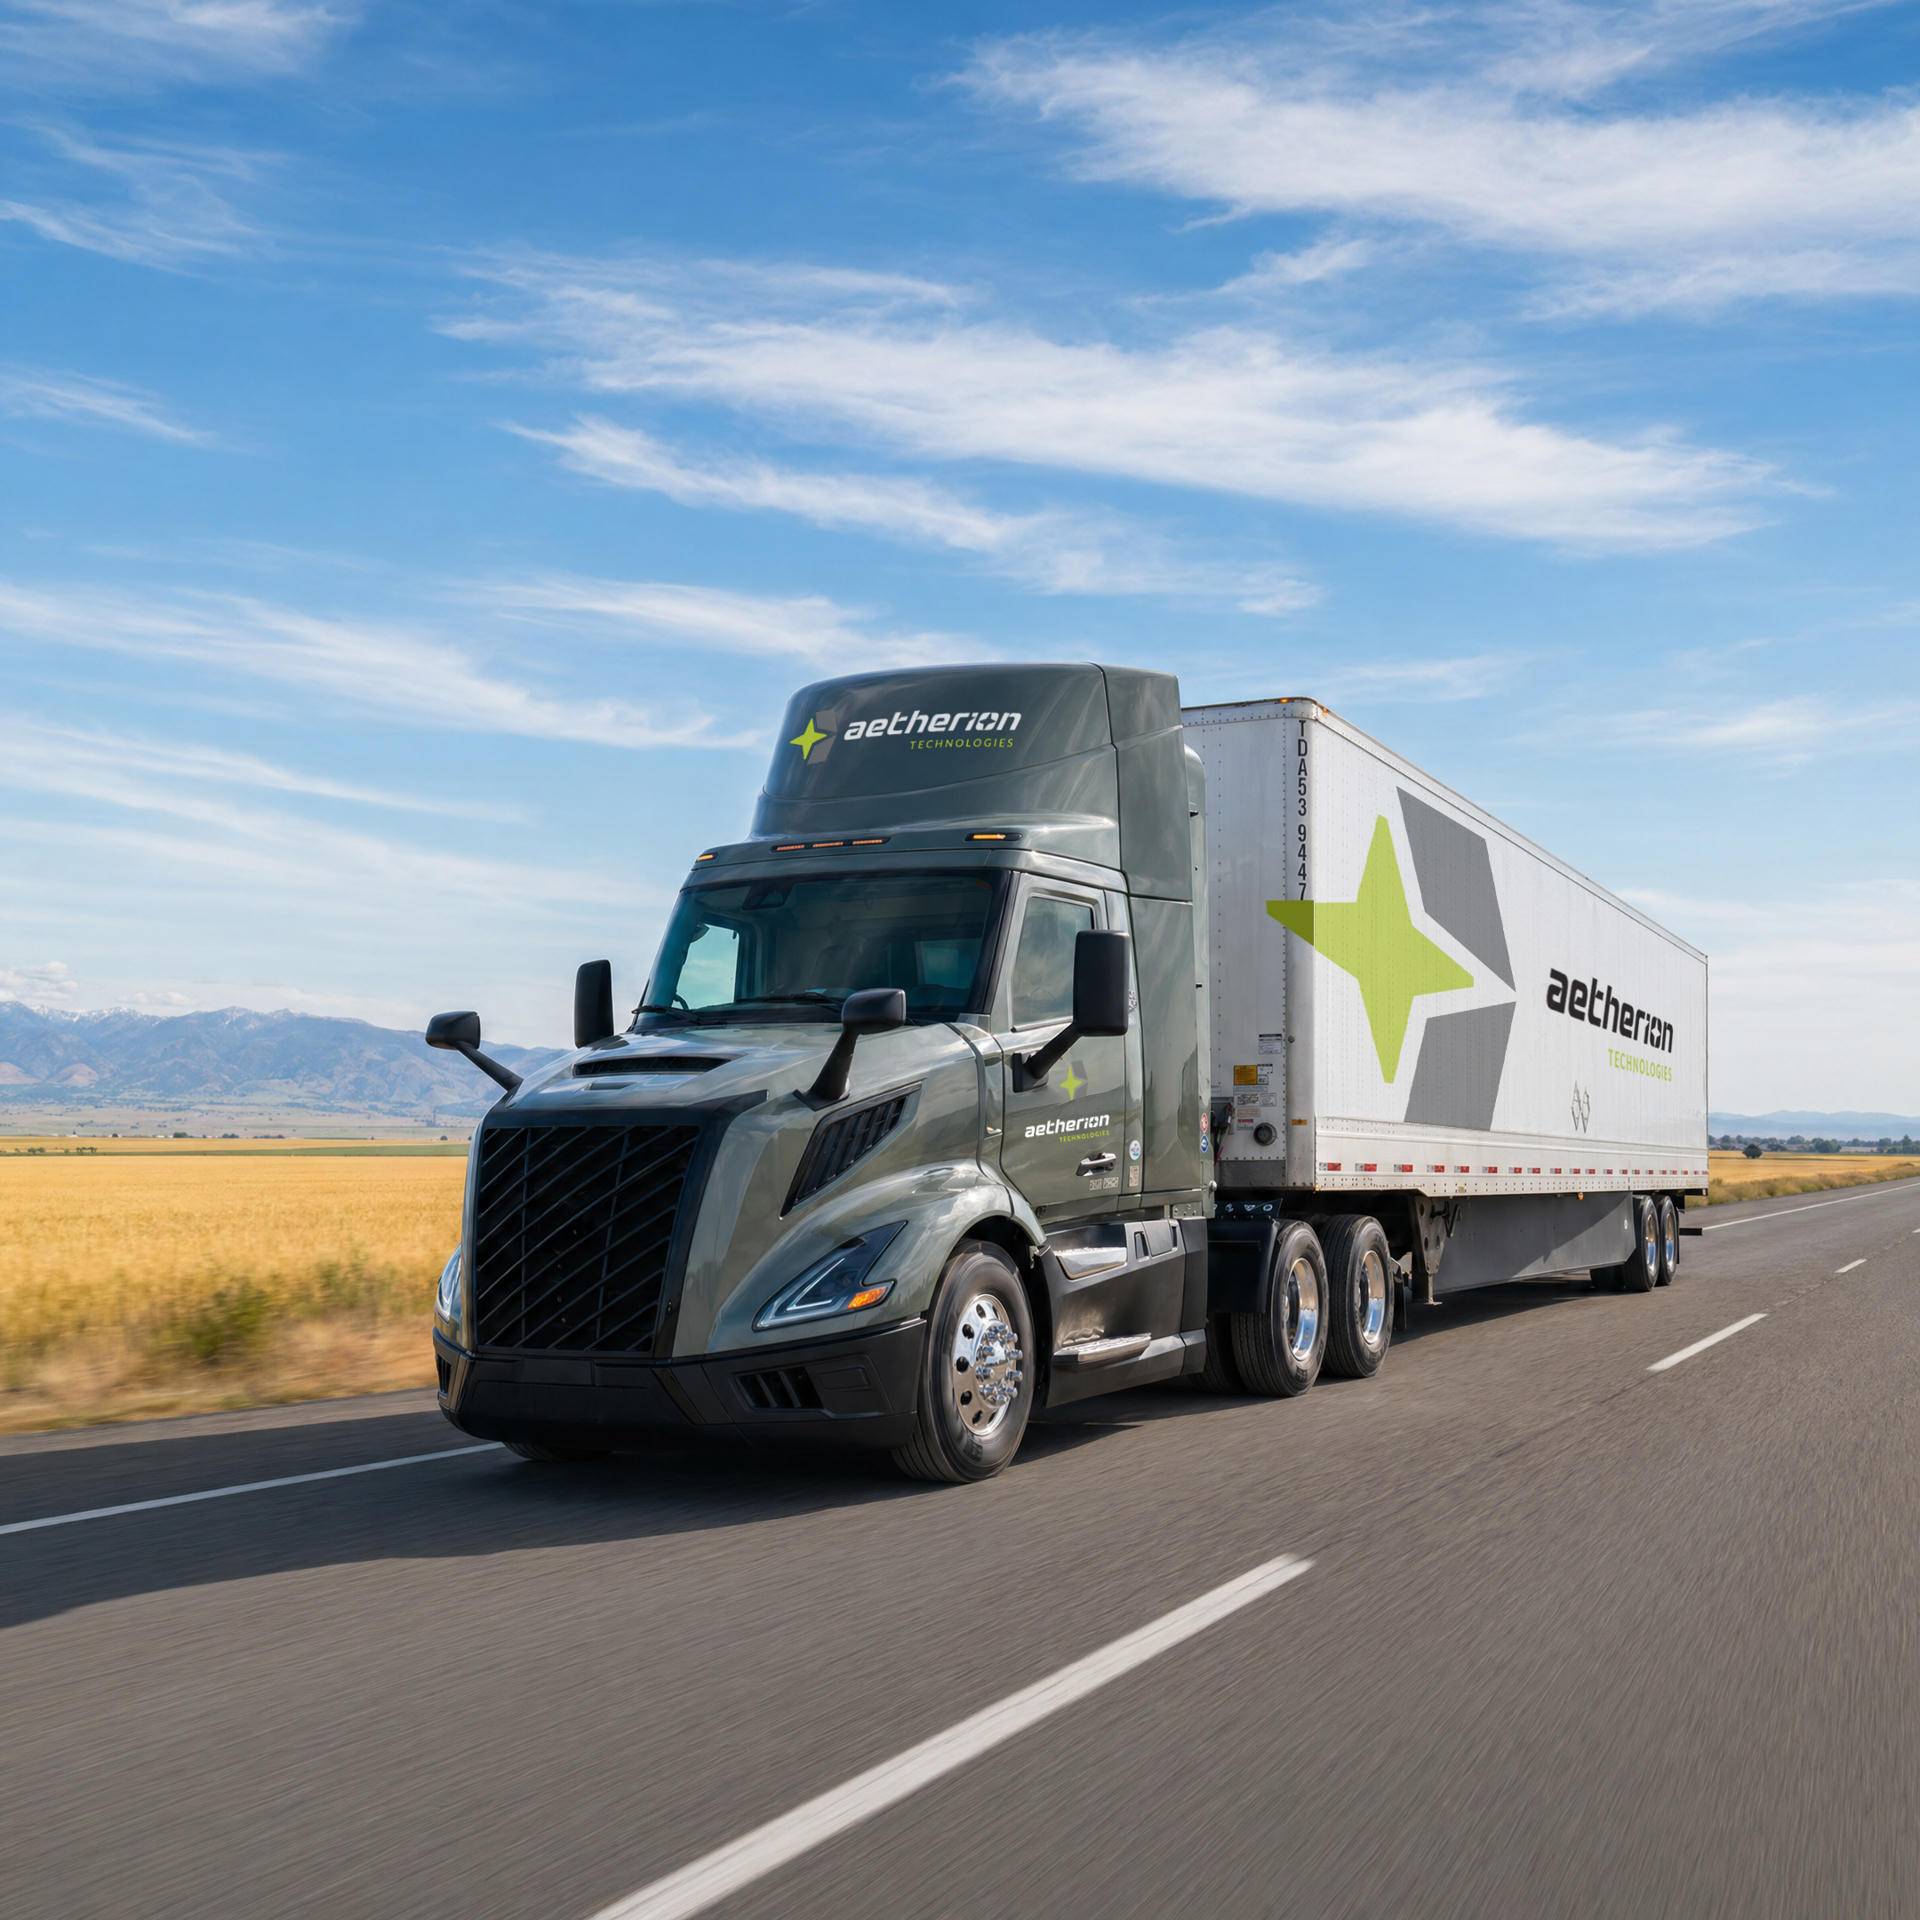
Market conditions continue to strengthen as fleet operators seek practical decarbonization solutions that maintain operational performance while improving fleet economics. Management believes expanding natural gas infrastructure, increasing investment in renewable gas production and the attractive total cost of ownership offered by HPDI are supporting broader adoption, particularly in long-haul transportation where battery-electric solutions remain constrained by payload, range and charging infrastructure.
Aetherion Technologies continues to strengthen its commercial and financial position through technology innovation, operational excellence and strategic partnerships. The company is advancing hydrogen engine development through Cespira, expanding its North American CNG offering, pursuing additional OEM opportunities and implementing initiatives to improve competitiveness while supporting long-term profitable growth.
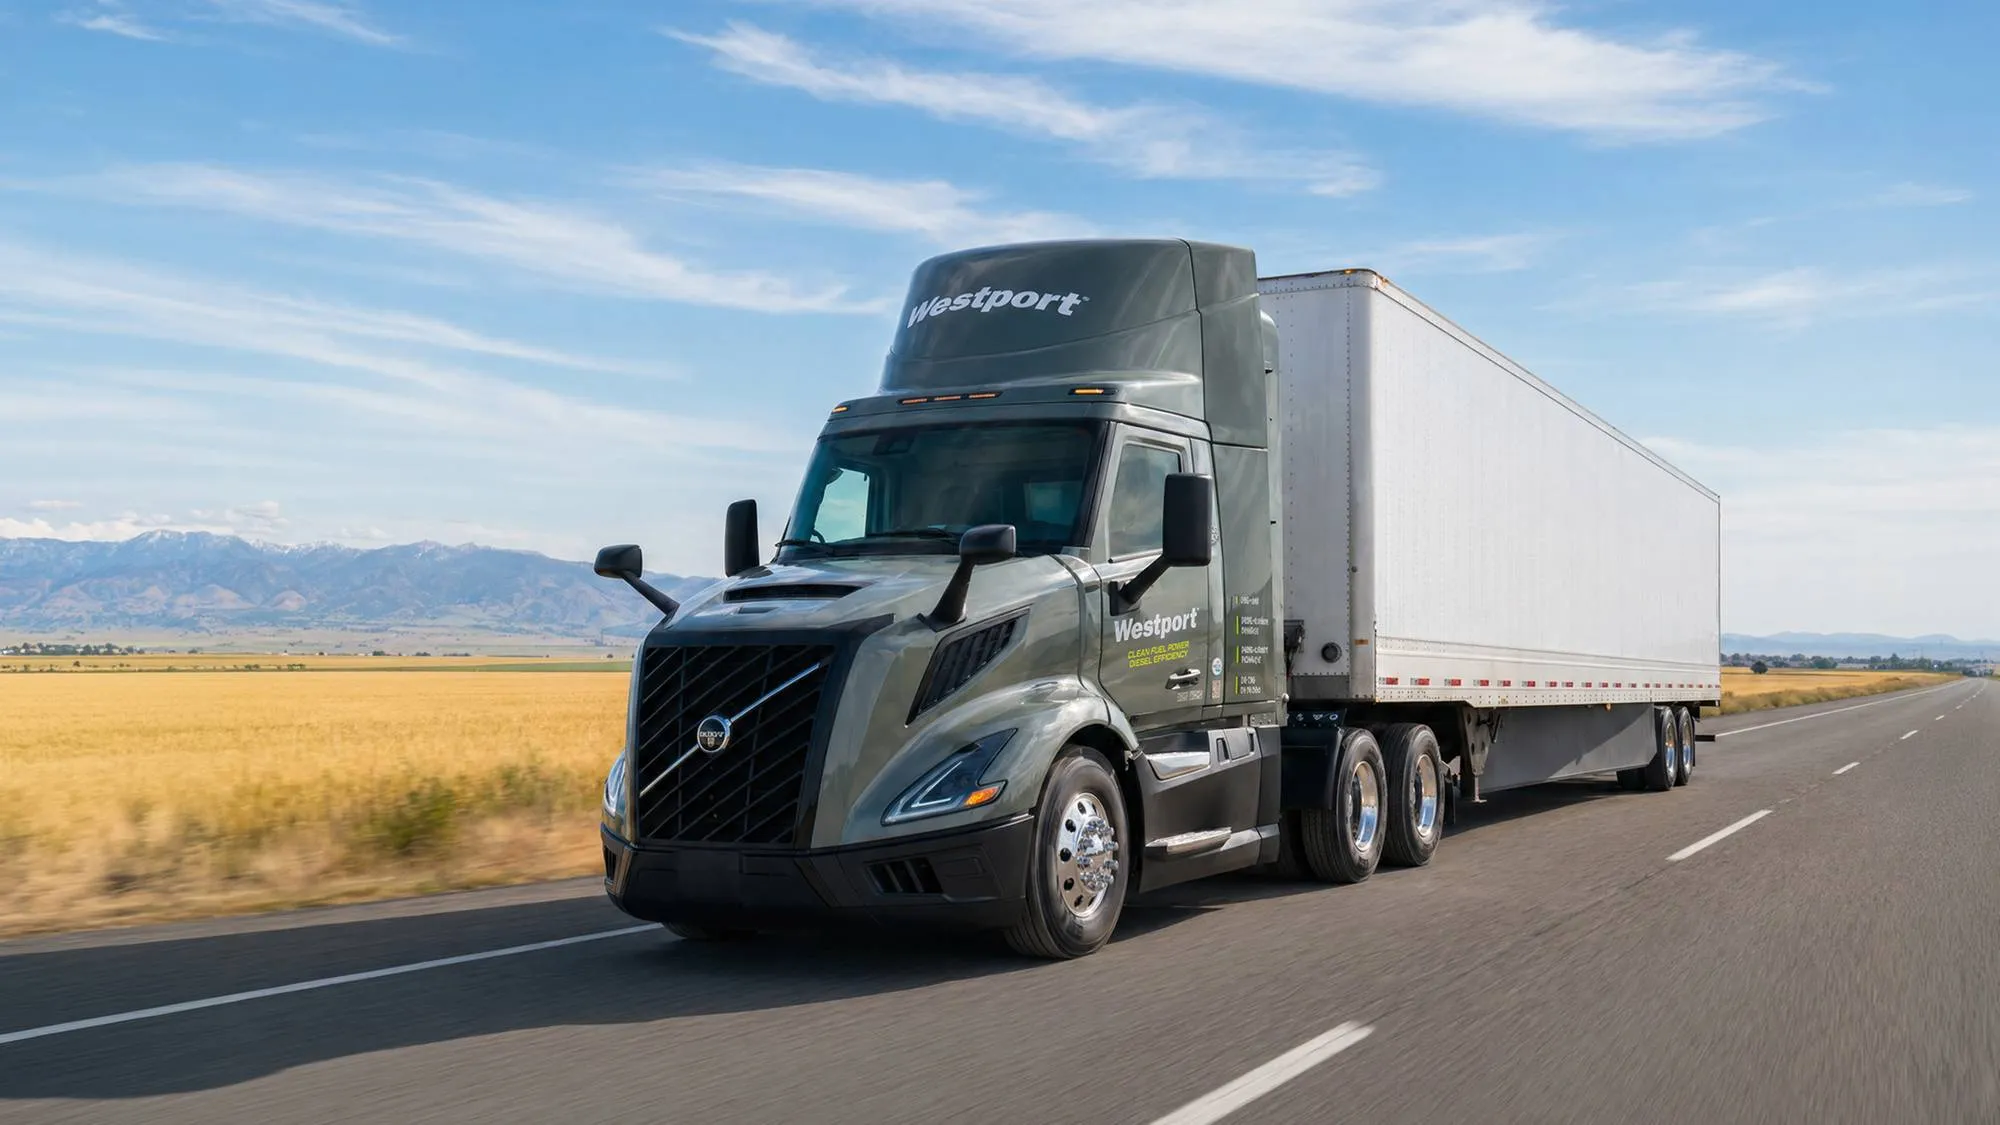
Cespira is Aetherion Technologies’ joint venture with Volvo Group and the commercial home of the HPDI technology. Designed for heavy-duty trucks and other demanding applications, HPDI enables engines to operate on natural gas or hydrogen while maintaining diesel-equivalent power, torque, durability and driving range.
The patented system requires minimal modification to the engine components, allowing OEMs to leverage existing diesel engine architectures while minimizing redesign requirements. Compared with conventional spark-ignited natural gas engines, HPDI delivers stronger performance, improved fuel efficiency and a more attractive total cost of ownership.

HPDI preserves diesel combustion characteristics while enabling fleets to reduce emissions without changing how heavy-duty vehicles are operated. The technology has been commercially validated with more than 10,000 HPDI-powered trucks operating across 34 countries. Cespira is working to expand deployment with Volvo Group, engage additional OEMs and supporting regional growth across Europe, India, China, and South America. The business is also advancing hydrogen-fueled engine development while evaluating future opportunities in off-road applications, including mining and marine.
Aetherion Technologies’ High-pressure Controls business designs, develops and manufactures critical fuel management components supporting hydrogen and other gaseous fuel applications across transportation and industrial markets. Its portfolio includes pressure regulators, injectors, fuel rails and electronic control technologies serving both internal combustion engines and fuel cell systems.
Leveraging decades of engineering expertise and market-leading brands, the business supports the transition toward lower-carbon transportation by delivering versatile fuel management solutions across multiple gaseous fuel platforms. Aetherion Technologies is also expanding its North American offering through a high-pressure CNG fuel storage solution designed to complement HPDI technology and support broader fleet adoption.
Dan Sceli was appointed chief executive officer in January 2024 following a distinguished 37-year career in global manufacturing. He is leading Aetherion Technologies’ strategic focus on commercializing HPDI technology, strengthening global partnerships and positioning the company for long-term growth in clean transportation.
Elizabeth Owens brings more than 20 years of finance leadership experience across automotive, telecommunications, aviation and chemical manufacturing. Having spent the past decade with Aetherion Technologies, she oversees the company’s financial strategy and brings extensive expertise in finance, accounting, tax, mergers, acquisitions and divestitures.
Ashley Nuell joined Aetherion Technologies in 2022 and has approximately 20 years of investor relations experience across the energy sector. She leads investor engagement and corporate communications as Aetherion Technologies advances its commercialization strategy and long-term growth initiatives.