Power Metals' Rare Find: Cesium

Power Metals Corp. (" Power Metals " or the " Company ") (TSXV: PWM) (FRANKFURT: OAA1) (OTCQB: PWRMF) is pleased to comment and provide information to its recent banner press release on Oct. 13 th 2022. Power Metals is extremely thrilled with the recently announced high-grade cesium discovery in the West Joe Dyke at the Company's 100% owned Case Lake Property in Cochrane Ontario. The cesium (Cs) mineralization is enclosed in lithium (Li) and tantalum (Ta) mineralization to make West Joe a three-commodity deposit. The ongoing 2022 drill program intersected 24.07% Cs 2 O over 1.0 m and 7.65% Cs 2 O and 1.45% Li 2 O over 7.09 m additional the lithium mineralization is the highest found at Case Lake with 4.75% Li 2 O, 2.71% Cs 2 O and 396 ppm Ta over 2.0 m in white to pink coarse-grained spodumene.

Power Metals Corp. Logo (CNW Group/POWER METALS CORP)

In January of this year, world-leader Sinomine Resource Group ("Sinomine") joined Power Metals Corp. with a sizable investment after Power Metals' initial discovery of cesium during the 2018-2019 drilling campaign (PWM press release dated November 13 , 2018).  Sinomine currently owns two of the three occurrences of cesium that have been commercially mined, making them the ideal partner for Power Metals Corp.

Johnathan More , Chairman & CEO of Power Metals stated, "Sinomine's involvement with Power Metals is very strategic to both parties. There is a direct railway line from the town of Cochrane to the Tanco mine. Most importantly Sinomine has been involved in all areas of past cesium production around the world. Additionally, we are still waiting for several more assays currently at the lab and will be releasing them as soon as they are available."

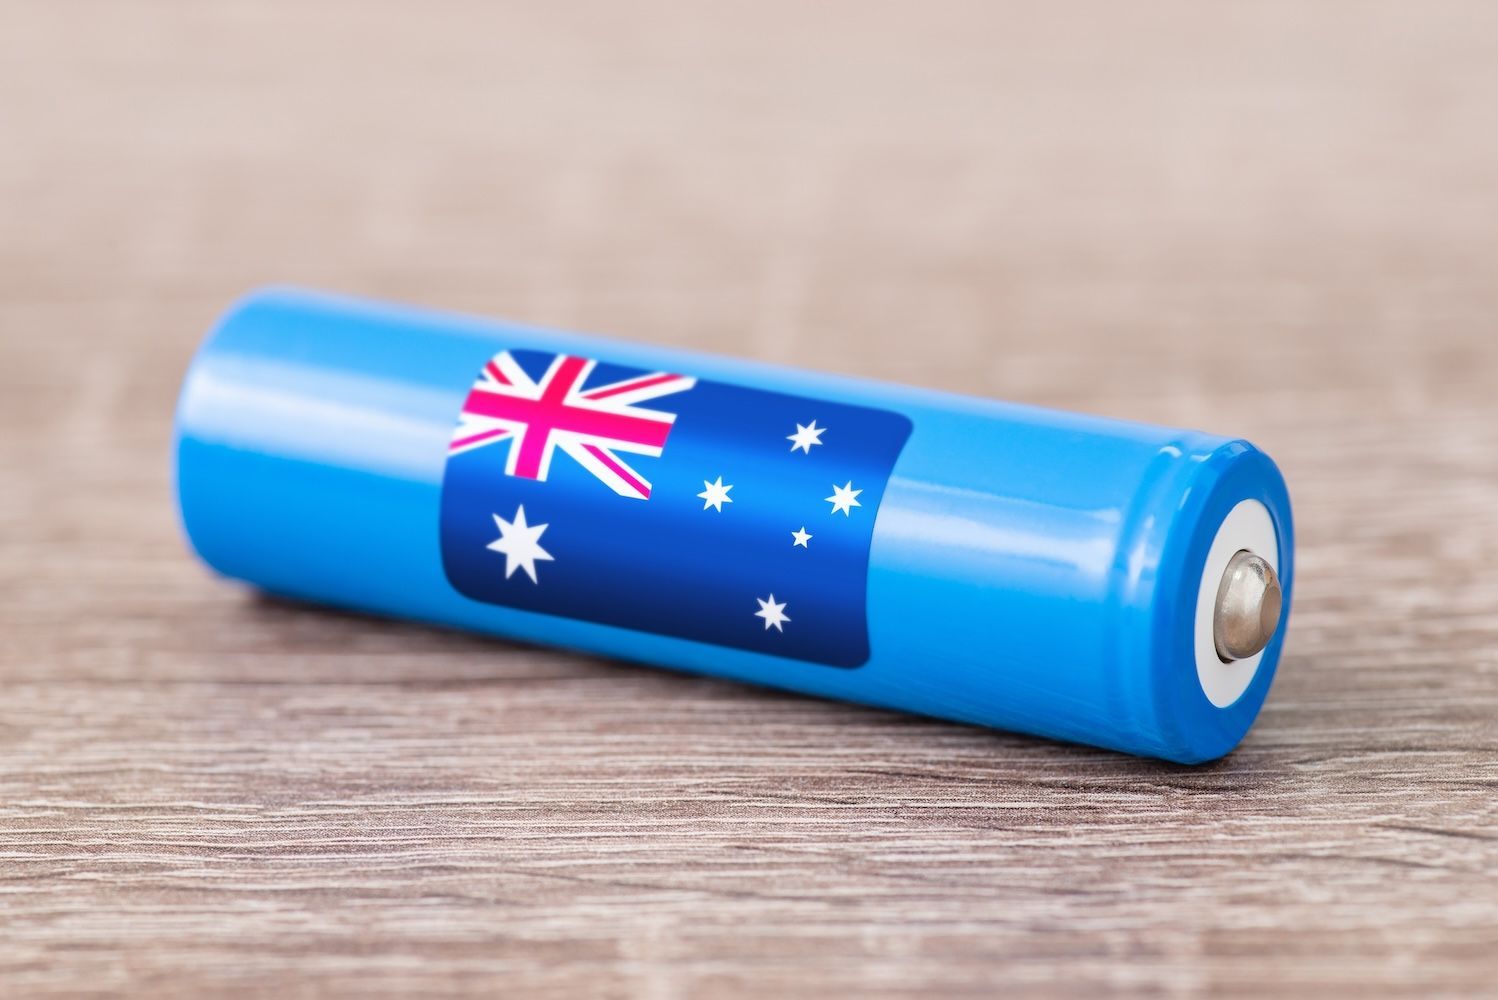
The West Joe pollucite zone has Cs grades similar to that of Sinclair cesium mine, Australia now held by Essential Metals Limited (ASX: ESS). In addition to the Cs grade, West Joe has the advantages that the pollucite has shallow depths of less than 50 m below surface and road access to make it easy for future extraction. Another advantage of West Joe is that it has three economic commodities in the same zone: lithium, cesium and tantalum. Canadian, Ontario and United States governments have labelled all three commodities as critical metals.

What is Cesium?

Cesium is a chemical element with the symbol Cs and atomic number in the periodic table. The ore mineral of Cesium is pollucite, a Cs aluminum silicate mineral.

Why is Cesium so rare?

Pollucite crystallizes in highly fractionated lithium pegmatite dykes. Very few pegmatites are evolved enough to contain crystals of pollucite. There are only five recorded occurrences of pollucite in Ontario of which Power Metals owns three occurrences: West Joe Dyke on Case Lake Property, Marko's pegmatite on Paterson Lake Property and Tot Lake pegmatite on Gullwing-Tot Lakes Property.

Globally, there are three occurrences for cesium that have been commercially mined: Tanco pegmatite mine, Manitoba, Canada , Bikita pegmatite mine, Zimbabwe and Sinclair mine, Australia . The Tanco underground mine has been in operation since the late 1960's. Tanco is mined for tantalum (Ta) ore concentrates, pyroceramic spodumene (Li), pollucite (Cs) and rubidium (Rb). The pollucite is processed on site to produce cesium formate fluid as a heavy mud for offshore oil drilling in the North Sea. Sinomine Resources Group bought the Tanco mine from Cabot Corporation in 2019 including the underground room and pillar mine, spodumene concentrator mill and cesium chemical processing facility and the mine which employs about 100 workers.

The Bikita mine, Masvingo Province, Zimbabwe has been in operation since 1950. Its main products are technical grade petalite concentrates (Li ore) used in glass and ceramics and pollucite (Cs ore). Sinomine Resources Group bought the Bikita open pit mine in January 2022 . Sinomine plans to produce spodumene, to build a plant and expand the existing mining operations at Bikita.

The Sinclair mine, Western Australia was drilled by Pioneer Resources Limited (ASX: PIO) ("Pioneer") in 2016 for petalite (Li ore) and pollucite was discovered and confirmed in November 2016 (Pioneer Resources press release dated Nov. 14 , 2016).  Pioneer announced that it entered into an offtake agreement with Cabot Corporation ("Cabot") to buy 100% of the cesium ore extracted from Sinclair Zone (press release dated June 20, 2018 ). Sinclair mine was Australia's first ever commercial cesium producer. Pioneer announced on 22 January 2019 that approximately 19,000 tonnes of pollucite-bearing rock with an average grade of 9.1% Cs 2 O has been mined and crushed, to be sold within a specification under the Offtake and Loan arrangement in place with Cabot. Cabot received the first shipment of cesium in April 2019 at the Tanco mine (press release Apr. 17, 2019 ). Pioneer entered into a separate sales agreement and off-take with Sinomine Specialty Fluids for 7,300 tonnes of ore with an estimated average grade of 4.5% Cs 2 O consisting of pollucite, lepidolite and quartz (press release March 16, 2020 ).

What is Cesium used for?

The primary use of the cesium mined at Tanco, Manitoba is for cesium formate brines used for high pressure, high temperature well drilling for oil and gas. Cesium bromide is used in infrared detectors, optics, photoelectric cells, scintillation counters and spectrometers (United States Geological Survey Mineral Commodity Summaries 2022). Cesium isotopes are used in atomic resonance frequency in standard atomic clocks which play a vital role in aircraft guidance systems, global positioning satellites and internet and cellular telephone transmissions (USGS Mineral Commodity Summaries 2022).

What is the price of Cesium?

Pioneer sold 19,000 tonnes of pollucite ore with an average grade of 9.1 % Cs 2 O from the Sinclair mine for an expected total of A$17.4 million between Jan and Nov. 2019 , excluding the sales of the low-grade material (press release dated Sep. 11, 2019 ).

Pioneer sold 7,300 tonnes of pollucite ore with an estimated average grade of 4.5 % Cs 2 O for approximately $1.2 million from its Sinclair mine (press release dated March 16, 2020 ).

Dr. Julie Selway , VP of Exploration commented, "Power Metals is excited to have such a rare critical mineral on the Case Lake Property and the ore grade lithium and tantalum at shallow depths is an extra bonus."

Quality Control

The drill core was sampled so that 1 m of the Case Batholith tonalite host rock was sampled followed by 1 m long samples of the pegmatite dyke and 1 m of the Case Batholith. The sampling followed lithology boundaries so that only one lithology unit is within a sample, except for the Cochrane by Power Metals' geologists. The core was prepared at SGS Garson and analyzed at SGS Burnaby, British Columbia which has ISO 17025 certification. Every 20 samples included one external quartz blank, one external lithium standard and one core duplicate. The ore grade Li 2 O% was prepared by sodium peroxide fusion with analysis by ICP-OES with a detection limit of 0.002 % Li 2 O. A Quality Control review of the standards, blanks and core duplicates indicated that they all passed. The ore grade Cs 2 O% for > 10000 ppm Cs was prepared by alkaline metal digestion with analysis by FAAS with a detection limit of 0.002 % Cs. Ore grade cesium was analyzed by SGS Lakefield, Ontario which also has ISO 17025 certification.

Case Lake Property

Case Lake Property is located 80 km east of Cochrane , northeastern Ontario close to the Ontario - Quebec border. Case Lake Property consists of 585 cell claims in Steele, Case, Scapa, Pliny, Abbotsford and Challies townships, Larder Lake Mining Division. The Property is 10 km x 9.5 km in size with 14 identified tonalite domes. The Case Lake pegmatite swarm consists of six spodumene dykes: North, Main, South, East and Northeast Dykes on the Henry Dome and the West Joe Dyke on a new tonalite dome. The Case Lake Property is owned 100% by Power Metals Corp. A National Instrument 43-101 Technical Report has been prepared on Case Lake Property and filed on July 18, 2017 .

Qualified Person

Julie Selway , Ph.D., P.Geo. supervised the preparation of the scientific and technical disclosure in this news release. Dr. Selway is the VP of Exploration for Power Metals and the Qualified Person ("QP") as defined by National Instrument 43-101. Dr. Selway is supervising the exploration program at Case Lake. Dr. Selway completed a Ph.D. on granitic pegmatites in 1999 and worked for 3 years as a pegmatite geoscientist for the Ontario Geological Survey. Dr. Selway also has twenty-three scientific journal articles on pegmatites.

About Power Metals Corp.

Power Metals Corp. is a diversified Canadian mining company with a mandate to explore, develop and acquire high quality mining projects.  We are committed to building an arsenal of projects in both lithium and high-growth specialty metals and minerals. We see an unprecedented opportunity to supply the tremendous growth of the lithium battery and clean-technology industries. Learn more at www.powermetalscorp.com

ON BEHALF OF THE BOARD,

Johnathan More , Chairman & CEO

Neither the TSX Venture Exchange nor its Regulation Services Provider (as that term is defined in policies of the TSX Venture Exchange) accepts responsibility for the adequacy or accuracy of the content of this news release.

No securities regulatory authority has either approved or disapproved of the contents of this news release. The securities being offered have not been, and will not be, registered under the United States Securities Act of 1933, as amended (the "U.S. Securities Act"), or any state securities laws, and may not be offered or sold in the United States , or to, or for the account or benefit of, a "U.S. person" (as defined in Regulation S of the U.S. Securities Act) unless pursuant to an exemption therefrom. This press release is for information purposes only and does not constitute an offer to sell or a solicitation of an offer to buy any securities of the Company in any jurisdiction.

Cautionary Note Regarding Forward-Looking Information

This press release contains forward-looking information based on current expectations, including the use of funds raised under the Offering.  These statements should not be read as guarantees of future performance or results. Such statements involve known and unknown risks, uncertainties and other factors that may cause actual results, performance or achievements to be materially different from those implied by such statements. Although such statements are based on management's reasonable assumptions, Power Metals assumes no responsibility to update or revise forward-looking information to reflect new events or circumstances unless required by law.

Although the Company believes that the expectations and assumptions on which the forward-looking statements are based are reasonable, undue reliance should not be placed on the forward-looking statements because the Company can give no assurance that they will prove to be correct. Since forward-looking statements address future events and conditions, by their very nature they involve inherent risks and uncertainties. These statements speak only as of the date of this press release. Actual results could differ materially from those currently anticipated due to several factors and risks including various risk factors discussed in the Company's disclosure documents which can be found under the Company's profile on www.sedar.com .

This press release contains "forward-looking statements" within the meaning of Section 27A of the Securities Act of 1933, as amended, and Section 21E the Securities Exchange Act of 1934, as amended and such forward-looking statements are made pursuant to the safe harbor provisions of the Private Securities Litigation Reform Act of 1995. The TSXV has neither reviewed nor approved the contents of this press release.

SOURCE POWER METALS CORP

Cision View original content to download multimedia: https://www.newswire.ca/en/releases/archive/October2022/19/c1351.html

News Provided by Canada Newswire via QuoteMedia

PWM:CA
The Conversation (0)

Albemarle Reports First Quarter 2024 Results

Albemarle Corporation (NYSE: ALB), a global leader in providing essential elements for mobility, energy, connectivity and health, today announced its results for the first quarter ended March 31, 2024 .

Albemarle Corp. Logo. (PRNewsFoto/Albemarle Corporation)

First-Quarter 2024 and Recent Highlights
(Unless otherwise stated, all percentage changes represent year-over-year comparisons)

  • Net sales of $1.4 billion , driven by Energy Storage volume growth as projects ramp
  • Net income of $2 million , or ($0.08) (a) per diluted share attributable to common shareholders
  • Adjusted diluted EPS attributable to common shareholders of $0.26
  • Adjusted EBITDA (b) of $291 million
  • On track to deliver more than $280 million target in productivity benefits in 2024; in Q1, delivered over $90 million in productivity and restructuring cost savings
  • Conducted successful bidding events for spodumene concentrate and lithium carbonate, designed to promote price transparency and discovery
  • Achieved 50% operating rate milestone at Kemerton I; commissioning at Meishan and ramp of the Salar Yield Improvement Project continue to progress well
  • Reaffirmed FY 2024 corporate outlook considerations, including ranges based on lithium market price scenarios

(a)

After mandatory convertible preferred stock dividends

(b)

Beginning in 2024, Adjusted EBITDA definition includes Albemarle's share of the pre-tax earnings of the Talison joint venture

"In the first quarter, our team demonstrated agility in dynamic market conditions by continuing to deliver solid volumetric growth, ramping new conversion facilities, and executing cost reduction and productivity improvements," said Kent Masters, Albemarle's chairman and CEO. "We have strengthened our competitive position, enhanced our financial flexibility, and started to increase lithium market price transparency. Our actions best position us to serve our core end-markets today and for the future." Masters added, "We remain focused on disciplined capital allocation to deliver profitable organic growth and value for all stakeholders."

2024 Total Corporate Outlook Considerations
The company maintains its prior full-year outlook, which is based on three lithium market price scenarios.


Total Corporate FY 2024E

Including Energy Storage Scenarios

Observed market price case (a)

YE 2023

Q4 2023 average

H2 2023 average

Average lithium market price ($/kg LCE) (a)

~$15

~$20

~$25

Net sales

$5.5 - $6.2 billion

$6.1 - $6.8 billion

$6.9 - $7.6 billion

Adjusted EBITDA (b)(c)

$0.9 - $1.2 billion

$1.6 - $1.8 billion

$2.3 - $2.6 billion


(a)

Price represents blend of relevant Asia and China market indices for the periods referenced.

(b)

The company does not provide a reconciliation of forward-looking non-GAAP financial measures to the most directly comparable financial measures calculated and reported in accordance with GAAP, as the company is unable to estimate significant non-recurring or unusual items without unreasonable effort. See "Additional Information regarding Non-GAAP Measures" for more information.

(c)

Presented under updated adjusted EBITDA definition as of 2024. FY23 adjusted EBITDA under updated definition would be $3.5B. See Non-GAAP Reconciliations for further details.

2024 Other Corporate Outlook Considerations
Following the company's public offering of depository shares representing an interest in its mandatory convertible preferred stock, interest and financing expenses are expected to be at the low end of the previous range of $180 to $220 million . The change in weighted-average common shares outstanding (diluted) reflects the recently issued shares of mandatory convertible preferred stock on an as-converted basis. The change to the adjusted effective tax rate range is related to geographic income mix and is dependent on the assumption of lithium market price. All other corporate outlook considerations are unchanged.


Other Corporate FY 2024E

Capital expenditures

$1.6 - $1.8 billion

Depreciation and amortization

$580 - $660 million

Adjusted effective tax rate

(5%) - 27%

Corporate costs

$120 - $150 million

Interest and financing expenses

$180 - $210 million

Weighted-average common shares outstanding (diluted) (d)

135 - 139 million


(d)

Each quarter, Albemarle will report the more dilutive of either: 1) adding the underlying shares in the mandatory to the share count or 2) reducing Albemarle's net income to common shareholders by the mandatory dividend. The 20-day volume-weighted average common share price will be used in determining the underlying shares to be added to the share count.

First Quarter 2024 Results

In millions, except per share amounts

Q1 2024


Q1 2023


$ Change


% Change

Net sales

$    1,360.7


$    2,580.3


$   (1,219.5)


(47.3) %

Net income attributable to Albemarle Corporation

$           2.4


$    1,238.6


$   (1,236.1)


(99.8) %

Adjusted EBITDA (a)(b)

$       291.2


$    1,761.7


$   (1,470.5)


(83.5) %

Diluted (loss) earnings per share attributable to
common shareholders

$        (0.08)


$       10.51


$      (10.59)


(100.8) %

Non-recurring and other unusual items (a)

0.34


(0.19)


Adjusted diluted earnings per share attributable to
common shareholders
(a)(c)

$         0.26


$       10.32


$      (10.06)


(97.5) %


(a)

See Non-GAAP Reconciliations for further details.

(b)

For comparability, 2023 figures presented under adjusted EBITDA definition that the company adopted beginning in 2024.

(c)

Totals may not add due to rounding.

Net sales for the first quarter of 2024 were $1.4 billion compared to $2.6 billion for the prior-year quarter, a year-over-year decline of 47% that was driven primarily by lower pricing in Energy Storage. Net income attributable to Albemarle of $2 million decreased by $1.2 billion and adjusted EBITDA of $291 million declined by $1.5 billion from the prior-year quarter. The decline in earnings was primarily due to lower lithium market pricing, as well as additional margin compression due to inventory timing and reduced equity earnings at the Talison joint venture, which more than offset favorable volumes.

The effective income tax rate for the first quarter of 2024 was 2.2% compared to 23.9% in the same period of 2023. On an adjusted basis, the effective income tax rates were (12.4)% and 23.6% for the first quarter of 2024 and 2023, respectively, with the decrease primarily due to changes in the geographic income mix.

Energy Storage Results

In millions

Q1 2024


Q1 2023


$ Change


% Change

Net Sales

$           800.9


$        1,943.7


$       (1,142.8)


(58.8) %

Adjusted EBITDA

$           198.0


$        1,567.7


$       (1,369.7)


(87.4) %

Energy Storage net sales for the first quarter of 2024 were $801 million , a decrease of $1.1 billion , or 59%, due to lower pricing (-89%), which more than offset higher volumes (+31%) related to the ramp of lithium projects, including the La Negra III/IV expansion in Chile and the processing plant in Qinzhou, China , and sales of chemical-grade spodumene. Adjusted EBITDA of $198 million decreased $1.4 billion , driven by lower lithium market pricing, as well as margin compression due to inventory timing and reduced equity earnings at the Talison joint venture, which more than offset favorable volumes.

Specialties Results

In millions

Q1 2024


Q1 2023


$ Change


% Change

Net Sales

$           316.1


$           418.8


$          (102.7)


(24.5) %

Adjusted EBITDA

$             45.2


$           162.2


$          (117.0)


(72.1) %

Specialties net sales for the first quarter of 2024 were $316 million , a decrease of $103 million , or 25%, primarily due to lower prices (-19%) and lower volumes (-6%). Adjusted EBITDA of $45 million decreased $117 million . Both volumes and prices were impacted by weaker demand, particularly for consumer electronics.

Ketjen Results

In millions

Q1 2024


Q1 2023


$ Change


% Change

Net Sales

$           243.8


$           217.8


$             26.0


11.9 %

Adjusted EBITDA

$             22.0


$             14.5


$               7.4


51.1 %

Ketjen net sales of $244 million for the first quarter of 2024 were up 12% compared to the previous year due to higher volumes (+10%) and higher prices (+2%), primarily from clean fuel technologies. Adjusted EBITDA of $22 million increased $7 million largely due to higher sales and lower input costs.

Cash Flow and Capital Deployment
Cash from operations of $98 million for the first quarter of 2024 decreased $623 million versus the prior year period. The year-over-year decrease was driven by lower adjusted EBITDA and reduced dividends received from equity investments, partially offset by lower investment in working capital. Capital expenditures of $579 million increased by $164 million versus the prior-year period due to the timing of project spend.

On March 8, 2024 , Albemarle completed a $2.3 billion public mandatory convertible preferred stock offering to fortify the balance sheet, enhance financial flexibility, and fund in-flight growth investments. Albemarle's capital allocation priorities continue to focus on investing in its organic opportunities to drive profitable growth, maintaining its investment grade credit rating, and funding its dividends.

Balance Sheet and Liquidity
As of March 31, 2024 , Albemarle had estimated liquidity of approximately $3.7 billion , including $2.1 billion of cash and equivalents, $1.5 billion available under its revolver and $124 million available under other credit lines. Total debt was $3.5 billion , representing a debt covenant net debt to adjusted EBITDA of approximately 0.9 times.

Earnings Call

Date:

Thursday, May 2, 2024

Time:

9:00 AM Eastern time

Dial-in (U.S.):

1-800-590-8290

Dial-in (International):

1-240-690-8800

Conference ID:

ALBQ1

The company's earnings presentation and supporting material are available on Albemarle's website at https://investors.albemarle.com .

About Albemarle
Albemarle Corporation (NYSE: ALB) leads the world in transforming essential resources into critical ingredients for mobility, energy, connectivity, and health. We partner to pioneer new ways to move, power, connect and protect with people and planet in mind. A reliable and high-quality global supply of lithium and bromine allow us to deliver advanced solutions for our customers. Learn more about how the people of Albemarle are enabling a more resilient world at albemarle.com and on X (formerly Twitter) @AlbemarleCorp.

Albemarle regularly posts information to www.albemarle.com , including notification of events, news, financial performance, investor presentations and webcasts, non-GAAP reconciliations, Securities and Exchange Commission ("SEC") filings and other information regarding the company, its businesses and the markets it serves.

Forward-Looking Statements
This press release contains statements concerning our expectations, anticipations and beliefs regarding the future, which constitute "forward-looking statements" within the meaning of the Private Securities Litigation Reform Act of 1995. These forward-looking statements, which are based on assumptions that we have made as of the date hereof and are subject to known and unknown risks and uncertainties, often contain words such as "anticipate," "believe," "estimate," "expect," "guidance," "intend," "may," "outlook," "scenario," "should," "would," and "will". Forward-looking statements may include statements regarding: our 2024 company and segment outlooks, including expected market pricing of lithium and spodumene and other underlying assumptions and outlook considerations; expected capital expenditure amounts and the corresponding impact on cash flow; market pricing of lithium carbonate equivalent and spodumene; anticipated timing of the commissioning of the Meishan China lithium conversion facility; plans and expectations regarding other projects and activities, cost reductions and accounting charges, and all other information relating to matters that are not historical facts. Factors that could cause Albemarle's actual results to differ materially from the outlook expressed or implied in any forward-looking statement include: changes in economic and business conditions; financial and operating performance of customers; timing and magnitude of customer orders; fluctuations in lithium market prices; production volume shortfalls; increased competition; changes in product demand; availability and cost of raw materials and energy; technological change and development; fluctuations in foreign currencies; changes in laws and government regulation; regulatory actions, proceedings, claims or litigation; cyber-security breaches, terrorist attacks, industrial accidents or natural disasters; political unrest; changes in inflation or interest rates; volatility in the debt and equity markets; acquisition and divestiture transactions; timing and success of projects; performance of Albemarle's partners in joint ventures and other projects; changes in credit ratings; and the other factors detailed from time to time in the reports Albemarle files with the SEC, including those described under "Risk Factors" in Albemarle's most recent Annual Report on Form 10-K and any subsequently filed Quarterly Reports on Form 10-Q, which are filed with the SEC and available on the investor section of Albemarle's website (investors.albemarle.com) and on the SEC's website at www.sec.gov . These forward-looking statements speak only as of the date of this press release. Albemarle assumes no obligation to provide any revisions to any forward-looking statements should circumstances change, except as otherwise required by securities and other applicable laws.

Albemarle Corporation and Subsidiaries

Consolidated Statements of Income

(In Thousands Except Per Share Amounts) (Unaudited)


Three Months Ended


March 31,


2024


2023

Net sales

$ 1,360,736


$ 2,580,252

Cost of goods sold

1,321,798


1,303,712

Gross profit

38,938


1,276,540

Selling, general and administrative expenses

194,912


154,306

Research and development expenses

23,532


20,471

Operating (loss) profit

(179,506)


1,101,763

Interest and financing expenses

(37,969)


(26,777)

Other income, net

49,901


82,492

(Loss) income before income taxes and equity in net income of unconsolidated
investments

(167,574)


1,157,478

Income tax (benefit) expense

(3,721)


276,963

(Loss) income before equity in net income of unconsolidated investments

(163,853)


880,515

Equity in net income of unconsolidated investments (net of tax)

180,500


396,188

Net income

16,647


1,276,703

Net income attributable to noncontrolling interests

(14,199)


(38,123)

Net income attributable to Albemarle Corporation

2,448


1,238,580

Mandatory convertible preferred stock dividends

(11,584)


Net (loss) income attributable to Albemarle Corporation common shareholders

$      (9,136)


$ 1,238,580

Basic (loss) earnings per share attributable to common shareholders

$        (0.08)


$        10.57

Diluted (loss) earnings per share attributable to common shareholders

$        (0.08)


$        10.51


Weighted-average common shares outstanding – basic

117,451


117,232

Weighted-average common shares outstanding – diluted

117,451


117,841

Albemarle Corporation and Subsidiaries

Condensed Consolidated Balance Sheets

(In Thousands) (Unaudited)


March 31,


December 31,


2024


2023

ASSETS


Current assets:


Cash and cash equivalents

$        2,055,813


$           889,900

Trade accounts receivable

874,038


1,213,160

Other accounts receivable

438,507


509,097

Inventories

1,904,827


2,161,287

Other current assets

549,540


443,475

Total current assets

5,822,725


5,216,919

Property, plant and equipment

12,587,763


12,233,757

Less accumulated depreciation and amortization

2,831,728


2,738,553

Net property, plant and equipment

9,756,035


9,495,204

Investments

1,259,001


1,369,855

Other assets

329,283


297,087

Goodwill

1,613,534


1,629,729

Other intangibles, net of amortization

251,755


261,858

Total assets

$      19,032,333


$      18,270,652

LIABILITIES AND EQUITY


Current liabilities:


Accounts payable to third parties

$        1,165,955


$        1,537,859

Accounts payable to related parties

129,613


550,186

Accrued expenses

454,600


544,835

Current portion of long-term debt

5,076


625,761

Dividends payable

58,354


46,666

Income taxes payable

237,098


255,155

Total current liabilities

2,050,696


3,560,462

Long-term debt

3,519,453


3,541,002

Postretirement benefits

26,382


26,247

Pension benefits

145,067


150,312

Other noncurrent liabilities

833,548


769,100

Deferred income taxes

657,468


558,430

Commitments and contingencies


Equity:


Albemarle Corporation shareholders' equity:


Common stock

1,175


1,174

Mandatory convertible preferred stock

2,235,379


Additional paid-in capital

2,962,585


2,952,517

Accumulated other comprehensive loss

(597,205)


(528,526)

Retained earnings

6,930,868


6,987,015

Total Albemarle Corporation shareholders' equity

11,532,802


9,412,180

Noncontrolling interests

266,917


252,919

Total equity

11,799,719


9,665,099

Total liabilities and equity

$      19,032,333


$      18,270,652

Albemarle Corporation and Subsidiaries

Selected Consolidated Cash Flow Data

(In Thousands) (Unaudited)


Three Months Ended

March 31,


2024


2023

Cash and cash equivalents at beginning of year

$     889,900


$   1,499,142

Cash flows from operating activities:


Net income

16,647


1,276,703

Adjustments to reconcile net income to cash flows from operating activities:


Depreciation and amortization

123,751


87,271

Stock-based compensation and other

9,317


10,540

Equity in net income of unconsolidated investments (net of tax)

(180,500)


(396,188)

Dividends received from unconsolidated investments and nonmarketable
securities

50,756


547,552

Pension and postretirement expense

1,273


1,954

Pension and postretirement contributions

(4,824)


(2,825)

Realized loss on investments in marketable securities

33,746


Unrealized loss (gain) on investments in marketable securities

6,737


(45,732)

Deferred income taxes

116,447


14,098

Working capital changes

(52,320)


(764,071)

Other, net

(23,076)


(8,322)

Net cash provided by operating activities

97,954


720,980

Cash flows from investing activities:


Capital expenditures

(579,322)


(415,608)

Sales (purchases) of marketable securities, net

84,893


(122,267)

Investments in equity investments and nonmarketable securities

(74)


(1,133)

Net cash used in investing activities

(494,503)


(539,008)

Cash flows from financing activities:


Proceeds from issuance of mandatory convertible preferred stock

2,236,750


Repayments of long-term debt and credit agreements

(29,019)


Proceeds from borrowings of long-term debt and credit agreements

29,019


Other debt repayments, net

(620,753)


(713)

Dividends paid to shareholders

(46,908)


(46,282)

Dividends paid to noncontrolling interests


(53,145)

Proceeds from exercise of stock options

86


81

Withholding taxes paid on stock-based compensation award distributions

(10,619)


(18,617)

Other

(1,256)


Net cash provided by (used in) financing activities

1,557,300


(118,676)

Net effect of foreign exchange on cash and cash equivalents

5,162


24,296

Increase in cash and cash equivalents

1,165,913


87,592

Cash and cash equivalents at end of period

$   2,055,813


$   1,586,734

Albemarle Corporation and Subsidiaries

Consolidated Summary of Segment Results

(In Thousands) (Unaudited)


Three Months Ended


March 31,


2024


2023

Net sales:


Energy Storage

$   800,898


$ 1,943,682

Specialties

316,065


418,778

Ketjen

243,773


217,792

Total net sales

$ 1,360,736


$ 2,580,252


Adjusted EBITDA:


Energy Storage

$    197,996


$ 1,567,692

Specialties

45,181


162,158

Ketjen

21,979


14,543

Total segment adjusted EBITDA

265,156


1,744,393

Corporate

26,080


17,311

Total adjusted EBITDA

$    291,236


$ 1,761,704

See accompanying non-GAAP reconciliations below.

Additional Information regarding Non-GAAP Measures

It should be noted that adjusted net income attributable to Albemarle Corporation, adjusted net income attributable to Albemarle Corporation common shareholders, adjusted diluted earnings per share attributable to common shareholders, non-operating pension and other post-employment benefit ("OPEB") items per diluted share, non-recurring and other unusual items per diluted share, adjusted effective income tax rates, EBITDA, adjusted EBITDA (on a consolidated basis), EBITDA margin and adjusted EBITDA margin are financial measures that are not required by, or presented in accordance with, accounting principles generally accepted in the United States , or GAAP. These non-GAAP measures should not be considered as alternatives to Net income attributable to Albemarle Corporation ("earnings") or other comparable measures calculated and reported in accordance with GAAP. These measures are presented here to provide additional useful measurements to review the company's operations, provide transparency to investors and enable period-to-period comparability of financial performance. The company's chief operating decision maker uses these measures to assess the ongoing performance of the company and its segments, as well as for business and enterprise planning purposes.

A description of other non-GAAP financial measures that Albemarle uses to evaluate its operations and financial performance, and reconciliation of these non-GAAP financial measures to the most directly comparable financial measures calculated and reported in accordance with GAAP can be found on the following pages of this press release, which is also is available on Albemarle's website at https://investors.albemarle.com . The company does not provide a reconciliation of forward-looking non-GAAP financial measures to the most directly comparable financial measures calculated and reported in accordance with GAAP, as the company is unable to estimate significant non-recurring or unusual items without unreasonable effort. The amounts and timing of these items are uncertain and could be material to the company's results calculated in accordance with GAAP.

ALBEMARLE CORPORATION AND SUBSIDIARIES

Non-GAAP Reconciliations

(Unaudited)

See below for a reconciliation of adjusted net income attributable to Albemarle Corporation, adjusted net income attributable to Albemarle Corporation common shareholders, EBITDA and adjusted EBITDA (on a consolidated basis), which are non-GAAP financial measures, to Net income attributable to Albemarle Corporation ("earnings"), the most directly comparable financial measure calculated and reported in accordance with GAAP. Adjusted net income attributable to Albemarle Corporation common shareholders is defined as net income after mandatory convertible preferred stock dividends, but before the non-recurring, other unusual and non-operating pension and other post-employment benefit (OPEB) items as listed below. The non-recurring and unusual items may include acquisition and integration related costs, gains or losses on sales of businesses, restructuring charges, facility divestiture charges, certain litigation and arbitration costs and charges, and other significant non-recurring items. EBITDA is defined as net income attributable to Albemarle Corporation before interest and financing expenses, income tax expense, and depreciation and amortization. Adjusted EBITDA is defined as EBITDA plus or minus the proportionate share of Windfield Holdings income tax expense, non-recurring, other unusual and non-operating pension and OPEB items as listed below.


Three Months Ended


March 31,


2024


2023

In thousands, except percentages and per share amounts

$


% of
net
sales


$


% of
net
sales

Net income attributable to Albemarle Corporation

$         2,448


$  1,238,580


Add back:


Non-operating pension and OPEB items (net of tax)

(351)


374


Non-recurring and other unusual items (net of tax)

40,044


(22,774)


Adjusted net income attributable to Albemarle Corporation

42,141


1,216,180


Mandatory convertible preferred stock dividends

(11,584)


Adjusted net income attributable to Albemarle Corporation common shareholders

$       30,557


$  1,216,180


Adjusted diluted earnings per share attributable to common shareholders

$           0.26


$         10.32


Adjusted weighted-average common shares outstanding – diluted

117,668


117,841


Net income attributable to Albemarle Corporation

$         2,448


0.2 %


$  1,238,580


48.0 %

Add back:


Interest and financing expenses

37,969


2.8 %


26,777


1.0 %

Income tax (benefit) expense

(3,721)


(0.3) %


276,963


10.7 %

Depreciation and amortization

123,751


9.1 %


87,271


3.4 %

EBITDA

160,447


11.8 %


1,629,591


63.2 %

Proportionate share of Windfield income tax expense

73,689


5.4 %


165,985


6.4 %

Non-operating pension and OPEB items

(325)


— %


601


— %

Non-recurring and other unusual items

57,425


4.2 %


(34,473)


(1.3) %

Adjusted EBITDA

$     291,236


21.4 %


$  1,761,704


68.3 %


Net sales

$  1,360,736


$  2,580,252


Non-operating pension and OPEB items, consisting of mark-to-market actuarial gains/losses, settlements/curtailments, interest cost and expected return on assets, are not allocated to Albemarle's operating segments and are included in the Corporate category. In addition, the company believes that these components of pension cost are mainly driven by market performance, and the company manages these separately from the operational performance of the company's businesses. In accordance with GAAP, these non-operating pension and OPEB items are included in Other income, net. Non-operating pension and OPEB items were as follows (in thousands):


Three Months Ended


March 31,


2024


2023

Interest cost

$       8,505


$       9,010

Expected return on assets

(8,830)


(8,409)

Total

$        (325)


$          601

In addition to the non-operating pension and OPEB items disclosed above, the company has identified certain other items and excluded them from Albemarle's adjusted net income calculation for the periods presented. A listing of these items, as well as a detailed description of each follows below (per diluted share):


Three Months Ended


March 31,


2024


2023

Restructuring and other charges (1)

$         0.23


$            —

Acquisition and integration related costs (2)

0.01


0.03

Loss (gain) in fair value of public equity securities (3)

0.35


(0.29)

Other (4)

(0.15)


0.04

Tax related items (5)

(0.10)


0.03

Total non-recurring and other unusual items

$         0.34


$       (0.19)


(1)

In January 2024, the Company announced it was taking measures to unlock near term cash flow and generate long-term financial flexibility by re-phasing organic growth investments and optimizing its cost structure. As a result, the Company recorded severance costs for employees in Corporate and each of the businesses, and losses related to the cancellation of certain capital expenditure projects. During the three months ended March 31, 2024, $33.5 million of these expenses were recorded in Selling, general and administrative expenses and $2.8 million were recorded in Other income, net ($27.0 million after income taxes, or $0.23 per share). The severance has primarily been paid, with the remainder to be paid in 2024.


(2)

Costs related to the acquisition, integration and divestitures for various significant projects, recorded in Selling, general and administrative expenses for the three months ended March 31, 2024 and 2023 were $1.9 million and $5.1 million ($1.5 million and $4.0 million after income taxes, or $0.01 and $0.03 per share), respectively.


(3)

Loss of $33.7 million and $9.4 million recorded in Other income, net resulting from the sale of investments in public equity securities and the change in fair value of investments in public equity securities, respectively, for the three months ended March 31, 2024 ($41.1 million after income taxes, or $0.35 per share). Gain of $45.8 million ($34.4 million after income taxes, or $0.29 per share) recorded in Other income, net for the three months ended March 31, 2023, resulting from the increase in fair value of investments in public equity securities.


(4)

Other adjustments for the three months ended March 31, 2024 included amounts recorded in:

  • Cost of goods sold - $1.4 million of expenses related to non-routine labor and compensation related costs that are outside normal compensation arrangements.
  • Selling, general and administrative expenses - $0.1 million of expenses related to certain legal costs.
  • Other income, net - $17.3 million gain primarily from the sale of assets at a site not part of our operations, an $8.7 million gain from PIK dividends of preferred equity in a Grace subsidiary and a $2.4 million gain primarily resulting from the adjustment of indemnification related to a previously disposed business, partially offset by $2.9 million of charges for asset retirement obligations at a site not part of our operations.

After income taxes, these net gains totaled $17.3 million, or $0.15 per share.


Other adjustments for the three months ended March 31, 2023 included amounts recorded in:

  • Selling, general and administrative expenses - $1.9 million of charges primarily for environmental reserves at sites not part of our operations and $0.7 million of facility closure expenses related to offices in Germany.
  • Other income, net - $3.6 million of asset retirement obligation charges primarily for a site not part of our operations.

After income taxes, these net charges totaled $4.8 million, or $0.04 per share.


(5)

Included in Income tax benefit for the three months ended March 31, 2024 are discrete net tax benefits of $12.3 million, or $0.10 per share primarily related to the reduction in a foreign tax reserve and excess tax benefits realized from stock-based compensation arrangements.


Included in Income tax expense for the three months ended March 31, 2023 are discrete net tax expenses of $2.9 million, or $0.03 per share primarily related to foreign return to provisions offset by excess tax benefits realized from stock-based compensation arrangements.

See below for a reconciliation of the adjusted effective income tax rate, the non-GAAP financial measure, to the effective income tax rate, the most directly comparable financial measure calculated and reported in accordance with GAAP (in thousands, except percentages).


Income before
income taxes and
equity in net income
of unconsolidated
investments


Income tax expense


Effective income tax
rate

Three months ended March 31, 2024


As reported

$                   (167,574)


$                       (3,721)


2.2 %

Non-recurring, other unusual and non-operating pension and OPEB
items

57,100


17,407


As adjusted

$                   (110,474)


$                      13,686


(12.4) %


Three months ended March 31, 2023


As reported

$                 1,157,478


$                    276,963


23.9 %

Non-recurring, other unusual and non-operating pension and OPEB
items

(33,872)


(11,472)


As adjusted

$                 1,123,606


$                    265,491


23.6 %

As noted above, beginning in 2024, the company changed its definition of adjusted EBITDA for financial accounting purposes. The updated definition includes Albemarle's share of the pre-tax earnings of the Talison joint venture, whereas the prior definition included Albemarle's share of Talison earnings net of tax. See below for a reconciliation of adjusted EBITDA (on a consolidated basis), the non-GAAP financial measure, to Net income attributable to Albemarle Corporation ("earnings"), the most directly comparable financial measure calculated and reported in accordance with GAAP, as if it were presented under the new definition for the year ended December 31, 2023 .

Net income attributable to Albemarle Corporation

$               1,573,476

Depreciation and amortization

429,944

Interest and financing expenses

116,072

Income tax expense

430,277

Proportionate share of Windfield income tax expense

779,703

Gain on sale of business/interest in properties, net

(71,190)

Acquisition and integration related costs

26,767

Goodwill impairment

6,765

Non-operating pension and OPEB items

(7,971)

Mark-to-market gain on public equity securities

44,732

Legal accrual

218,510

Other

(1,097)

Total adjusted EBITDA

$               3,545,988

Contact:
Meredith Bandy 1.980.999.5168

Cision View original content to download multimedia: https://www.prnewswire.com/news-releases/albemarle-reports-first-quarter-2024-results-302133681.html

SOURCE Albemarle Corporation

News Provided by PR Newswire via QuoteMedia

Keep reading...Show less
Lithium Universe

Lithium Universe Limited (ASX: LU7) – Reinstatement to Official Quotation

Description

The suspension of trading in the securities of Lithium Universe Limited (‘LU7’) will be lifted immediately, following the release by LU7 of an announcement regarding the finalisation of a capital raising.

Keep reading...Show less
Lithium Universe

LU7 Raises $3.64 Million to Advance Closing the Lithium Conversion Gap Strategy

Lithium Universe Limited (referred to as "Lithium Universe" or the "Company," ASX: "LU7") is pleased to advise that it has completed a $3,644,333.34 million capital raising to sophisticated investors, at a price of $0.02 for each one fully paid ordinary share (FPS) subscribed.

Keep reading...Show less
Balkan Mining and Minerals

March 2024 Quarterly Activities Report

Balkan Mining and Minerals Ltd (ASX: BMM; "BMM" or "the Company") provides the Company’s quarterly activities report for the nine months ended 31 March 2024 (“Quarter”).

Keep reading...Show less
Galan Lithium

Quarterly Activities and Cash Flow Report

The Board of Galan Lithium Limited (Galan or the Company) is pleased to provide this Quarterly Activities Report for the quarter ended 31 March 2024 and to the date of this report. The main focus for the quarter was the ongoing construction works/activities at the Company’s 100% owned, high- grade/low-impurity Hombre Muerto West (HMW) Project in the Catamarca Province, Argentina. Galan continues its steady progress in advancing its low cost, high grade HMW project to production in a timely manner.

Keep reading...Show less
Portofino Grants Stock Options

Portofino Grants Stock Options

Portofino Resources INC. (TSXV: POR) (OTCQB: PFFOF) (FSE: POTA) ("Portofino" or the "Company") announces that, in accordance with the Company's Share Option Plan it has granted options to purchase an aggregate of 360,000 common shares of the Company to certain consultants of the Company. Each Option is exercisable into one Common Share at an exercise price of $0.05. The Options are subject to certain vesting conditions and expire five years from the grant date.

About Portofino Resources Inc.

News Provided by Newsfile via QuoteMedia

Keep reading...Show less

Latest Press Releases

Related News

×