- WORLD EDITIONAustraliaNorth AmericaWorld
Investing News NetworkYour trusted source for investing success
- Lithium Outlook
- Oil and Gas Outlook
- Gold Outlook Report
- Uranium Outlook
- Rare Earths Outlook
- All Outlook Reports
- Top Generative AI Stocks
- Top EV Stocks
- Biggest AI Companies
- Biggest Blockchain Stocks
- Biggest Cryptocurrency-mining Stocks
- Biggest Cybersecurity Companies
- Biggest Robotics Companies
- Biggest Social Media Companies
- Biggest Technology ETFs
- Artificial Intellgience ETFs
- Robotics ETFs
- Canadian Cryptocurrency ETFs
- Artificial Intelligence Outlook
- EV Outlook
- Cleantech Outlook
- Crypto Outlook
- Tech Outlook
- All Market Outlook Reports
- Cannabis Weekly Round-Up
- Top Alzheimer's Treatment Stocks
- Top Biotech Stocks
- Top Plant-based Food Stocks
- Biggest Cannabis Stocks
- Biggest Pharma Stocks
- Longevity Stocks to Watch
- Psychedelics Stocks to Watch
- Top Cobalt Stocks
- Small Biotech ETFs to Watch
- Top Life Science ETFs
- Biggest Pharmaceutical ETFs
- Life Science Outlook
- Biotech Outlook
- Cannabis Outlook
- Pharma Outlook
- Psychedelics Outlook
- All Market Outlook Reports
![Cross River Ventures Corp.](https://investingnews.com/media-library/cross-river-ventures-corp.png?id=27750060&width=1200&height=801)
Cross River Announces Discovery of 41.1 g/t over 0.5 m in First Holes Drilled at Bear Head Zone, McVicar Gold Project, NW Ontario
Cross River Ventures Corp. (CSE: CRVC) (OTCQB: CSRVF) (FSE: C6R) (the "Company") is pleased to announce results from the Bear Head Zone maiden drill program at the McVicar Project, located 150km northeast of Red Lake Ontario. Highlights include:
- Discovery drill hole BH-02 intersected 0.5m of 41.1 g/t gold with visible gold in core at 153.75 m downhole (See Table 1 for complete results).
- Maiden 8-hole diamond drill program tested a new gold trend (the "Bear Head Zone") that was discovered in 2021 with surface samples grading up to 19.75 g/t Au (Press Release October 5, 2021).
- All 8 holes intercepted anomalous gold mineralization greater than 0.25 g/t Au (See Table 1).
- Planned follow-up work includes geophysics and step-out drill holes
In the summer of 2021, Cross River completed extensive targeted prospecting work on the McVicar Property located in the Archaean Lang Lake greenstone belt, which resulted in the discovery of a new surface gold trend, the "Bear Head Zone", which was drill tested by the company in winter 2022. The Bear Head Zone is a +700-meter long gold trend with surface samples returning up to 19.75 grams-per-tonne (g/t) gold over coincident LiDAR and magnetic features (Press Release October 5, 2021). No previous drilling has ever been completed at the Bear Head Zone target.
Figure 1 shows a map of drillhole locations at the Bear Head Zone.
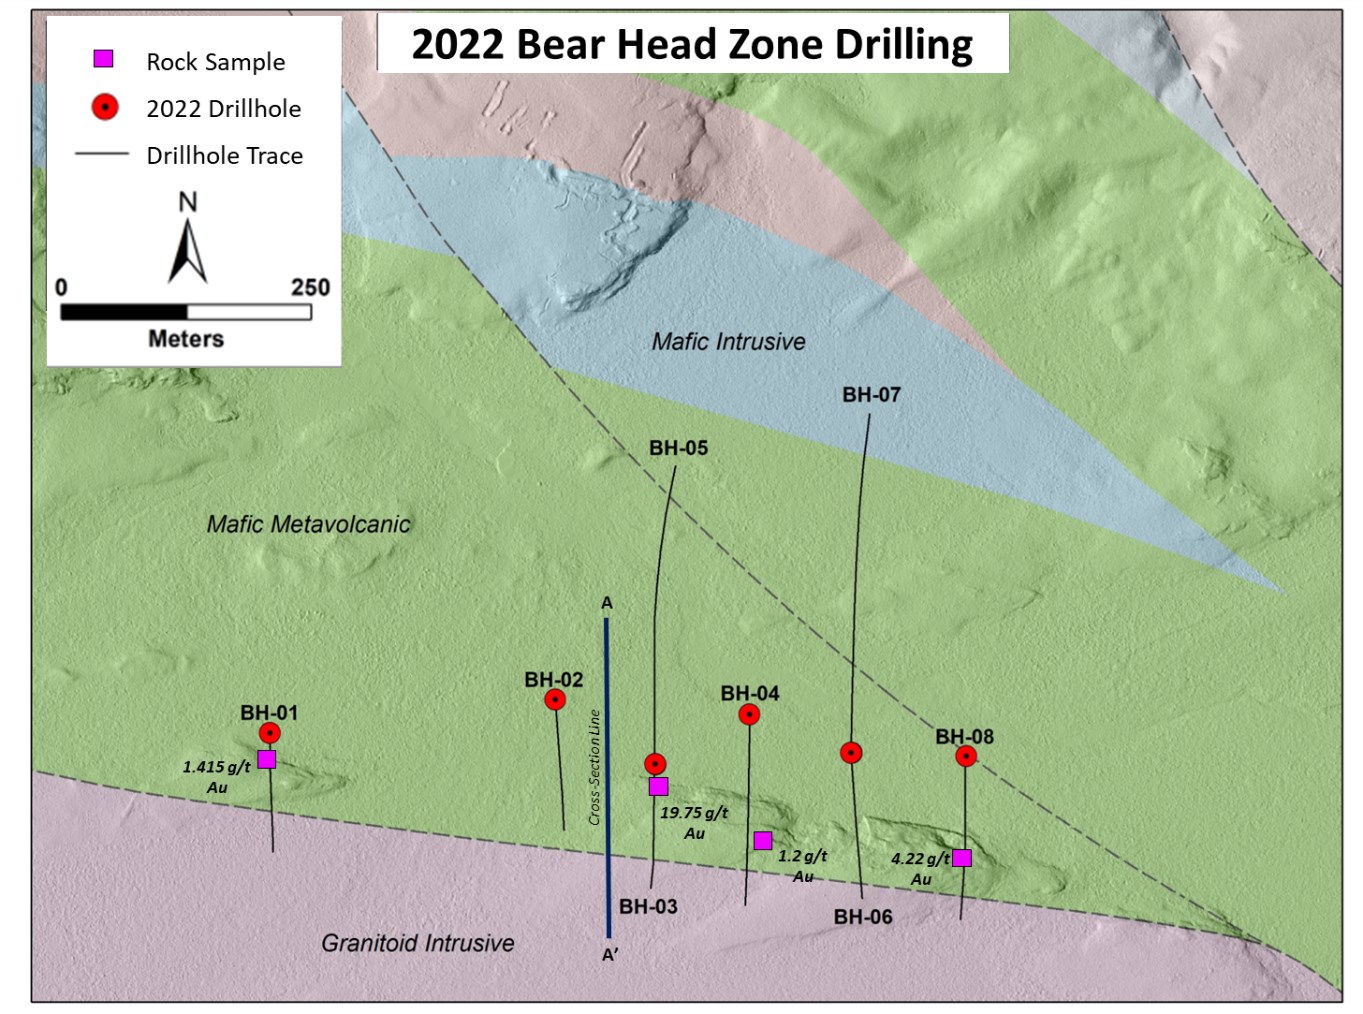
Figure 1: Bear Head Zone drillholes and high-grade surface samples
To view an enhanced version of Figure 1, please visit:
https://orders.newsfilecorp.com/files/7276/127988_f021b46cd4ce3a79_002full.jpg
Eight diamond drillholes tested the Bear Head Zone during the winter 2022 program, and all holes intercepted anomalous gold mineralization greater than 0.25 g/t Au. Drilling identified an altered and mineralized corridor >710 m long, open to the east and west along strike.
Notable Drilling Intercepts (>0.5 g/t Au) at Bear Head Zone include:
BH-02:
- 5.23 meters at 0.51 g/t gold from 72.37 m downhole
- including 1.0 meters at 1.17 g/t gold
- 1.0 meters at 0.61 g/t gold from 90.0 m downhole
- 1.2 meters at 0.74 g/t gold from 117.0 m downhole
- 0.5 meters at 0.70 g/t gold from 150.1 m downhole
- 0.5 meters at 41.1 g/t gold (with visible gold in core) from 153.75 m downhole
BH-03:
- 1.0 meters at 0.97 g/t gold from 22 m downhole
- 0.47 meters at 3.23 g/t gold from 43.36 m downhole
- 1.15 meters at 0.97 g/t gold from 47.85 m downhole
BH-04:
- 1.0 meters at 0.90 g/t gold from 125 m downhole
- 1.0 meters at 0.81 g/t gold from 155 m downhole
BH-08:
- 1.0 meters at 1.1 g/t gold from 133 m downhole
Discovery Drillhole: BH-02
Hole BH-02 intersected 0.5m of 41.1 g/t gold in a smoky grey quartz vein with visible gold, chalcopyrite, and pyrrhotite at 153.75m downhole (117m vertical depth). The quartz vein cross-cuts a locally sheared mafic metavolcanic succession, with a feldspar-porphyry dyke cutting host rocks proximal to the vein footwall. The gold interval is located near the east-west trending contact between volcano-sedimentary host rocks and a tonalite intrusive body. The contact area is characterized by damage zones and abundant shearing, various styles of alteration and veining, as well as feldspar porphyry dikes.
Figure 2: a) BH-02 smoky-grey quartz vein (41.1 g/t Au over 0.50m), b) visible gold, chalcopyrite and pyrrhotite in brecciated grey-black quartz
To view an enhanced version of Figure 2 (a and b), please visit:
https://orders.newsfilecorp.com/files/7276/127988_f021b46cd4ce3a79_003full.jpg
Geological mapping and 3-D modelling work indicates that this high-grade gold intercept projects to the surface along strike with the 19.75 g/t Au surface sample collected in 2021, as well as the 0.47m sample grading 3.23 g/t Au and 1.185% Cu from BH-03. (Figure 3).
Figure 3: Interpreted projection of high-grade intercepts from surface through BH-03 and BH-02
To view an enhanced version of Figure 3, please visit:
https://orders.newsfilecorp.com/files/7276/127988_crossriverfigure3.jpg
Additional smoky grey quartz +/- sulfide veins up to 20 cm wide were intercepted in BH-02 and all other Bear Head Zone drillholes, contributing to a broad, low-grade gold envelope as indicated by the assays. The presence of high-grade mineralization, with visible gold, within a broad low-grade mineralized envelope, is typical in environments where gold is concentrated in plunging chutes. Table 1 shows the significant gold intercepts (>0.25 g/t) in each drill hole.
Table 1: Significant Gold Intercepts >0.25 g/t
To view an enhanced version of Table 1, please visit:
https://orders.newsfilecorp.com/files/7276/127988_crossrivertable1.jpg
Drillhole Descriptions
BH-01 (Az: 180°, Dip: -50°)
BH-01 is the westernmost hole drilled at the Bear Head Zone and is designed to test an east-west trending quartz vein zone beneath the 1.415 g/t Au sample collected on surface in 2021. BH-01 cut 16 meters of overburden before intersecting chlorite-carbonate altered mafic metavolcanic rocks containing instances of moderate shearing with minor intervals of sericite-silica alteration, with up to 5% grey to white quartz veinlets. The best gold intercept occurs between 16-19 meters downhole and averages 0.356 g/t Au. Pyrite and pyrrhotite are present as fine disseminations and as a stringer veinlet network. At 78m, the hole intersected an intrusive tonalite body to EOH at 185.5m.
BH-02 (Az: 180°, Dip: -50°)
BH-02 was drilled 300m east of BH-01 and targeted an east-west oriented magnetic high feature located north of the quartz-veined topographic ridge system tested by BH-01. After 25 meters of overburden, the hole intersected an intensely sheared clastic sedimentary rock (argillite) that contains smokey quartz veins, disseminated pyrite and pyrrhotite. From 44 -163m downhole, chlorite-calcite altered mafic metavolcanic rocks were intersected, with locally strong shearing, and intermittent zones of moderate sericite and silica alteration. From 62-67m interbedded banded-iron-formations were noted, often with up to 8% banded pyrite and pyrrhotite. The mafic metavolcanic unit (72 to 155 meters downhole) contains narrow smoky grey and white quartz veinlets creating a broad low-grade gold halo (samples up to 1.17 g/t Au, 0.23% Cu over 1m), as well as a 0.5m meter sample with 41.1 g/t Au, where a 20cm (true width unknown) smoky quartz vein contains visible gold, chalcopyrite and pyrrhotite. At 163m the hole intersected tonalite intrusion to EOH at 206 meters.
BH-03 (Az: 180°, Dip: -50°)
BH-03 was drilled 100m east of BH-02 and targeted the quartz-veined ridge topographic high, specifically below the 19.75 g/t Au sample collected in 2021. After 15 meters of overburden the hole intersected chlorite altered mafic metavolcanic rocks to 117 meters downhole. The metavolcanic rocks are moderately sheared (locally) and contain smoky-grey and white quartz veins, quartz breccia, and sulfide stringers with sericite halos. From 20m to 105m downhole, a low-grade gold envelope is present (similar to BH-02). The highest grade sample was taken from a moderately veined interval with foliation-hosted pyrite, pyrrhotite and chalcopyrite, grading 3.23 g/t Au and 1.185% Cu over 0.47m. From 117m to 192m (EOH), the tonalite intrusion was intersected and intermittently cut by fine-grained mafic dykes.
BH-04 (Az: 180°, Dip: -50°)
BH-04 was drilled 100m east of BH-03 and targeted a quartz-vein topographic high ridge with a coincident magnetic anomaly (high). Below 28 meters of overburden the hole cut interbedded clastic metasedimentary rocks (argillite), mafic metavolcanic rocks, and banded iron-formations (locally enriched in arsenopyrite and pyrite) to 97m depth. From 97m to 181m, mafic metavolcanic rocks are present cut locally by fine-grained mafic intrusions (dykes). The mafic metavolcanic rocks are cut by 2-3% smoky-grey to white quartz veinlets which ran up to 0.895 g/t Au & 0.243% Cu over 1m. From 181m to 290m (EOH) the hole intersected tonalite intrusion cut by mafic dykes.
BH-05 (Az: 0°, Dip: -50°)
BH-05 was drilled toward the north and cut a topographic/magnetic low situated between the Bear Head Zone surface exposure and the Chellow Vein (600m to the north). After 26 meters of overburden, the hole intersected sheared argillite to 224m depth. The argillite is locally pyrite +/- pyrrhotite bearing in foliation parallel layering with occasional course arsenopyrite. From 224m to EOH at 449m, the hole intersected foliated chlorite-calcite altered mafic metavolcanic rocks (local argillite interbeds) with narrow zones of sulfides, and minor quartz-carbonate veining. The highest grade gold sample occurred at 63.4m in the sheared argillite, with 0.256 g/t Au, 32.6 g/t Ag, 0.483% Zn, and 0.476% As over 0.5m.
BH-06 (Az: 180°, dip: -50)
BH-06 was drilled 100m east of BH-04 and targeted a quartz-veined topographic high ridge system and coincident magnetic high anomaly. After 20 meters of overburden the hole cut the sheared argillite unit down to 59m, followed by banded iron formation interbedded with mafic metavolcanic rocks down to 67m downhole. From 67-165m, chlorite altered mafic metavolcanic rocks were cut by sparse intermediate to mafic dykes, and local zone of sericite + silica alteration. The mafic metavolcanic unit contains 2-5% smoky-grey to white quartz veins, with increasing sulfide abundance (pyrite + pyrrhotite + chalcopyrite) moving downhole, grading up to 0.42 g/t Au over 2m, and up to 0.16% Cu over 1m. From 165m to 225m the tonalite intrusion was intersected and intermittently cut by fine-grained mafic dykes.
BH-07 (Az: 0°, Dip: -50°)
BH-07 was drilled towards the north to test the topographic/ magnetic low situated between the Bear Head Zone surface exposure and the Chellow Vein (600m to the north). After 21 meters of overburden, the hole intersected the same lithologic sequence as BH-05, with strongly sheared argillite down to 234m, followed by chlorite-altered mafic metavolcanic rocks down to EOH at 489m. Within the mafic metavolcanic unit from 454-488m downhole, quartz + carbonate breccia veins up to 50cm wide with trace chalcopyrite, pyrrhotite and pyrite were intersected. The highest grade gold sample occurred at 429m downhole in the mafic metavolcanic rocks, with 0.267g/t Au over 2m.
BH-08 (Az: 180°, dip: -50)
BH-08 is the easternmost hole drilled at the Bear Head Zone and is designed to test an east-west trending quartz veined topographic ridge system. BH-08 cut 12 meters of overburden before intersecting sheared argillite containing local concentrations of banded sulfides (pyrite, pyrrhotite, and arsenopyrite), with samples in this unit grading up to 0.328% Zn and 0.471% As over 1m. At 74m, the hole intersected mafic metavolcanic rocks, cut by narrow smoky grey-white quartz veinlets and trace sulfides which ran up to 1.1 g/t Au over 1m, and 0.403% Cu and 0.269 g/t over 0.51m. From 185-245m (EOH) the hole intersected tonalite intrusion cut by minor mafic dykes.
Geologic Setting
The geology and mineralization encountered in the drill program are similar to that described at the historic Golden Patricia Mine, located along strike 30km to the SE along the Bear Head Fault Zone. The Golden Patricia Mine produced 619,796 oz at 15.2 g/t Aui, and is hosted in a continuous 40 cm wide smoky quartz vein with visible gold, pyrrhotite, chalcopyrite. Like the Bear Head Zone (McVicar Project), veining at Golden Patricia is also hosted in mafic metavolcanic rocks with feldspar porphyry intrusions, iron formations, and shearing. The Golden Patricia shear zone is interpreted as a splay of the Bear Head Fault.v
Cross River CEO, Alex Klenman stated: "We are pleased with the results of the company's initial drill test on the Bear Head trend. The Cross River technical team identified this area as a priority target for gold mineralization and drilling has now confirmed discovery in this highly prospective zone. We look forward to next steps on the large prospective McVicar property and to follow up drilling at Bear Head. We're also eager to see the results from drilling at the Altered Zone and anticipate receiving those sometime over the next few weeks."
"The discovery of high grade gold during the company's initial drill test at the Bear Head Zone represents a significant step forward for Cross River," said Dan MacNeil, P.Geo, of the Cross River Technical Team. "The Bear Head Zone is on trend with the Golden Patricia Mine, which produced more than half a million ounces of gold at an average grade of 15 grams per ton. The McVicar project is a flagship gold endowed exploration asset, and the presence of high grade gold increases our confidence in the potential of the project," continued Mr. MacNeil.
In addition to drill testing the Bear Head Zone during the winter 2022 drill program, 6 holes were drilled at the Altered Zone target to test strike and plunge continuity of known mineralization. Assays are pending and will be released once received, reviewed, and verified by the technical team.
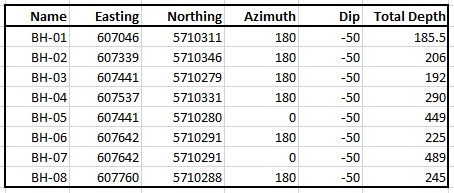
Table 2: Bear Head Zone Collars
To view an enhanced version of this graphic, please visit:
https://orders.newsfilecorp.com/files/7276/127988_f021b46cd4ce3a79_009full.jpg
About The Bear Head Trend
The Bear Head Trend was discovered in summer 2021 by Cross River Ventures field crews. The target is defined by a +700m strike of high-grade surface samples (up to 19.75 g/t Au - see News Release October 5th, 2021) following a prominent WNW trending topographic ridge system with mapped iron formation, sheared mafic meta-volcanics, and mineralized quartz veins. The Bear Head zone is located 600 meters south of the historic Chellow Vein near the southern contact between mafic volcanics and granite along the Bear Head Fault Zone. Drillholes were positioned to target the mineralized ridge system and coincident magnetic anomaly, as well as the topographic low situated between the Bear Head Trend and the Chellow Vein.
The Bear Head Trend is a previously undrilled high-grade gold corridor that is nested within a WNW trending multi-km braided damage zone structure. This geological environment is considered prospective for Archean greenstone gold deposits and contains favorable structural and lithological sites for gold deposition.
About The Altered Zone
The Altered Zone is a complex zone of deformation and intense alteration composed of sheared mafic volcanics, abundant green mica, intermediate intrusive rocks, massive to semi-massive quartz, and a quartz-carbonate-sericite schist.
New geologic modelling by Cross River in 2021 utilizes historic drilling data and suggests that the high-grade gold bearing structure continues at depth, coincident with lithologic breaks and a broader damage zone corridor characterized by an intense hydrothermal alteration overprint. The gold bearing structure at the Altered Zone is open in all directions. 2022 drillholes were positioned to target down-plunge extensions of known mineralization based on 3D modelling, as well as track the continuity of the structure to the south.
About the McVicar Project
Cross River's McVicar gold project is situated in the Superior Province of northern Ontario, Canada. The greenstone belts within the Superior Province contain some of the largest economic gold deposits in the world. McVicar encompasses the geologically significant structural components of the Lang Lake greenstone belt, an underexplored belt located approximately 40 km north of the historic Golden Patricia Mine (619,796 oz at 15.2 g/t Au)*.
The McVicar Gold Project is a district-scale (approximately 12,000 hectares) gold exploration project that contains gold prospective structure and host rocks that transect the entire Lang Lake greenstone belt, located in the Patricia Mining Division, approximately 150 km east of Red Lake, and 80 km west of Pickle Lake, in NW Ontario, Canada.
The property covers all the major fertile structural and lithostratigraphic elements of the greenstone belt, which is bound to the south by the major NW trending Bear Head Fault zone (within which the historic Golden Patricia Mine is situated).
Historic drilling at McVicar Lake in the Altered and North Flexure Zones include:
- 6.46 g/t Au over 10.09 m including 29.86 g/t Au over 1.86 metersii
- 5.5 g/t Au over 3.6 m including 12.2 g/t Au over 0.98 metersiii
The McVicar property also host the Chellow Vein zone, which is a narrow quartz vein that consists of smoky grey to white quartz mineralized with minor pyrite and visible gold. The vein system yielded high grade gold at surface including grab samplesiv that assayed 827.4 g/t Au and 578.1 g/t Auv.
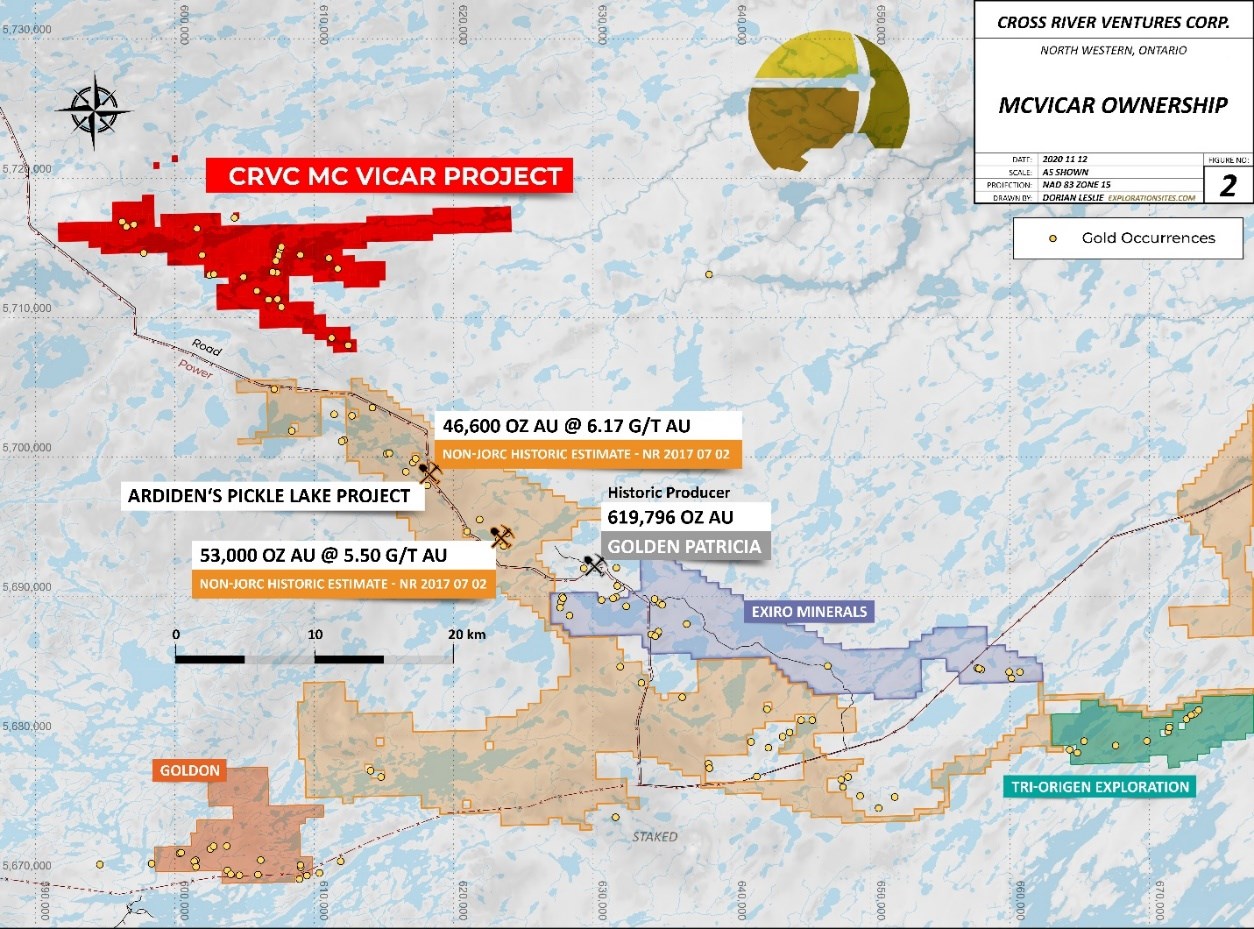
Figure 4: McVicar Gold Project, location of nearby deposits and historical mines, NW Ontario
To view an enhanced version of Figure 4, please visit:
https://orders.newsfilecorp.com/files/7276/127988_f021b46cd4ce3a79_010full.jpg
Quality Assessment, Quality Control Protocols
Cross River has deployed an industry-standard quality-assurance/quality-control program during the 2022 drill program. This included the insertion of a sequence of standards, blanks, and duplicates into the sample string every tenth sample, in addition to industry standard chain of custody protocols for the samples. Core cutting was completed in Thunder Bay and samples were taken to ALS Global for multi-element analysis in addition to fire-assay of gold using analytical codes ME-MS61 and Au-ICP22. Overlimit analyses of gold (>10 g/t Au) was performed using Au-GRAV22.
Qualified Person
Daniel MacNeil, P.Geo., M.Sc., a Qualified Person as defined under National Instrument 43-101, reviewed, and approved the technical content disclosed in this press release. Historical assay results contained in this press release were not verified by the Company. However, the historical reports referenced were authored by experienced geoscientists and copies of laboratory assay sheets were commonly inserted in the reports.
About Cross River Ventures
Cross River is a gold exploration company focused on the development of top tier exploration properties located in emerging Greenstone Districts of NW Ontario, Canada. The Company controls a 28,000-ha, multiple project portfolio with highly prospective ground in and among prolific, gold bearing greenstone belts. Cross River's common shares trade in Canada under the symbol "CRVC" on the CSE, and in the US under the symbol "CSRVF" on the OTCQB. Please visit www.crossriverventures.com for more information.
On behalf of the Board of Directors of
CROSS RIVER VENTURES CORP.
Alex Klenman
CEO
604-227-6610
aklenman@crossriverventures.com
www.crossriverventures.com
Neither the Canadian Securities Exchange nor its Regulation Services Provider (as that term is defined in the policies of the Canadian Securities Exchange) accepts responsibility for the adequacy or accuracy of this release. This news release may contain forward-looking statements. These statements are based on current expectations and assumptions that are subject to risks and uncertainties. Actual results could differ materially because of factors discussed in the management discussion and analysis section of our interim and most recent annual financial statement or other reports and filings with the Canadian Securities Exchange and applicable Canadian securities regulations. We do not assume any obligation to update any forward-looking statements, except as required by applicable laws.
____________________________________________
ihttps://thediggings.com/mines/usgs10255075
*https://www.geologyontario.mndm.gov.on.ca/mndmfiles/mdi/data/records/MDI52O06SE00005.html
ii McKay D.B, 2004. Report on the 2003 Overburden Stripping, Geologic Mapping and Sampling Program conducted on the McVicar Lake Property: Continuum Resources Ltd and Prospector Consolidated Resources Inc. www.geologyontario.mndm.gov.on.ca/mndmfiles/afri/data/imaging/52O11SW2003/52O11SW2003.pdf
iii McKay D.B, 2004. Report on the 2003 Overburden Stripping, Geologic Mapping and Sampling Program conducted on the McVicar Lake Property: Continuum Resources Ltd and Prospector Consolidated Resources Inc. www.geologyontario.mndm.gov.on.ca/mndmfiles/afri/data/imaging/52O11SW2003/52O11SW2003.pdf
iv Grab samples are selective by nature and may not represent the true grade or style of mineralization across the property. Dr. Rob Carpenter, P.Geo., Ph.D., a Qualified Person as defined under National Instrument 43-101, reviewed, and approved the technical content disclosed in this press release. Historical assay results contained in this press release were not verified by the Company. However, the historical reports referenced were authored by experienced geoscientists and copies of laboratory assay sheets were commonly inserted in the reports.
v Waldie C.J. Report of Diamond Drilling McVicar Lake Area Patricia Mining Division: BHP Minerals Canada Ltd.
vhttps://www.geologyontario.mndm.gov.on.ca/mndmfiles/mdi/data/records/MDI52O06SE00005.html
Brien Lundin: Gold to be Last Asset Standing, Price Outlook for End of Cycle
Speaking to the Investing News Network, Brien Lundin, editor of Gold Newsletter, explained what factors kicked off gold's price run earlier in 2024, and what could drive it even higher as the year continues.
He also shared his thoughts on why gold stocks haven't yet moved as much as investors might have hoped.
"When you would have expected (gold) to maybe drop a couple hundred dollars if the (US Federal Reserve) pivot was being postponed — instead we're about US$300 higher," he said on the sidelines of the Rule Symposium.
"So we're going to hopefully take off with that big new factor from a much higher price level."
Watch the interview for more from Lundin on gold and gold stocks, as well as silver.
You can also click here to view the Investing News Network's Rule Symposium playlist on YouTube. Recorded presentations from the Rule Symposium are available here.
Don't forget to follow us @INN_Resource for real-time updates!
Securities Disclosure: I, Charlotte McLeod, hold no direct investment interest in any company mentioned in this article.
Editorial Disclosure: The Investing News Network does not guarantee the accuracy or thoroughness of the information reported in the interviews it conducts. The opinions expressed in these interviews do not reflect the opinions of the Investing News Network and do not constitute investment advice. All readers are encouraged to perform their own due diligence.
Affiliate Disclosure: The Investing News Network may earn commission from qualifying purchases or actions made through the links or advertisements on this page.
Diamond Drilling Program Expanded and High-Grade M1 Intercept Returned
Warriedar Resources Limited (ASX: WA8) (Warriedar or the Company) is pleased to provide an update on drilling progress and assay results from its Golden Range Project, located in the Murchison region of Western Australia (Figure 1).
HIGHLIGHTS:
- Drilling activities along the ‘Golden Corridor’ progressing well; current Reverse Circulation (RC) program complete (28 holes for 5,024m) and diamond tails program expanded to 2,500m (approx. 1,900m complete across 19 holes).
- Represents the first diamond drilling undertaken at the 2.3km-long Ricciardo deposit, and the nearby M1 deposit, by any operator in ten years.
- Assay results for the first diamond hole at M1 (infill focus) were significantly higher grade than expected:
- 8.9m @ 8.93 g/t Au from 156m, incl. 2m @ 23.83 g/t from 158.3m
- M1 offers clear high-grade extension potential, which is planned to be a focus of further drilling in H2 2024.
- Diamond holes drilled beneath the Silverstone Central pit (Ricciardo), in an area with no historical drilling, returned:
- 7m @ 2.59 g/t Au from 229m, incl. 1m @ 10.81 g/t Au from 233.7m
- 4.6m @ 1.20 g/t Au from 235m
- Extensional RC drilling under the Eastern Creek pit (Ricciardo) returned:
- 7m @ 2.54 g/t Au from 170m, incl. 1m @ 7.48 g/t from 172m
- 9m @ 1.42 g/t Au from 180m
- Ricciardo and M1 both sit in the 25km-long ‘Golden Corridor’ at Golden Range, which hosts six discrete deposits (18 historic pits) that are all open at depth and possess immediate growth potential.
- Diamond drilling set to be completed in mid-August, with all assays expected by mid-September and update of the Ricciardo MRE targeted for Q4 2024.
- Further growth-focussed drilling of the ‘Golden Corridor’ planned for H2 2024.
The results reported in this release are for a further eight (8) of the diamond holes and the first nine (9) of the RC holes drilled in the current program (representing all outstanding results received to date). Results for the first four (4) diamond holes were previously reported (refer WA8 ASX release dated 3 July 2024). The new results continue to demonstrate the outstanding Mineral Resource Estimate (MRE) growth potential that exists at Ricciardo, M1, and along the broader ‘Golden Corridor’ trend.
Figure 1: The Golden Range and Fields Find Projects. Mines and projects within trucking distance of the Warriedar tenure are shown. The location of the Ricciardo deposit within the 25km-long ‘Golden Corridor’ at Golden Range is annotated.
M1 deposit
The M1 deposit is located 7km north of the Ricciardo deposit, and right alongside the existing processing plant (refer Figure 2); within the 25km long Golden Corridor trend.
Initial results have been returned from diamond tails drilled at the M1 deposit, with significant intersections returned in both holes. The holes were planned to test the existing MRE model,
Figure 2: The Golden Corridor within the Golden Range Project. The M1 deposit is located 7km north of the Ricciardo deposit. The image on the LEFT is gravity over shaded residual magnetic RTP.
potential parallel lodes and gaps within the MRE area. This drilling represents the first time this deposit has been revisited and drilled since 2013.
Hole M1RC191 was drilled in the centre of the modelled resource area and returned significantly higher grade than expected (refer Figure 3). This is an excellent result and aids Warriedar in the larger goal of building high-priority MRE areas for rapid development.
Click here for the full ASX Release
This article includes content from Warriedar Resources Limited, licensed for the purpose of publishing on Investing News Australia. This article does not constitute financial product advice. It is your responsibility to perform proper due diligence before acting upon any information provided here. Please refer to our full disclaimer here.
Adrian Day: "Extremely Rare" Gold Stock Opportunity Won't Last
Speaking to the Investing News Network, Adrian Day, president of Adrian Day Asset Management, explained what factors are behind gold's price rise and why gold stocks haven't performed as well as might be expected.
He also shared his thoughts on when gold equities will finally move higher.
"I think when companies start to report their second quarter earnings later this month, we're going to start to see some very attractive cashflow numbers — better than the first quarter, and better than the year-ago comparisons," Day said.
"I've got to think that investors, when they see two back-to-back quarters of strong cashflow numbers, are going to start to look at these companies," he added from the sidelines of the recent Rule Symposium.
Watch the interview above for more of Day's thoughts on what's next for gold and gold stocks.
You can also click here to view the Investing News Network's Rule Symposium playlist on YouTube. Recorded presentations from the Rule Symposium are available here.
Don't forget to follow us @INN_Resource for real-time updates!
Securities Disclosure: I, Charlotte McLeod, hold no direct investment interest in any company mentioned in this article.
Editorial Disclosure: The Investing News Network does not guarantee the accuracy or thoroughness of the information reported in the interviews it conducts. The opinions expressed in these interviews do not reflect the opinions of the Investing News Network and do not constitute investment advice. All readers are encouraged to perform their own due diligence.
Affiliate Disclosure: The Investing News Network may earn commission from qualifying purchases or actions made through the links or advertisements on this page.
What Was the Highest Price for Gold? (Updated 2024)
Gold has long been considered a store of wealth, and the gold price often makes its biggest gains during turbulent times as investors look for cover in this safe-haven asset.
The 21st century has so far been heavily marked by episodes of economic and sociopolitical upheaval. Uncertainty has pushed the precious metal to record highs as market participants seek its perceived security. And each time the gold price rises, there are calls for even higher record-breaking levels.
Gold market gurus from Lynette Zang to Chris Blasi to Jordan Roy-Byrne have shared eye-popping predictions on the gold price that would intrigue any investor — gold bug or not.
While some have posited that the gold price may break US$3,000 per ounce and carry on as high as US$4,000 or US$5,000, there are those with hopes that US$10,000 gold or even US$40,000 gold could become a reality.
These impressive price predictions have investors asking, what was the highest gold price ever? The answer to that question is revealed below. And by looking at how the gold price has moved historically, it’s possible to understand what that means for the yellow metal in the future.
How is gold traded?
Before discovering what the highest gold price ever was, it’s worth looking at how the precious metal is traded. Knowing the mechanics behind gold's historical moves can help illuminate why and how its price changes.
Gold bullion is traded in dollars and cents per ounce, with activity taking place worldwide at all hours, resulting in a live price for the metal. Investors trade gold in major commodities markets such as New York, London, Tokyo and Hong Kong. London is seen as the center of physical precious metals trading, including for silver. The COMEX division of the New York Mercantile Exchange is home to most paper trading.
There are many popular ways to invest in gold. The first is through purchasing gold bullion products such as bullion bars, bullion coins and rounds. Physical gold is sold on the spot market, meaning that buyers pay a specific price per ounce for the metal and then have it delivered. In some parts of the world, such as India, buying gold in the form of jewelry is the largest and most traditional route to investing in gold.
Another path to gold investment is paper trading, which is done through the gold futures market. Participants enter into gold futures contracts for the delivery of gold in the future at an agreed-upon price. In such contracts, two positions can be taken: a long position under which delivery of the metal is accepted or a short position to provide delivery of the metal. Paper trading as a means to invest in gold can provide investors with the flexibility to liquidate assets that aren’t available to those who possess physical gold bullion.
One significant long-term advantage of trading in the paper market is that investors can benefit from gold’s safe-haven status without needing to store it. Furthermore, gold futures trading can offer more financial leverage in that it requires less capital than trading in the physical market.
Interestingly, investors can also purchase physical gold via the futures market, but the process is complicated and lengthy and comes with a large investment and additional costs.
Aside from those options, market participants can invest in gold through exchange-traded funds (ETFs). Investing in a gold ETF is similar to trading a gold stock on an exchange, and there are numerous gold ETF options to choose from. For instance, some ETFs focus solely on physical gold bullion, while others focus on gold futures contracts. Other gold ETFs center on gold-mining stocks or follow the gold spot price.
It is important to understand that you will not own any physical gold when investing in an ETF — in general, even a gold ETF that tracks physical gold cannot be redeemed for tangible metal.
With regards to the performance of gold versus trading stocks, gold has an interesting relationship with the stock market. The two often move in sync during “risk-on periods” when investors are bullish. On the flip side, they tend to become inversely correlated in times of volatility.
According to the World Gold Council, gold's ability to decouple from the stock market during periods of stress makes it “unique amongst most hedges in the marketplace.” It is often during these times that gold outperforms the stock market. For that reason, it is often used as a portfolio diversifier to hedge against uncertainty.
What was the highest gold price ever?
Gold hit US$2,483.35, its all time highest price at the time of this writing, on July 17, 2024. Gold broke through the important psychological level of US$2,000 per ounce in late 2023 on rising expectations that the US Federal Reserve would begin to reverse course on interest rates, and climbed throughout Q2 to over US$2,450 in May.
While interest rate cuts have yet to materialize as of mid-July, gold climbed to its new all-time high in the wake of July 15 comments by Fed Chair Jerome Powell in which he indicated the central bank would be willing to cut interest rates before inflation reaches its 2 percent target.
Fears of a looming recession — or the strong belief that a recession is already here — are also highly supportive for gold heading as we head deeper into 2024.
Gold price chart, July 17, 2014, to July 18, 2024.
Chart via Quotemedia.
Despite these recent runs, gold has seen its share of both peaks and troughs over the last decade. After remaining rangebound between US$1,100 and US$1,300 from 2014 to early 2019, gold pushed above US$1,500 in the second half of 2019 on a softer US dollar, rising geopolitical issues and a slowdown in economic growth.
Gold’s first breach of the significant US$2,000 price level in mid-2020 was due in large part to economic uncertainty caused by the COVID-19 pandemic. To break through that barrier and reach what was then a record high, the yellow metal added more than US$500, or 32 percent, to its value in the first eight months of 2020.
The gold price neared that level again in early 2022 as Russia's invasion of Ukraine collided with rising inflation around the world, increasing the allure of safe-haven assets. In 2023, continued inflation and subsequent rate hikes from the Fed threatened the possibility of a recession, once again pushing gold above US$2,000 and even putting it in sight of its then all-time high.
The evolving banking crisis in the spring of 2023 and the outbreak of the Israel-Hamas war in October also placed upward pressure on gold, allowing it to test its previous all-time high.
What's next for the gold price?
What's next for the gold price is never an easy call to make. There are many factors that affect the gold price, but some of the most prevalent long-term drivers include economic expansion, market risk, opportunity cost and momentum.
Economic expansion is one of the primary gold price contributors as it facilitates demand growth in several categories, including jewelry, technology and investment. As the World Gold Council explains, “This is particularly true in developing economies where gold is often used as a luxury item and a means to preserve wealth.” Market risk is also a prime catalyst for gold values as investors view the precious metal as the “ultimate safe haven,” and a hedge against currency depreciation, inflation and other systemic risks.
Going forward, in addition to the Fed, inflation and geopolitical events, experts will be looking for cues from factors like supply and demand. In terms of supply, the world’s five top gold producers are China, Australia, Russia, Canada and the US. The consensus in the gold market is that major miners have not spent enough on gold exploration in recent years. Gold mine production has fallen from around 3,200 to 3,300 metric tons each year between 2018 and 2020 to around 3,000 to 3,100 metric tons each year between 2021 and 2023.
On the demand side, China and India are the biggest buyers of physical gold, and are in a perpetual fight for the title of world’s largest gold consumer. That said, it's worth noting that the last few years have brought a big rebound in central bank gold buying, which dropped to a record low in 2020, but reached a 55 year high of 1,136 metric tons in 2022.
The World Gold Council has reported that central bank gold purchases in 2023 came to 1,037 metric tons, marking the second year in a row above 1,000.
"We think that gold has entered into a new phase of this bull market," Adam Rozencwajg, managing partner at Goehring & Rozencwajg, told the Investing News Network (INN) in a June 2023 interview. "It probably started in the third and fourth quarter of last year, and it really revolves around central banks' behavior as much as anything else. I think it's going to propel gold much much higher in this leg of the bull market."
Joe Cavatoni, North American market strategist at the WGC, told INN in an email at the end of Q1, “As central banks continue to be significant buyers and geopolitical risks and global uncertainties drive investors towards the perceived safety of gold, the current environment underscores gold’s importance as a strategic asset for portfolio diversification and risk mitigation. Therefore, while there may have been a perception of western disinterest in gold, recent developments indicate a sustained and broad-based demand for the precious metal.”
At the beginning of Q3, INN spoke with Brien Lundin, editor of Gold Newsletter, at the Rule Symposium in Boca Raton, Florida.
"I think clearing US$2,400 for good — trading a few weeks above that level would be key," Lundin said. "Eventually I think we're going to go much higher. The timing of that is always the hard part. Getting back to where I think we're going to be at the end of this cycle, I think the gold price is going to be somewhere between US$6,000 and US$8,000."
Should you beware of gold price manipulation?
As a final note on the price of gold and buying gold bullion, it’s important for investors to be aware that gold price manipulation is a hot topic in the industry.
In 2011, when gold hit what was then a record high, it dropped swiftly in just a few short years. This decline after three years of impressive gains led many in the gold sector to cry foul and point to manipulation. Early in 2015, 10 banks were hit in a US probe on precious metals manipulation. Evidence provided by Deutsche Bank (NYSE:DB) showed “smoking gun” proof that UBS Group (NYSE:UBS), HSBC Holdings (NYSE:HSBC), the Bank of Nova Scotia (NYSE:BNS) and other firms were involved in rigging gold and silver rates in the market from 2007 to 2013.
Not long after, the long-running London gold fix was replaced by the LBMA gold price in a bid to increase gold price transparency. The twice-a-day process, operated by the ICE Benchmark Administration, still involves a variety of banks collaborating to set the gold price, but the system is now electronic.
Still, manipulation has by no means been eradicated, as a 2020 fine on JPMorgan (NYSE:JPM) shows. The next year, chat logs were released in a spoofing trial for two former precious metals traders from the Bank of America’s (NYSE:BAC) Merrill Lynch unit. They show a trader bragging about how easy it is to manipulate the gold price.
Gold market participants have consistently spoken out about manipulation. In mid-2020, Chris Marcus, founder of Arcadia Economics and author of the book “The Big Silver Short,” said that when gold fell back below the US$2,000 mark after hitting close to US$2,070, he saw similarities to what happened with the gold price in 2011.
Marcus has been following the gold and silver markets with a focus specifically on price manipulation for nearly a decade. His advice? “Trust your gut. I believe we’re witnessing the ultimate ’emperor’s really naked’ moment. This isn’t complex financial analysis. Sometimes I think of it as the greatest hypnotic thought experiment in history.”
Investor takeaway
While we have the answer to what the highest gold price ever is as of now, it remains to be seen how high gold can climb, and if the precious metal can reach as high as US$5,000, US$10,000 or even US$40,000.
Even so, many market participants believe gold is a must have in any investment profile, and there is little doubt investors will continue to see gold price action making headlines this year and beyond.
This is an updated version of an article first published by the Investing News Network in 2020.
Don’t forget to follow us @INN_Resource for real-time updates!
Securities Disclosure: I, Melissa Pistilli, hold no direct investment interest in any company mentioned in this article.
Editorial Disclosure: The Investing News Network does not guarantee the accuracy or thoroughness of the information reported in the interviews it conducts. The opinions expressed in these interviews do not reflect the opinions of the Investing News Network and do not constitute investment advice. All readers are encouraged to perform their own due diligence.
Falcon Closes Third Tranche of Private Placement
FALCON GOLD CORP. (FG: TSX-V), (3FA: GR), (FGLDF: OTCQB); (the "Company") announces that it has closed the third tranche of its previously announced non-brokered private placement (the "Private Placement") through the issuance of 600,000 flow-through shares of the Company (the "FT Shares") at $0.05 per FT Share for gross proceeds of $30,000 (the "Third Tranche"). The gross proceeds from the Third Tranche will be used for the exploration and development of the Company's British Columbia, Ontario, Newfoundland, and Quebec projects to incur Canadian Exploration Expenses (CEE) and will qualify as "flow-through mining expenditures" under the Income Tax Act (Canada).
All securities issued pursuant to the Third Tranche will be subject to a statutory hold period in accordance with applicable Canadian securities laws. The Private Placement is subject to final acceptance of the TSX Venture Exchange.
CONTACT INFORMATION:
"Karim Rayani"
Karim Rayani
Chief Executive Officer, Director
Telephone: (604) 716-1036
Email: info@falcongold.ca
Cautionary Language and Forward-Looking Statements
This news release may contain forward looking statements including but not limited to comments regarding the timing and content of upcoming work programs, geological interpretations, receipt of property titles, etc. Forward looking statements address future events and conditions and therefore, involve inherent risks and uncertainties. Actual results may differ materially from those currently anticipated in such statements.
Neither TSX Venture Exchange nor its Regulation Services Provider (as that term is defined in the policies of the TSX Venture Exchange) accepts responsibility for the adequacy or accuracy of this release.
AU$1.50 Valuation for Siren Gold ‘Achievable,’ says Analyst Report
Description:
Australian analyst firm Martin Place Securities has released an investment review of Siren Gold (ASX:SNG), an ASX-listed gold exploration company with a portfolio of assets in the historic Reefton goldfields in West Coast New Zealand, citing the potential for the company to achieve between AU$1.00 and AU$1.50 share price in two years.
“SNG has continued exploration on its tenement holdings in favourable geological terrains at Reefton and also at the 0.588 Moz Sams Creek porphyry project about 120 km
north of Reefton in 81 percent/19 percent joint venture with OceanaGold (TSX:OGC),” the report said.
The report noted the company’s high-grade, deep gold mine potential with antimony as a co-products at its Reefton goldfield property.
“SNG sees potential for several +million oz gold deposits to be discovered at Reefton along strike and especially down dip at the old mines, and recent work at Lyell and Auld Creek in the north and at Langdons is providing strong evidence for the potential for a large scale aggregated antimony resource,” the report said.
Report highlights:
- SNG has been showing an “active and dynamic” track record since its listing in October 2020.
- SNG has attractive tenements located in the Reefton line of lode within the West Coast Goldfields, with similar geology as the prolific Victorian Goldfields.
- Potential for getting to more than 2 Moz resource, and a two-year target of AU$1.50 is achievable
- Confirmed resources may lead to a quicker pathway to production.
For the full analyst report, click here.
This content is intended only for persons who reside or access the website in jurisdictions with securities and other applicable laws which permit the distribution and consumption of this content and whose local law recognizes the scope and effect of this Disclaimer, its limitation of liability, and the legal effect of its exclusive jurisdiction and governing law provisions [link to Governing Law section of the Disclaimer page].
Any investment information contained on this website, including third party research reports, are provided strictly for informational purposes, are general in nature and not tailored for the specific needs of any person, and are not a solicitation or recommendation to purchase or sell a security or intended to provide investment advice. Readers are cautioned to seek the advice of a registered investment advisor regarding the appropriateness of investing in any securities or investment strategies mentioned on this website.
Latest News
Latest Press Releases
Related News
TOP STOCKS
Investing News Network websites or approved third-party tools use cookies. Please refer to the cookie policy for collected data, privacy and GDPR compliance. By continuing to browse the site, you agree to our use of cookies.