The Conversation (0)

Snowflake (NYSE: SNOW), the AI Data Cloud company, today announced financial results for its first quarter of fiscal 2025, ended April 30, 2024.
This press release features multimedia. View the full release here: https://www.businesswire.com/news/home/20240522387237/en/
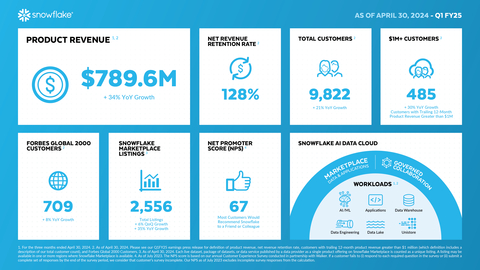
Snowflake Q1 FY25 Infographic (Graphic: Snowflake)
Revenue for the quarter was $828.7 million, representing 33% year-over-year growth. Product revenue for the quarter was $789.6 million, representing 34% year-over-year growth. Net revenue retention rate was 128% as of April 30, 2024. The company now has 485 customers with trailing 12-month product revenue greater than $1 million and 709 Forbes Global 2000 customers, representing 30% and 8% year-over-year growth, respectively. Remaining performance obligations were $5.0 billion, representing 46% year-over-year growth. See the section titled "Key Business Metrics" for definitions of product revenue, net revenue retention rate, customers with trailing 12-month product revenue greater than $1 million, Forbes Global 2000 customers, and remaining performance obligations.
"We finished our first quarter with strong performance across many of our key metrics," said Sridhar Ramaswamy, CEO, Snowflake. "Product revenue was up 34% year-over-year at nearly $790 million, while remaining performance obligations were $5.0 billion, up 46% year-over-year. Our core business is very strong. Our AI products, now generally available, are generating strong customer interest. They will help our customers deliver effective and efficient AI-powered experiences faster than ever."
Snowflake today also announced its intent to acquire certain technology assets and hire key employees from TruEra, an AI observability platform. TruEra provides capabilities to evaluate and monitor large language model (LLM) applications and machine learning models in production.
First Quarter Fiscal 2025 GAAP and Non-GAAP Results:
The following table summarizes our financial results for the first quarter of fiscal 2025:
|
| First Quarter Fiscal 2025 GAAP Results |
| First Quarter Fiscal 2025 Non-GAAP Results (1) | ||
|
| Amount (millions) | Year/Year Growth |
|
|
|
| Product revenue | $789.6 | 34% |
|
|
|
|
|
|
|
|
|
|
|
| Amount (millions) | Margin |
| Amount (millions) | Margin |
| Product gross profit | $569.9 | 72% |
| $607.3 | 77% |
| Operating income (loss) | ($348.6) | (42%) |
| $36.2 | 4% |
| Net cash provided by operating activities | $355.5 | 43 % | (2) |
|
|
| Free cash flow |
|
|
| $331.5 | 40% |
| Adjusted free cash flow |
|
|
| $365.7 | 44% |
| (1) | We report non-GAAP financial measures in addition to, and not as a substitute for, or superior to, financial measures calculated in accordance with GAAP. See the section titled "Statement Regarding Use of Non-GAAP Financial Measures" for an explanation of non-GAAP financial measures, and the table titled "GAAP to Non-GAAP Reconciliations" for a reconciliation of GAAP to non-GAAP financial measures. | |
|
|
| |
| (2) | Calculated as net cash provided by operating activities as a percentage of revenue. | |
|
|
| |
| Note: Fiscal year ends January 31. Numbers are rounded for presentation purposes. | ||
Financial Outlook:
Our guidance includes GAAP and non-GAAP financial measures.
The following table summarizes our guidance for the second quarter of fiscal 2025:
|
| Second Quarter Fiscal 2025 GAAP Guidance |
| Second Quarter Fiscal 2025 Non-GAAP Guidance (1) | ||
|
| Amount (millions) | Year/Year Growth |
|
|
|
| Product revenue | $805 - $810 | 26 - 27% |
|
|
|
|
|
|
|
|
|
|
|
|
|
|
|
| Margin |
| Operating income |
|
|
|
| 3% |
|
|
|
|
|
|
|
|
|
|
|
| Amount (millions) |
|
| Weighted-average shares used in computing net income per share attributable to Snowflake Inc. common stockholders - diluted (2) |
|
|
| 362 |
|
| (1) | We report non-GAAP financial measures in addition to, and not as a substitute for, or superior to, financial measures calculated in accordance with GAAP. See the section titled "Statement Regarding Use of Non-GAAP Financial Measures" for an explanation of non-GAAP financial measures. | |
|
| ||
| (2) | The potential impact of future repurchases under our existing stock repurchase program is not reflected in our guidance for weighted-average shares used in computing net income per share attributable to Snowflake Inc. common stockholders - diluted due to the uncertainty regarding, and the potential variability of, the timing and amount of repurchases. |
The following table summarizes our guidance for the full-year fiscal 2025:
|
| Full-Year Fiscal 2025 GAAP Guidance |
| Full-Year Fiscal 2025 Non-GAAP Guidance (1) | ||
|
| Amount (millions) | Year/Year Growth |
|
|
|
| Product revenue | $3,300 | 24% |
|
|
|
|
|
|
|
|
|
|
|
|
|
|
|
| Margin |
| Product gross profit |
|
|
|
| 75% |
| Operating income |
|
|
|
| 3% |
| Adjusted free cash flow |
|
|
|
| 26% |
|
|
|
|
|
|
|
|
|
|
|
| Amount (millions) |
|
| Weighted-average shares used in computing net income per share attributable to Snowflake Inc. common stockholders - diluted (2) |
|
|
| 363 |
|
| (1) | We report non-GAAP financial measures in addition to, and not as a substitute for, or superior to, financial measures calculated in accordance with GAAP. See the section titled "Statement Regarding Use of Non-GAAP Financial Measures" for an explanation of non-GAAP financial measures. | |
|
| ||
| (2) | The potential impact of future repurchases under our existing stock repurchase program is not reflected in our guidance for weighted-average shares used in computing net income per share attributable to Snowflake Inc. common stockholders - diluted due to the uncertainty regarding, and the potential variability of, the timing and amount of repurchases. |
A reconciliation of non-GAAP guidance measures to corresponding GAAP guidance measures is not available on a forward-looking basis without unreasonable effort due to the uncertainty regarding, and the potential variability of, expenses that may be incurred in the future. Stock-based compensation-related charges, including employer payroll tax-related items on employee stock transactions, are impacted by the timing of employee stock transactions, the future fair market value of our common stock, and our future hiring and retention needs, all of which are difficult to predict and subject to constant change. These factors could be material to our results computed in accordance with GAAP. We have provided a reconciliation of GAAP to non-GAAP financial measures in the financial statement tables for our historical non-GAAP financial results included in this release. Our fiscal year ends January 31, and numbers are rounded for presentation purposes.
Conference Call Details
We will host a conference call today, beginning at 3 p.m. Mountain Time on May 22, 2024. Investors and participants may attend the call by dialing (833) 470-1428 (Access code: 837931), or if outside the United States, by dialing +1 (929) 526-1599 (Access code: 837931).
The call will also be webcast live on the Snowflake Investor Relations website at https://investors.snowflake.com .
An audio replay of the conference call and webcast will be available two hours after its completion and will be accessible for 30 days on the Snowflake Investor Relations website.
Investor Presentation Details
An investor presentation providing additional information and analysis can be found at https://investors.snowflake.com .
Statement Regarding Use of Non‑GAAP Financial Measures
We report the following non-GAAP financial measures, which have not been prepared in accordance with generally accepted accounting principles in the United States (GAAP), in addition to, and not as a substitute for, or superior to, financial measures calculated in accordance with GAAP.
We use these non-GAAP financial measures internally for financial and operational decision-making purposes and as a means to evaluate period-to-period comparisons. Non-GAAP financial measures are not meant to be considered in isolation or as a substitute for comparable GAAP financial measures and should be read only in conjunction with our condensed consolidated financial statements prepared in accordance with GAAP. Our presentation of non-GAAP financial measures may not be comparable to similar measures used by other companies. We encourage investors to carefully consider our results under GAAP, as well as our supplemental non-GAAP information and the reconciliation between these presentations, to more fully understand our business. Please see the tables included at the end of this release for the reconciliation of GAAP to non-GAAP results.
Key Business Metrics
We monitor our key business metrics, including (i) free cash flow and (ii) the other metrics set forth below to help us evaluate our business and growth trends, establish budgets, measure the effectiveness of our sales and marketing efforts, and assess operational efficiencies. See the section titled "Statement Regarding Use of Non-GAAP Financial Measures" for the definition of free cash flow. The calculation of our key business metrics may differ from other similarly titled metrics used by other companies, securities analysts, or investors.
Use of Forward‑Looking Statements
This release and the accompanying oral presentation contain forward-looking statements within the meaning of Section 27A of the Securities Act of 1933, as amended, and Section 21E of the Securities Exchange Act of 1934, as amended, regarding our performance, including but not limited to statements in the section titled "Financial Outlook." Words such as "guidance," "outlook," "expect," "anticipate," "should," "believe," "hope," "target," "project," "plan," "goals," "estimate," "potential," "predict," "may," "will," "might," "could," "intend," "shall," and variations of these terms or the negative of these terms and similar expressions are intended to identify these forward-looking statements. Other than statements of historical fact, all statements contained in this release and accompanying oral presentation are forward-looking statements, including statements regarding (i) our future operating results, targets, or financial position; (ii) our business strategy, plans, or priorities; (iii) our new or enhanced products, services, and technology offerings, including those that are under development or not generally available; (iv) market size and growth, trends, and competitive considerations; (v) our vision, strategy and expected benefits relating to artificial intelligence, Snowpark, Snowflake Marketplace, the AI Data Cloud, and AI Data Clouds for specific industries, including the expected benefits and network effects of the AI Data Cloud; and (vi) the integration, interoperability, and availability of our products, services, and technology offerings with and on third-party products and platforms, including public cloud platforms.
The forward-looking statements contained in this release and the accompanying oral presentation are subject to known and unknown risks, uncertainties, assumptions, and other factors that may cause actual results or outcomes to be materially different from any future results or outcomes expressed or implied by the forward-looking statements. These risks, uncertainties, assumptions, and other factors include, but are not limited to, those related to our business and financial performance; general market and business conditions, downturns, or uncertainty, including higher inflation, higher interest rates, fluctuations or volatility in capital markets or foreign currency exchange rates, and geopolitical instability; our ability to attract and retain customers; the extent to which customers continue to optimize consumption; the impact of new or optimized product features and pricing strategies on consumption, including Iceberg tables and tiered storage pricing; the extent to which customers continue to rationalize budgets and prioritize cash flow management, including through shortened contract durations; our ability to develop new products and services and enhance existing products and services; the growth of successful native applications on the Snowflake Marketplace; our ability to respond rapidly to emerging technology trends, including the use of artificial intelligence; our ability to execute on our business strategy, including our strategy related to artificial intelligence, the AI Data Cloud, Snowpark, and Snowflake Marketplace; our ability to increase and predict customer consumption of our platform, particularly in light of the impact of holidays on customer consumption patterns; our ability to compete effectively; and our ability to manage growth.
Further information on these and additional risks, uncertainties, and other factors that could cause actual outcomes and results to differ materially from those included in or contemplated by the forward-looking statements contained in this release are included under the caption "Risk Factors" and elsewhere in our Form 10-K for the fiscal year ended January 31, 2024 and other filings and reports we make with the Securities and Exchange Commission from time to time, including our Form 10-Q that will be filed for the fiscal quarter ended April 30, 2024.
Moreover, we operate in a very competitive and rapidly changing environment, and new risks may emerge from time to time. It is not possible to predict all risks, nor can we assess the impact of all factors on our business or the extent to which any factor(s) may cause actual results or outcomes to differ materially from those contained in any forward-looking statements we may make. As a result of these risks, uncertainties, assumptions, and other factors, you should not rely on any forward-looking statements as predictions of future events. Forward-looking statements speak only as of the date the statements are made and are based on information available to us at the time those statements are made and/or management's good faith belief as of that time with respect to future events. Except as required by law, we undertake no obligation, and do not intend, to update these forward-looking statements, to review or confirm analysts' expectations, or to provide interim reports or updates on the progress of the current financial quarter.
About Snowflake
Snowflake makes enterprise AI easy, efficient and trusted. Thousands of companies around the globe, including hundreds of the world's largest, use Snowflake's AI Data Cloud to share data, build applications, and power their business with AI. The era of enterprise AI is here. Learn more at snowflake.com (NYSE: SNOW).
Source: Snowflake Inc.
| Snowflake Inc. Condensed Consolidated Statements of Operations (in thousands, except per share data) (unaudited) | |||||||
|
| Three Months Ended April 30, | ||||||
|
| 2024 |
| 2023 | ||||
|
|
|
|
| ||||
| Revenue | $ | 828,709 |
|
| $ | 623,599 |
|
| Cost of revenue |
| 272,517 |
|
|
| 209,414 |
|
| Gross profit |
| 556,192 |
|
|
| 414,185 |
|
| Operating expenses: |
|
|
| ||||
| Sales and marketing |
| 400,822 |
|
|
| 331,558 |
|
| Research and development |
| 410,794 |
|
|
| 277,412 |
|
| General and administrative |
| 93,148 |
|
|
| 78,453 |
|
| Total operating expenses |
| 904,764 |
|
|
| 687,423 |
|
| Operating loss |
| (348,572 | ) |
|
| (273,238 | ) |
| Interest income |
| 54,779 |
|
|
| 43,131 |
|
| Other expense, net |
| (21,302 | ) |
|
| (2,562 | ) |
| Loss before income taxes |
| (315,095 | ) |
|
| (232,669 | ) |
| Provision for (benefit from) income taxes |
| 2,721 |
|
|
| (6,605 | ) |
| Net loss |
| (317,816 | ) |
|
| (226,064 | ) |
| Less: net loss attributable to noncontrolling interest |
| (828 | ) |
|
| (437 | ) |
| Net loss attributable to Snowflake Inc. | $ | (316,988 | ) |
| $ | (225,627 | ) |
| Net loss per share attributable to Snowflake Inc. common stockholders - basic and diluted | $ | (0.95 | ) |
| $ | (0.70 | ) |
| Weighted-average shares used in computing net loss per share attributable to Snowflake Inc. common stockholders - basic and diluted |
| 333,584 |
|
|
| 324,157 |
|
| Snowflake Inc. Condensed Consolidated Balance Sheets (in thousands) (unaudited) | |||||
|
| April 30, 2024 |
| January 31, 2024 | ||
| Assets |
|
|
| ||
| Current assets: |
|
|
| ||
| Cash and cash equivalents | $ | 1,330,411 |
| $ | 1,762,749 |
| Short-term investments |
| 2,200,935 |
|
| 2,083,499 |
| Accounts receivable, net |
| 345,505 |
|
| 926,902 |
| Deferred commissions, current |
| 85,448 |
|
| 86,096 |
| Prepaid expenses and other current assets |
| 180,991 |
|
| 180,018 |
| Total current assets |
| 4,143,290 |
|
| 5,039,264 |
| Long-term investments |
| 927,981 |
|
| 916,307 |
| Property and equipment, net |
| 263,667 |
|
| 247,464 |
| Operating lease right-of-use assets |
| 244,681 |
|
| 252,128 |
| Goodwill |
| 975,906 |
|
| 975,906 |
| Intangible assets, net |
| 307,967 |
|
| 331,411 |
| Deferred commissions, non-current |
| 179,917 |
|
| 187,093 |
| Other assets |
| 254,609 |
|
| 273,810 |
| Total assets | $ | 7,298,018 |
| $ | 8,223,383 |
| Liabilities and Stockholders' Equity |
|
|
| ||
| Current liabilities: |
|
|
| ||
| Accounts payable | $ | 64,239 |
| $ | 51,721 |
| Accrued expenses and other current liabilities |
| 398,002 |
|
| 446,860 |
| Operating lease liabilities, current |
| 30,940 |
|
| 33,944 |
| Deferred revenue, current |
| 1,935,642 |
|
| 2,198,705 |
| Total current liabilities |
| 2,428,823 |
|
| 2,731,230 |
| Operating lease liabilities, non-current |
| 247,501 |
|
| 254,037 |
| Deferred revenue, non-current |
| 14,692 |
|
| 14,402 |
| Other liabilities |
| 39,310 |
|
| 33,120 |
| Snowflake Inc. stockholders' equity |
| 4,558,234 |
|
| 5,180,308 |
| Noncontrolling interest |
| 9,458 |
|
| 10,286 |
| Total liabilities and stockholders' equity | $ | 7,298,018 |
| $ | 8,223,383 |
| Snowflake Inc. Condensed Consolidated Statements of Cash Flows (in thousands) (unaudited) | |||||||
|
| Three Months Ended April 30, | ||||||
|
| 2024 |
| 2023 | ||||
| Cash flows from operating activities: |
|
|
| ||||
| Net loss | $ | (317,816 | ) |
| $ | (226,064 | ) |
| Adjustments to reconcile net loss to net cash provided by operating activities: |
|
|
| ||||
| Depreciation and amortization |
| 40,221 |
|
|
| 23,163 |
|
| Non-cash operating lease costs |
| 13,722 |
|
|
| 12,869 |
|
| Amortization of deferred commissions |
| 22,764 |
|
|
| 17,672 |
|
| Stock-based compensation, net of amounts capitalized |
| 331,936 |
|
|
| 264,509 |
|
| Net accretion of discounts on investments |
| (11,992 | ) |
|
| (15,331 | ) |
| Net realized and unrealized losses on strategic investments in equity securities |
| 20,695 |
|
|
| 2,414 |
|
| Deferred income tax |
| — |
|
|
| (8,868 | ) |
| Other |
| 669 |
|
|
| 9,978 |
|
| Changes in operating assets and liabilities, net of effects of business combinations: |
|
|
| ||||
| Accounts receivable |
| 579,319 |
|
|
| 362,893 |
|
| Deferred commissions |
| (14,940 | ) |
|
| (16,440 | ) |
| Prepaid expenses and other assets |
| (1,111 | ) |
|
| 5,527 |
|
| Accounts payable |
| 21,244 |
|
|
| (3,093 | ) |
| Accrued expenses and other liabilities |
| (54,688 | ) |
|
| (8,542 | ) |
| Operating lease liabilities |
| (13,374 | ) |
|
| (10,763 | ) |
| Deferred revenue |
| (261,181 | ) |
|
| (110,480 | ) |
| Net cash provided by operating activities |
| 355,468 |
|
|
| 299,444 |
|
| Cash flows from investing activities: |
|
|
| ||||
| Purchases of property and equipment |
| (16,519 | ) |
|
| (6,970 | ) |
| Capitalized internal-use software development costs |
| (7,404 | ) |
|
| (9,341 | ) |
| Cash paid for business combinations, net of cash, cash equivalents, and restricted cash acquired |
| — |
|
|
| (123,112 | ) |
| Purchases of investments |
| (1,078,261 | ) |
|
| (1,037,286 | ) |
| Sales of investments |
| 30,360 |
|
|
| 5,652 |
|
| Maturities and redemptions of investments |
| 921,395 |
|
|
| 808,844 |
|
| Settlement of cash flow hedges |
| (749 | ) |
|
| — |
|
| Net cash used in investing activities |
| (151,178 | ) |
|
| (362,213 | ) |
| Cash flows from financing activities: |
|
|
| ||||
| Proceeds from exercise of stock options |
| 10,686 |
|
|
| 15,370 |
|
| Proceeds from issuance of common stock under employee stock purchase plan |
| 46,735 |
|
|
| 37,065 |
|
| Taxes paid related to net share settlement of equity awards |
| (174,590 | ) |
|
| (84,399 | ) |
| Repurchases of common stock |
| (516,329 | ) |
|
| (191,694 | ) |
| Net cash used in financing activities |
| (633,498 | ) |
|
| (223,658 | ) |
| Effect of exchange rate changes on cash, cash equivalents, and restricted cash |
| (2,633 | ) |
|
| 535 |
|
| Net decrease in cash, cash equivalents, and restricted cash |
| (431,841 | ) |
|
| (285,892 | ) |
| Cash, cash equivalents, and restricted cash—beginning of period |
| 1,780,977 |
|
|
| 956,731 |
|
| Cash, cash equivalents, and restricted cash—end of period | $ | 1,349,136 |
|
| $ | 670,839 |
|
| Snowflake Inc. GAAP to Non-GAAP Reconciliations (in thousands, except per share data and percentages) (unaudited) | |||||||||||||
|
| Three Months Ended April 30, | ||||||||||||
|
| 2024 |
| 2023 | ||||||||||
|
| Amount |
| Amount as a % of Revenue |
| Amount |
| Amount as a % of Revenue | ||||||
| Revenue: |
|
|
|
|
|
|
| ||||||
| Product revenue | $ | 789,587 |
|
| 95 | % |
| $ | 590,072 |
|
| 95 | % |
| Professional services and other revenue |
| 39,122 |
|
| 5 | % |
|
| 33,527 |
|
| 5 | % |
| Revenue | $ | 828,709 |
|
| 100 | % |
| $ | 623,599 |
|
| 100 | % |
| Year-over-year growth |
| 33 | % |
|
|
|
| 48 | % |
|
| ||
|
|
|
|
|
|
|
|
| ||||||
| Cost of revenue: |
|
|
|
|
|
|
| ||||||
| GAAP cost of product revenue | $ | 219,657 |
|
|
|
| $ | 159,378 |
|
|
| ||
| Adjustments: |
|
|
|
|
|
|
| ||||||
| Stock-based compensation-related charges |
| (27,235 | ) |
|
|
|
| (18,800 | ) |
|
| ||
| Amortization of acquired intangibles |
| (10,147 | ) |
|
|
|
| (4,581 | ) |
|
| ||
| Non-GAAP cost of product revenue | $ | 182,275 |
|
|
|
| $ | 135,997 |
|
|
| ||
|
|
|
|
|
|
|
|
| ||||||
| GAAP cost of professional services and other revenue | $ | 52,860 |
|
|
|
| $ | 50,036 |
|
|
| ||
| Adjustments: |
|
|
|
|
|
|
| ||||||
| Stock-based compensation-related charges |
| (13,915 | ) |
|
|
|
| (14,920 | ) |
|
| ||
| Amortization of acquired intangibles |
| (1,627 | ) |
|
|
|
| (1,446 | ) |
|
| ||
| Non-GAAP cost of professional services and other revenue | $ | 37,318 |
|
|
|
| $ | 33,670 |
|
|
| ||
|
|
|
|
|
|
|
|
| ||||||
| GAAP cost of revenue | $ | 272,517 |
|
| 33 | % |
| $ | 209,414 |
|
| 34 | % |
| Adjustments: |
|
|
|
|
|
|
| ||||||
| Stock-based compensation-related charges |
| (41,150 | ) |
|
|
|
| (33,720 | ) |
|
| ||
| Amortization of acquired intangibles |
| (11,774 | ) |
|
|
|
| (6,027 | ) |
|
| ||
| Non-GAAP cost of revenue | $ | 219,593 |
|
| 26 | % |
| $ | 169,667 |
|
| 27 | % |
|
|
|
|
|
|
|
|
| ||||||
| Gross profit (loss): |
|
|
|
|
|
|
| ||||||
| GAAP product gross profit | $ | 569,930 |
|
|
|
| $ | 430,694 |
|
|
| ||
| Adjustments: |
|
|
|
|
|
|
| ||||||
| Stock-based compensation-related charges |
| 27,235 |
|
|
|
|
| 18,800 |
|
|
| ||
| Amortization of acquired intangibles |
| 10,147 |
|
|
|
|
| 4,581 |
|
|
| ||
| Non-GAAP product gross profit | $ | 607,312 |
|
|
|
| $ | 454,075 |
|
|
| ||
|
|
|
|
|
|
|
|
| ||||||
| GAAP professional services and other revenue gross loss | $ | (13,738 | ) |
|
|
| $ | (16,509 | ) |
|
| ||
| Adjustments: |
|
|
|
|
|
|
| ||||||
| Stock-based compensation-related charges |
| 13,915 |
|
|
|
|
| 14,920 |
|
|
| ||
| Amortization of acquired intangibles |
| 1,627 |
|
|
|
|
| 1,446 |
|
|
| ||
| Non-GAAP professional services and other revenue gross profit (loss) | $ | 1,804 |
|
|
|
| $ | (143 | ) |
|
| ||
|
|
|
|
|
|
|
|
| ||||||
| GAAP gross profit | $ | 556,192 |
|
| 67 | % |
| $ | 414,185 |
|
| 66 | % |
| Adjustments: |
|
|
|
|
|
|
| ||||||
| Stock-based compensation-related charges |
| 41,150 |
|
|
|
|
| 33,720 |
|
|
| ||
| Amortization of acquired intangibles |
| 11,774 |
|
|
|
|
| 6,027 |
|
|
| ||
| Non-GAAP gross profit | $ | 609,116 |
|
| 74 | % |
| $ | 453,932 |
|
| 73 | % |
|
|
|
|
|
|
|
|
| ||||||
| Gross margin: |
|
|
|
|
|
|
| ||||||
| GAAP product gross margin |
| 72 | % |
|
|
|
| 73 | % |
|
| ||
| Adjustments: |
|
|
|
|
|
|
| ||||||
| Stock-based compensation-related charges as a % of product revenue |
| 4 | % |
|
|
|
| 3 | % |
|
| ||
| Amortization of acquired intangibles as a % of product revenue |
| 1 | % |
|
|
|
| 1 | % |
|
| ||
| Non-GAAP product gross margin |
| 77 | % |
|
|
|
| 77 | % |
|
| ||
|
|
|
|
|
|
|
|
| ||||||
| GAAP professional services and other revenue gross margin |
| (35 | %) |
|
|
|
| (49 | %) |
|
| ||
| Adjustments: |
|
|
|
|
|
|
| ||||||
| Stock-based compensation-related charges as a % of professional services and other revenue |
| 36 | % |
|
|
|
| 45 | % |
|
| ||
| Amortization of acquired intangibles as a % of professional services and other revenue |
| 4 | % |
|
|
|
| 4 | % |
|
| ||
| Non-GAAP professional services and other revenue gross margin |
| 5 | % |
|
|
|
| — | % |
|
| ||
|
|
|
|
|
|
|
|
| ||||||
| GAAP gross margin |
| 67 | % |
|
|
|
| 66 | % |
|
| ||
| Adjustments: |
|
|
|
|
|
|
| ||||||
| Stock-based compensation-related charges as a % of revenue |
| 6 | % |
|
|
|
| 6 | % |
|
| ||
| Amortization of acquired intangibles as a % of revenue |
| 1 | % |
|
|
|
| 1 | % |
|
| ||
| Non-GAAP gross margin |
| 74 | % |
|
|
|
| 73 | % |
|
| ||
|
|
|
|
|
|
|
|
| ||||||
| Operating expenses: |
|
|
|
|
|
|
| ||||||
| GAAP sales and marketing expense | $ | 400,822 |
|
| 48 | % |
| $ | 331,558 |
|
| 53 | % |
| Adjustments: |
|
|
|
|
|
|
| ||||||
| Stock-based compensation-related charges |
| (80,621 | ) |
|
|
|
| (79,625 | ) |
|
| ||
| Amortization of acquired intangibles |
| (7,630 | ) |
|
|
|
| (7,307 | ) |
|
| ||
| Non-GAAP sales and marketing expense | $ | 312,571 |
|
| 38 | % |
| $ | 244,626 |
|
| 39 | % |
|
|
|
|
|
|
|
|
| ||||||
| GAAP research and development expense | $ | 410,794 |
|
| 50 | % |
| $ | 277,412 |
|
| 44 | % |
| Adjustments: |
|
|
|
|
|
|
| ||||||
| Stock-based compensation-related charges |
| (204,041 | ) |
|
|
|
| (146,628 | ) |
|
| ||
| Amortization of acquired intangibles |
| (3,600 | ) |
|
|
|
| (1,824 | ) |
|
| ||
| Non-GAAP research and development expense | $ | 203,153 |
|
| 25 | % |
| $ | 128,960 |
|
| 21 | % |
|
|
|
|
|
|
|
|
| ||||||
| GAAP general and administrative expense | $ | 93,148 |
|
| 11 | % |
| $ | 78,453 |
|
| 13 | % |
| Adjustments: |
|
|
|
|
|
|
| ||||||
| Stock-based compensation-related charges |
| (34,577 | ) |
|
|
|
| (27,648 | ) |
|
| ||
| Amortization of acquired intangibles |
| (441 | ) |
|
|
|
| (436 | ) |
|
| ||
| Expenses associated with acquisitions and strategic investments |
| (982 | ) |
|
|
|
| (2,629 | ) |
|
| ||
| Non-GAAP general and administrative expense | $ | 57,148 |
|
| 7 | % |
| $ | 47,740 |
|
| 8 | % |
|
|
|
|
|
|
|
|
| ||||||
| GAAP total operating expenses | $ | 904,764 |
|
| 109 | % |
| $ | 687,423 |
|
| 110 | % |
| Adjustments: |
|
|
|
|
|
|
| ||||||
| Stock-based compensation-related charges |
| (319,239 | ) |
|
|
|
| (253,901 | ) |
|
| ||
| Amortization of acquired intangibles |
| (11,671 | ) |
|
|
|
| (9,567 | ) |
|
| ||
| Expenses associated with acquisitions and strategic investments |
| (982 | ) |
|
|
|
| (2,629 | ) |
|
| ||
| Non-GAAP total operating expenses | $ | 572,872 |
|
| 70 | % |
| $ | 421,326 |
|
| 68 | % |
|
|
|
|
|
|
|
|
| ||||||
| Operating income (loss): |
|
|
|
|
|
|
| ||||||
| GAAP operating loss | $ | (348,572 | ) |
| (42 | %) |
| $ | (273,238 | ) |
| (44 | %) |
| Adjustments: |
|
|
|
|
|
|
| ||||||
| Stock-based compensation-related charges (1) |
| 360,389 |
|
|
|
|
| 287,621 |
|
|
| ||
| Amortization of acquired intangibles |
| 23,445 |
|
|
|
|
| 15,594 |
|
|
| ||
| Expenses associated with acquisitions and strategic investments |
| 982 |
|
|
|
|
| 2,629 |
|
|
| ||
| Non-GAAP operating income | $ | 36,244 |
|
| 4 | % |
| $ | 32,606 |
|
| 5 | % |
|
|
|
|
|
|
|
|
| ||||||
| Operating margin: |
|
|
|
|
|
|
| ||||||
| GAAP operating margin |
| (42 | %) |
|
|
|
| (44 | %) |
|
| ||
| Adjustments: |
|
|
|
|
|
|
| ||||||
| Stock-based compensation-related charges as a % of revenue |
| 43 | % |
|
|
|
| 46 | % |
|
| ||
| Amortization of acquired intangibles as a % of revenue |
| 3 | % |
|
|
|
| 3 | % |
|
| ||
| Expenses associated with acquisitions and strategic investments as a % of revenue |
| — | % |
|
|
|
| — | % |
|
| ||
| Non-GAAP operating margin |
| 4 | % |
|
|
|
| 5 | % |
|
| ||
|
|
|
|
|
|
|
|
| ||||||
| Net income (loss): |
|
|
|
|
|
|
| ||||||
| GAAP net loss | $ | (317,816 | ) |
| (38 | %) |
| $ | (226,064 | ) |
| (36 | %) |
| Adjustments: |
|
|
|
|
|
|
| ||||||
| Stock-based compensation-related charges (1) |
| 360,389 |
|
|
|
|
| 287,621 |
|
|
| ||
| Amortization of acquired intangibles |
| 23,445 |
|
|
|
|
| 15,594 |
|
|
| ||
| Expenses associated with acquisitions and strategic investments |
| 982 |
|
|
|
|
| 2,629 |
|
|
| ||
| Income tax effect related to the above adjustments and acquisitions |
| (15,555 | ) |
|
|
|
| (25,631 | ) |
|
| ||
| Non-GAAP net income | $ | 51,445 |
|
| 6 | % |
| $ | 54,149 |
|
| 9 | % |
|
|
|
|
|
|
|
|
| ||||||
| Net income (loss) attributable to Snowflake Inc.: |
|
|
|
|
|
|
| ||||||
| GAAP net loss attributable to Snowflake Inc. | $ | (316,988 | ) |
| (38 | %) |
| $ | (225,627 | ) |
| (36 | %) |
| Adjustments: |
|
|
|
|
|
|
| ||||||
| Stock-based compensation-related charges (1) |
| 360,389 |
|
|
|
|
| 287,621 |
|
|
| ||
| Amortization of acquired intangibles |
| 23,445 |
|
|
|
|
| 15,594 |
|
|
| ||
| Expenses associated with acquisitions and strategic investments |
| 982 |
|
|
|
|
| 2,629 |
|
|
| ||
| Income tax effect related to the above adjustments and acquisitions |
| (15,555 | ) |
|
|
|
| (25,631 | ) |
|
| ||
| Adjustments attributable to noncontrolling interest, net of tax |
| (113 | ) |
|
|
|
| (60 | ) |
|
| ||
| Non-GAAP net income attributable to Snowflake Inc. | $ | 52,160 |
|
| 6 | % |
| $ | 54,526 |
|
| 9 | % |
|
|
|
|
|
|
|
|
| ||||||
| Net income (loss) per share attributable to Snowflake Inc. common stockholders - basic and diluted: |
|
|
|
|
|
|
| ||||||
| GAAP net loss per share attributable to Snowflake Inc. common stockholders - basic and diluted | $ | (0.95 | ) |
|
|
| $ | (0.70 | ) |
|
| ||
| Weighted-average shares used in computing GAAP net loss per share attributable to Snowflake Inc. common stockholders - basic and diluted |
| 333,584 |
|
|
|
|
| 324,157 |
|
|
| ||
|
|
|
|
|
|
|
|
| ||||||
| Non-GAAP net income per share attributable to Snowflake Inc. common stockholders - basic | $ | 0.16 |
|
|
|
| $ | 0.17 |
|
|
| ||
| Weighted-average shares used in computing non-GAAP net income per share attributable to Snowflake Inc. common stockholders - basic |
| 333,584 |
|
|
|
|
| 324,157 |
|
|
| ||
|
|
|
|
|
|
|
|
| ||||||
| Non-GAAP net income per share attributable to Snowflake Inc. common stockholders - diluted | $ | 0.14 |
|
|
|
| $ | 0.15 |
|
|
| ||
| Non-GAAP weighted-average shares used in computing non-GAAP net income per share attributable to Snowflake Inc. common stockholders - diluted (2) |
| 363,314 |
|
|
|
|
| 360,309 |
|
|
| ||
|
|
|
|
|
|
|
|
| ||||||
| Free cash flow and adjusted free cash flow: |
|
|
|
|
|
|
| ||||||
| GAAP net cash provided by operating activities | $ | 355,468 |
|
| 43 | % |
| $ | 299,444 |
|
| 48 | % |
| Adjustments: |
|
|
|
|
|
|
| ||||||
| Purchases of property and equipment |
| (16,519 | ) |
|
|
|
| (6,970 | ) |
|
| ||
| Capitalized internal-use software development costs |
| (7,404 | ) |
|
|
|
| (9,341 | ) |
|
| ||
| Non-GAAP free cash flow |
| 331,545 |
|
| 40 | % |
|
| 283,133 |
|
| 45 | % |
| Adjustments: |
|
|
|
|
|
|
| ||||||
| Net cash paid on payroll tax-related items on employee stock transactions (3) |
| 34,146 |
|
|
|
|
| 3,785 |
|
|
| ||
| Non-GAAP adjusted free cash flow | $ | 365,691 |
|
| 44 | % |
| $ | 286,918 |
|
| 46 | % |
| Non-GAAP free cash flow margin |
| 40 | % |
|
|
|
| 45 | % |
|
| ||
| Non-GAAP adjusted free cash flow margin |
| 44 | % |
|
|
|
| 46 | % |
|
| ||
| (1) | Stock-based compensation-related charges included employer payroll tax-related expenses on employee stock transactions of approximately $21.9 million and $15.9 million for the three months ended April 30, 2024 and 2023, respectively. | |
|
|
| |
| (2) | For the periods in which we had non-GAAP net income, the non-GAAP weighted-average shares used in computing non-GAAP net income per share attributable to Snowflake Inc. common stockholders - diluted included the effect of all potentially dilutive common stock equivalents (stock options, restricted stock units, and employee stock purchase rights under our 2020 Employee Stock Purchase Plan). The potential dilutive effect of outstanding restricted stock units with performance conditions not yet satisfied is included in the non-GAAP weighted-average number of diluted shares at forecasted attainment levels to the extent we believe it is probable that the performance conditions will be met. | |
|
|
| |
| (3) | The amounts for the three months ended April 30, 2024 and 2023 do not include employee payroll taxes of $174.6 million and $84.4 million, respectively, related to net share settlement of employee restricted stock units, which were reflected as cash outflows for financing activities. |
View source version on businesswire.com: https://www.businesswire.com/news/home/20240522387237/en/
Investor Contact
Jimmy Sexton
IR@snowflake.com
Press Contact
Eszter Szikora
Press@snowflake.com
News Provided by Business Wire via QuoteMedia