The Conversation (0)

BevCanna named Canadian producer and distributor of the award-winning cannabis-infused beverages
Emerging leader in innovative health and wellness beverages and products, BevCanna Enterprises Inc. ( CSE:BEV , Q:BVNNF , FSE:7BC ) (" BevCanna " or the " Company ") announces today that it has signed a definitive agreement with The Tinley Beverage Company Inc. ( CSE:TNY , OTCQX:TNYBF ) (" Tinley's "), to co-manufacture its award-winning cannabis-infused beverages for the Canadian market.
This press release features multimedia. View the full release here: https://www.businesswire.com/news/home/20210819005627/en/
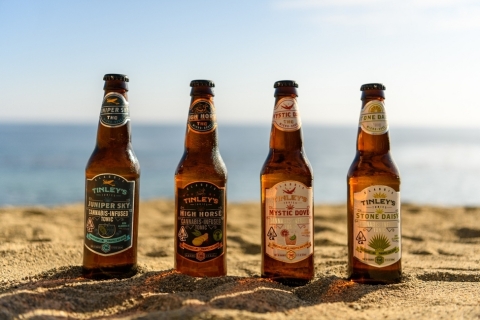
Tinley Beverage Company's award-winning "Tinley's™ Tonics" to be manufactured by BevCanna Enterprises for the Canadian market (US products shown). Each product is inspired by a popular adult beverage and contains a micro-dose of THC and non-cannabis terpenes blended to the profile of Pineapple Jack sativa. (Photo: Business Wire)
BevCanna will produce and distribute the full line of Tinley's ready-to-drink, adult beverage-inspired sparkling Tinleys Classics, Canadian versions of Tinley's Tonics, currently available in California. The line includes the Moscow Mule-inspired Tinley's™ Tonics High Horse ™, winner of First Place at California's prestigious Emerald Cup, the world's largest cannabis competition. BevCanna will also produce Tinley's blue agave & lime-inspired Stone Daisy , the juniper berry & lime-inspired Juniper Sky and the blue agave, grapefruit & lime-inspired Mystic Dove . The beverages will be modified slightly for the Canadian market to reflect Canadian consumer tastes, formulations, packaging, and regulatory requirements. As in California, the award-winning beverages will be offered in 12 fl. oz bottles, each containing a micro-dose of THC to provide a light effect comparable to a single adult beverage. Made with premium botanicals and non-alcoholic flavors often found in national-brand spirits, along with non-cannabis-derived botanical terpenes blended to match the Pineapple Jack strain, the beverages are vegan and gluten-free. They're also crafted with Vertosa cannabis emulsion technology, combined with Tinley's unique terpene infusion methodology, which together are designed to accelerate on-set and provide a full-flower, euphoric effect reminiscent of the Pineapple Jacks sativa strain.
Tinley's is employing BevCanna's white-label partnership model for its Canadian production and distribution. The model allows non-licensed partners to enter the Canadian cannabis market seamlessly and in a compliant manner. Tinley's will leverage BevCanna's extensive experience in producing beverages at scale, as well as its Sales License partnership for distribution to provincial buying groups. Tinley's has committed to annual MOQs (minimum order quantities) as part of this white-label agreement.
Great North Distribution will sell the Tinleys™ products throughout Canada. Great North is Canada's first national sales broker for legalized adult-use cannabis. Established by the owners of Southern Glazer's Wine & Spirits, the world's preeminent distributor for beverage alcohol, Great North Distributors has reach across every province in Canada, with established relationships and expertise in working with provincially owned and operated retailers and private retailers alike.
"We're very excited to be selected as the Canadian manufacturing partner for Tinley's carbonated products," said Melise Panetta, President of BevCanna. "Their award-winning products have an exceptional following with consumers internationally, and we're eager to offer them to the Canadian market."
The agreement with Tinley's is BevCanna's fourth co-manufacturing agreement, with a strong pipeline of upcoming agreements to be announced. BevCanna is now in full commercial production, with imminent delivery to provincial distribution boards, including the Ontario Cannabis store, the largest distributor of cannabis products in Canada.
"We're very pleased to be adding another prominent white-label partner to our growing roster of leading brands," continued Ms. Panetta. "Production with our current white-label partners is underway, and we're confident that we'll be able to bring Tinley's to market quickly, while also satisfying the strong demand we're seeing for additional full-service, white-label beverage manufacturing services."
"BevCanna has state of the art equipment that can uniquely accommodate the requirements of our complex formulation methodology and formats," said Ted Zittell, director of Tinley's. "We're excited to bring our products from California back to our home country and are confident these beverages will provide new, unique and compelling cannabis beverage options for Canadian consumers."
About BevCanna Enterprises Inc.
BevCanna Enterprises Inc. ( CSE:BEV , Q:BVNNF , FSE:7BC ) is a diversified health & wellness beverage and natural products company. BevCanna develops and manufactures a range of alkaline, plant-based, and cannabinoid beverages and supplements for both in-house brands and white-label clients.
With decades of experience creating, manufacturing, and distributing iconic brands that resonate with consumers on a global scale, the team demonstrates an expertise unmatched in the nutraceutical and cannabis-infused beverage categories. Based in British Columbia, Canada, BevCanna owns a pristine alkaline spring water aquifer and a world–class 40,000–square–foot, HACCP certified manufacturing facility, with a bottling capacity of up to 210M bottles annually. BevCanna's extensive distribution network includes more than 3,000 points of retail distribution through its market-leading TRACE brand, its Pure Therapy natural health and wellness e-commerce platform, its fully licensed Canadian cannabis manufacturing and distribution network, and a partnership with #1 U.S. cannabis beverage company Keef Brands .
About The Tinley Beverage Company and Beckett's Tonics
The Tinley Beverage Company Inc. ( CSE:TNY , OTCQX:TNYBF ) manufactures the Beckett's Classics™ and Beckett's 27™ line of non-alcoholic, terpene-infused spirits and cocktails. Beckett's products are available in mainstream food, beverage, and specialty retailers, as well as online, across the United States as well as in grocery and specialty stores in Canada. Cannabis-infused versions of these products are offered under the Tinley's™ brand in licensed dispensaries and home delivery services throughout California, with expansion to Canada underway. Tinley's facility in Long Beach California contains some of the state's most versatile and technologically advanced cannabis-licensed beverage manufacturing equipment and provides manufacturing services for third-party brands in addition to Company-owned brands. Please visit www.drinkbecketts.com , www.drinktinley.com , Twitter and Instagram (@drinktinleys and @drinkbecketts) for recipes, product information and home delivery options.
On behalf of the Board of Directors:
John Campbell, Chief Financial Officer and Chief Strategy Officer
Director, BevCanna Enterprises Inc.
Disclaimer for Forward-Looking Information
This news release contains forward-looking statements. All statements, other than statements of historical fact that address activities, events, or developments that the Company believes, expects, or anticipates will or may occur in the future are forward-looking statements. Forward-looking statements in this news release include statements regarding: the agreement with Tinley's and its terms, anticipated benefits and commercial developments; that BevCanna has a strong pipeline of upcoming agreements to be announced; BevCanna's growing roster of leading brands; that BevCanna is now in full commercial production, with imminent delivery to provincial distribution boards, including the Ontario Cannabis store, the largest distributor of cannabis products in Canada; and other statements regarding the business plans of the Company. The forward-looking statements reflect management's current expectations based on information currently available and are subject to a number of risks and uncertainties that may cause outcomes to differ materially from those discussed in the forward-looking statements.
Although the Company believes that the assumptions inherent in the forward-looking statements are reasonable, forward-looking statements are not guarantees of future performance and, accordingly, undue reliance should not be put on such statements due to their inherent uncertainty. Factors that could cause actual results or events to differ materially from current expectations include, among other things: general market conditions; changes to consumer preferences; and volatility of commodity prices; and other factors beyond the control of the parties. The Company disclaims any intention or obligation to update or revise any forward-looking statements, whether as a result of new information, future events or otherwise, except as required by law, and the Company does not assume any liability for disclosure relating to any other company mentioned herein.
View source version on businesswire.com: https://www.businesswire.com/news/home/20210819005627/en/
For media enquiries or interviews:
Wynn Theriault, Thirty Dash Communications Inc.
416-710-3370
wynn@thirtydash.ca
For investor enquiries:
Bryce Allen, BevCanna Enterprises Inc.
778-766-3744
bryce@bevcanna.com
Ted Zittell
Director, The Tinley Beverage Company Inc.
(310) 507-9146
info@drinktinley.com
News Provided by Business Wire via QuoteMedia