The Conversation (0)
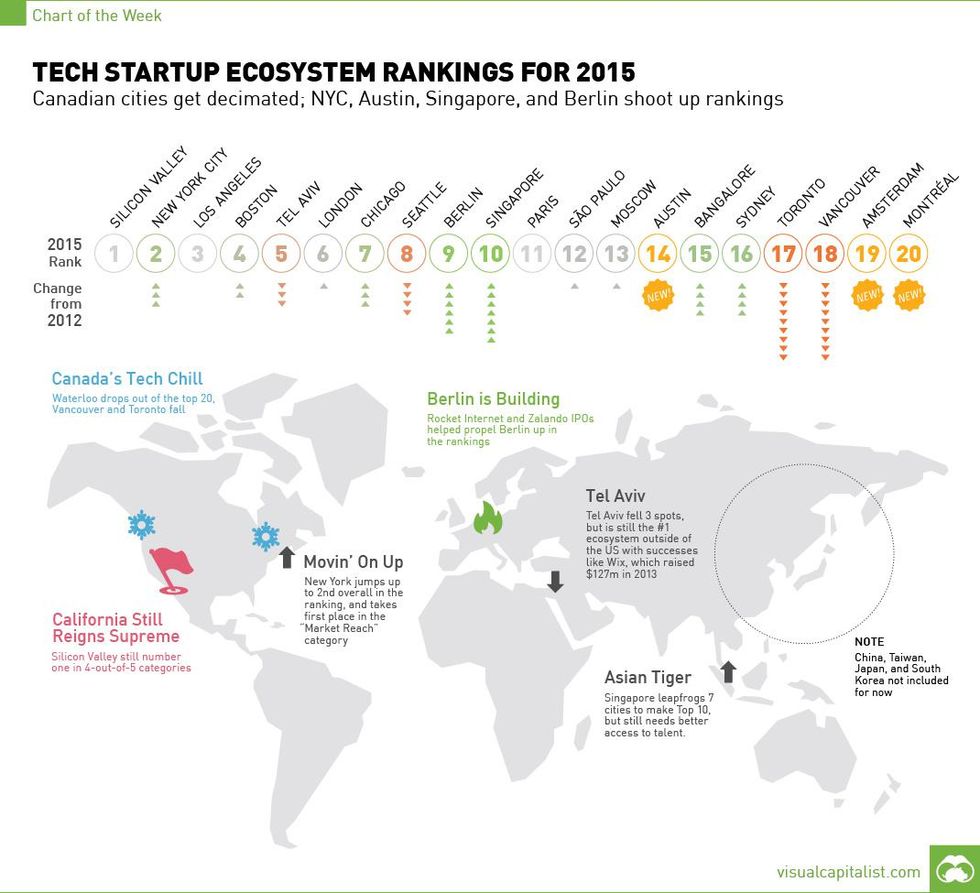
Visual Capitalist released a chart illustrating the top 20 regions for tech startup companies in the world, based on a combination of performance, funding, market reach, talent, and startup experience scores.
Visual Capitalist released a chart illustrating the top 20 regions for tech startup companies in the world, based on a combination of performance, funding, market reach, talent, and startup experience scores.
According to Visual Capitalist:
Performance is based on the funding and exit valuations of startups headquartered in the ecosystem, and Funding represents the amount of investments by venture capitalists and the time it takes to raise capital. Talent is based on the quality of technical talent, availability, and cost. Market Reach is the local system’s GDP and ease of reaching customers internationally and Startup Experience is a qualitative measure based on surveying veteran startup mentors and local founders on the success of startups in that particular region.
The report had several significant findings since its last iteration in late 2012. Particular stories that stand out: Canadian cities are dropping drastically, cities outside of North America such as Berlin and Singapore are climbing the rankings, and the United States remains strong with four of the top five ecosystems.
Click here to view the chart on Visual Capitalist.