The Conversation (0)
Terry Yaremchuk reviews the selloff in precious metals, the dynamics between some of the moving parts and what the outlook may be going forward.
Expectations of higher rates is a primary driver of strength in the US dollar. As the de facto safe haven, fear can drive participants temporarily into the dollar, muddying the fundamental picture. Whatever the cause, the US dollar has strengthened over the last month and is becoming overbought as measured by RSI (relative strength index) with the resistance level previously discussed, keeping price in check.
Markets, however have a tendency to stay overbought until over exuberance subsides and if overhead resistance can’t hold, the 100 level will be firmly in the crosshairs. Otherwise, the range will continue to bound by the goal posts at 92.50 and 97.50. This was the outlook last month and remains the status quo.
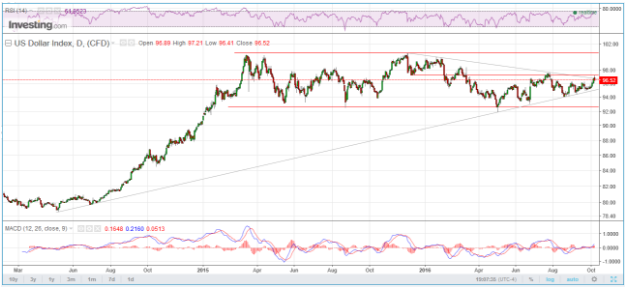 Source: Investing.com Oct 8, 2016
The strength in the US dollar has been labeled as the main culprit in the selloff in precious metals and while it may have been a catalyst, the relative move in the dollar does not justify the magnitude of the carnage in gold and silver. Prices never move up or down in a straight line. With sentiment cycling between fear and greed–and selling tends to beget selling when technical support levels start to give way–which was the case this week.
On the weekly gold chart below, you can see how gold broke out at the beginning of 2016 after 4 years of grinding lower. This generated a lot of excitement in the gold community and many have been calling for a resumption of the gold bull. The dashed orange lines indicate positive divergence between a series of higher highs on MACD (moving average convergence divergence) coincident with lower lows on price. This is a powerful and reliable indicator and would suggest there is substance behind the enthusiasm. Nothing goes up or down in a straight line, however, and short of testing, the multi year downtrend line momentum has faltered. Once the minor uptrend was violated, technical sellers gained control and confusion now reigns. $1,200 looks to be the line in the sand that needs to be tested. If that level holds, price should remain range-bound between $1,200 and the downtrend line. Below that level, $1,050 becomes a critical support and above $1,400 the bulls will be in complete control.
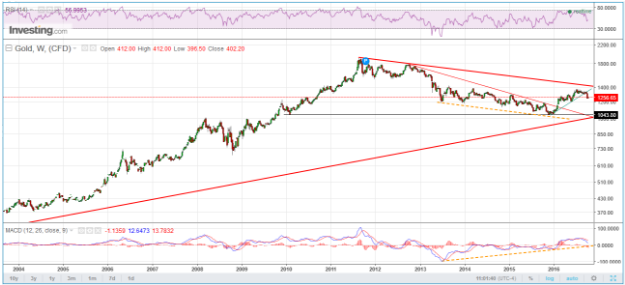 Source: Investing.com Oct 8, 2016
Silver tells a similar story, albeit with magnified volatility and is in no man’s land, oscillating just below $18. Silver can easily trade in a range between $16 and $20 and will be taking its cue from gold beyond that. Above $21 will put $26 in the crosshairs, and below $16 a test of the low watermark near $13.50 seems a virtual certainty.
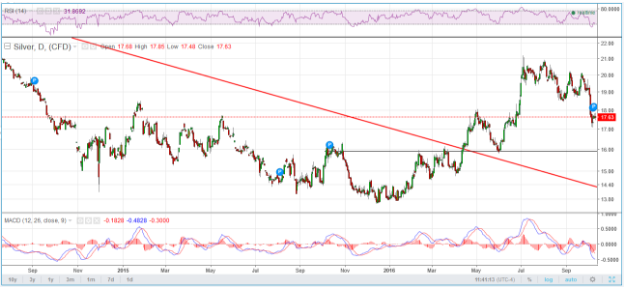 Source: Investing.com Oct 8, 2016
Don’t forget to follow us @INN_Resource for real time updates!
Terry Yaremchuk is an Investment Advisor and Futures Trading representative with the Chippingham Financial Group. Terry offers wealth management and commodities trading services. Specific questions regarding a document can be directed to Terry Yaremchuk. Terry can be reached at tyaremchuk@chippingham.com.
This article is not a recommendation or financial advice and is meant for information purposes only. There is inherit risk with all investing and individuals should speak with their financial advisor to determine if any investment is within their own investment objectives and risk tolerance.
All of the information provided is believed to be accurate and reliable; however, the author and Chippingham assumes no responsibility for any error or responsibility for the use of the information provided. The inclusion of links from this site does not imply endorsement