The Conversation (0)
Visual Capitalist published an infographic that outlines gold’s biggest winning and losing streaks. The infographic includes all runs of over 10 percent, both positive and negative, from 1971 to the present.
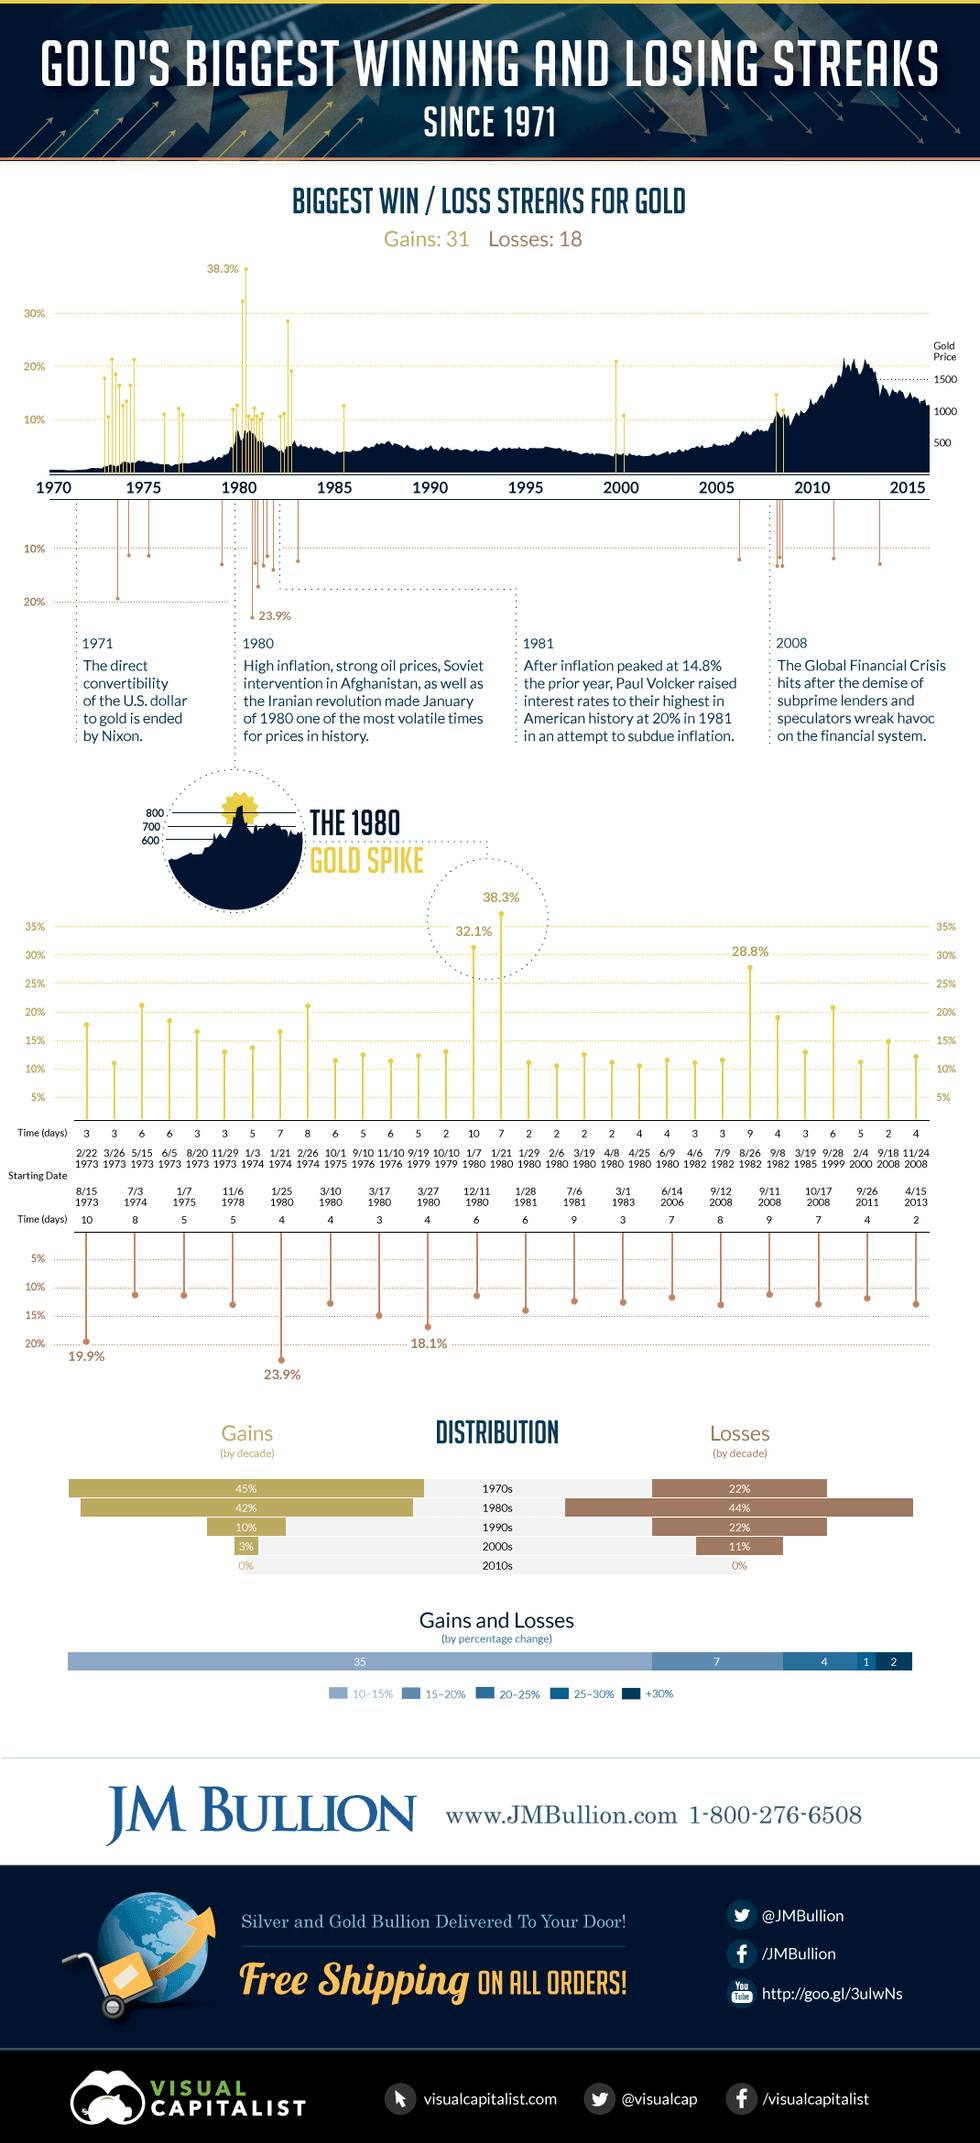
Visual Capitalist published an infographic that outlines gold’s biggest winning and losing streaks. The infographic includes all runs of over 10 percent, both positive and negative, from 1971 to the present. During that time there have been 31 positive runs and 18 losing streaks.
View the infographic below, or click here to see it on Visual Capitalist’s website: