The Conversation (0)
The “Drill Tracker” highlights early stage drilling and trenching results, giving a metric to evaluate exploration results and compare them against their peer group. In this report, we highlight a dozen exploration companies displaying their projects in the Core Shack at the AME BC Roundup, which will be held in Vancouver between January 26 and 29, 2014.
The “Drill Tracker” highlights early stage drilling and trenching results giving a metric to evaluate exploration results and compare them against their peer group. In this report we highlight a dozen exploration companies displaying their projects in the Core Shack at the AME BC Roundup held in Vancouver between Jan 26-29, 2014.
- The Core Shack Dozen highlights twelve of the many early stage exploration projects exhibiting at this year’s AME BC Roundup in Vancouver. We make no recommendation to buy sell or hold but rather to take this opportunity to walk through the core shack and meet the exploration teams and learn about their discoveries.
- First “hands on” look at new discoveries. Each year in January, the AME BC [Association for Mineral Exploration British Columbia) Roundup gives geologists and investors the opportunity to meet the exploration teams that have been successful in advancing their mineral projects. This year a record 60 companies will be displaying core from their projects. This report is a summary of the drilling results from 12 of the companies focusing on new discoveries.
- Mineral exploration and discovery need three things: 1) people with good geological talent that are persistent; 2) the ability to access risk capital, and; 3) a good bit of timing and luck. Canada has an excellent talent pool but as we have seen in previous slowdowns; it is the shortage of risk capital that is often the biggest challenge.
- In spite of the huge challenges of finding good projects and making a discovery given the limited risk capital to advance them, companies continue to make new discoveries (contrary to the perception no discoveries are being made). Some discoveries have emerged via conducting grass roots exploration others by revisiting existing projects and using old data and/or new technologies to develop new ideas. Sometimes it is just having a new set of eyes that has walked the rocks before. The value of low cost “boot and pick geology” can never be underestimated.
- Lightening often strikes twice……..As in previous downturns we see companies and management teams that have had recent success able to raise money and continue with exploration. Repeat teams such as Pilot Gold, Balmoral, Cayden and Fission are examples of management teams that have both the technical skills to make new discoveries and the proven ability to return value to shareholders.
- Exploration spending down 50% since 2012. The recent SNL Metals and Mining Report on global exploration shows the unprecedented two year drop in exploration expenses from the 2012 record year of $20.53 billion to an estimate of $10.74 in 2014. Of the total, 40% was conducted by major companies with 41% devoted to gold and 32% to copper.
- The project pipeline is weak. Given the long (+15 year?) lead times between discovery and commercial production for large base metal mines in particular, the need for new high quality projects for the next cycle is at an almost critical stage. With 10% of the global zinc market going off line due to exhausting resources over a three year period and few large high quality projects in the pipeline we may see the zinc boom we have been anticipating for many years. As many of the Asian based majors and mid-tier copper producers have been adding to their pool copper resources, the market of junior held copper assets is becoming very thin for when we see a recovery. For gold, some industry leaders are calling 2015 the year of peak production.
- The need for new (not old) projects. What makes this part of the cycle different is that during the previous long post Bre-X downturn is that many companies capitalized on the pool of old projects parked in major companies or government owned mining companies. Those days are for the most part gone. This makes it much more difficult for companies to pull a project off the shelf, dust it off and raise money to advance it towards a sale. This makes funding exploration all the more critical.
- Report format – Valuation Metrics. The body of this report leading into the individual company pages will outline some of the metrics of evaluating exploration data and identify some of the red flags to watch for in press releases.
INTRODUCTION
In a strong exploration climate where in any given week there can be anywhere up to 30-40 news releases expounding a company’s recent drilling or trenching results it can often be difficult to put the results into context with other results. We use the Drill Tracker to highlight early stage drilling and trenching results giving a metric to evaluate exploration results and compare them against their peer group as well as how the results compare to the previous drilling on the project.
The Drill Tracker plots the drill data by converting the assay values into US dollars and plotting this against the length of the drill hole. Given a critical mass of data the results tend to look very similar to a grade / tonnage plot for mineral deposits with narrow high-grade deposits in the upper left and large bulk tonnage deposits towards the lower right. The Drill Tracker database has over 10,000 drill data points and 700 trenching results dating back to 2006.
In this the third iteration of the Drillers Dozen, we review 12 companies displaying their core at the AME BC Roundup Core Shack between Jan 26 and the 29. With 60 companies displaying their projects over the four days we selected those that had recently either made a new discovery or had discovered a new zone that changed the focus of the project in a significant way.
THE METRICS
To get a full understanding of the value of a drill hole it is often necessary to look at a number of factors beyond the grade and the length of the hole. Significant factors than can influence the value of a drill intercept are;
- An understanding of how a project compares to its peer group
- An understanding of the geology – the basis for all interpretation
- Depth to mineralized zone – shallow open pit target or deep underground?
- Estimated true thickness of the zone – down dip or across mineralized zone
- Influence of high grade results on longer intervals – smeared high grades?
- Metal distribution and expected metallurgy – oxide or sulphide?
Drilling Results
To understand how a project compares to its peer group we use the Drill Tracker chart to display the data. By filtering the data we are able to remove the cloud of 10,000 drill results and focus on the commodity and/or region that constitute the projects peers. Typical examples of filtering include:
- All Gold data
- West African gold data
- All Porphyry data
- BC porphyry data
- Uranium data
- VMS data
- Nickel data
The following graph plots the discovery holes for the six companies in the report with base metal projects that have made a new discovery or have added a significant new zone.
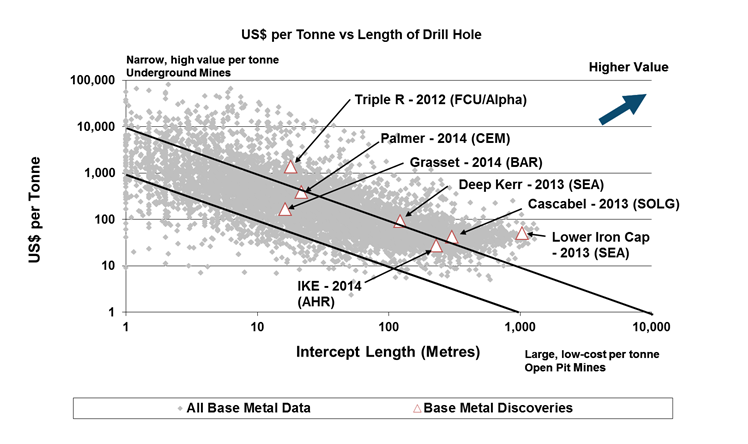 Figure 1. Source: Hewgill Geoscience.
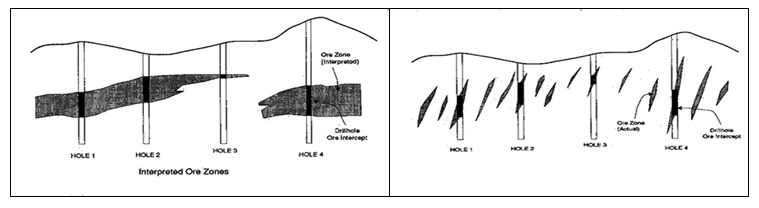
Look at the Maps and Cross Sections
To best understand the drill results, the Company’s web site or previous 43-101 reports are the best source of information to make your own decision. Be aware of companies that do not have adequate graphic back up on their web site. However, there are occasions when times are busy and the Company is so excited about their drill results they get ahead of their graphics and web design people. This should not happen but it does.
Understanding the geology is very important as can be seen in the two different interpretations based on the same two set of drill holes. This is especially important when evaluating historical (or new) reverse circulation (RC) drilling which gives you small chips of rock rather than solid drill core.
True Thickness
The following cross section shows the importance of understanding the nature of the geology when a long interval is reported. In this case, the company drilled a long interval of mineralization but when they very correctly turned the drill around and “scissored” the hole they saw that the zone was much narrower than the first hole indicated. If a company reports they drilled a long interval to test “down-hole continuity” it may mean they deliberately drilled down dip to see how continuous the zone is. In the case of some deposit types such as diatreme breccias, this is a valid exploration method but the press release should be very up front that this is what they did.
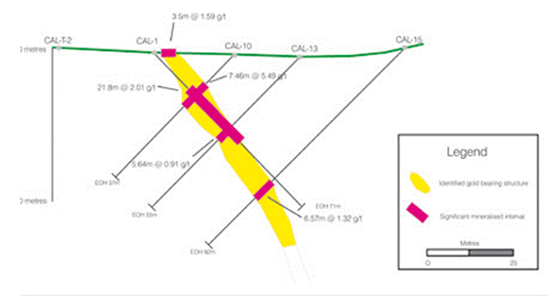 Figure 3. Source: unknown.
Influence of High-Grade on longer interval
When evaluating large low grade gold deposits it is often very important to understand the grade distribution throughout the hole. A single high grade value averaged over a sea of sub economic assays does not magically make the low grade material potentially economic. As companies tried to prove bigger is better in the last few years, many companies “smeared” high-grade results over great distances to give the appearance of a low grade disseminated body often called a “one grammer”.
In the following example a 1.0 g/t Cut-off grade is used to estimate a mineralized interval and the effect that using a “top-cut” will have on the reported interval.
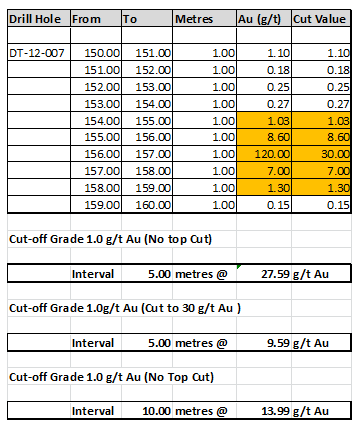 Figure 4. Source: Hewgill Geoscience.
High Grade
Includes high-grade value of 120 g/t Au. Often high-grades are isolated nuggets and cannot be reasonably extrapolated outwards.
High Grade cut to 30 g/t Au
Dilutes the influence of the high-grade nugget. Probably the most realistic approach. In some mines where the nuggets are an important value driver (Red Lake), the top-cut is much higher.
Longer low grade includes outlier
It would be unlikely a miner should go out the extra 4 metres to mine a single 1.0 gram sample. Watch for extreme examples of this were high-grades are “smeared” into “one grammers”
Influence of Metallurgy
Not all orebodies are created equal even though they may have the same value of ore. Each ore body has its own mineralogical characteristics and processing flow sheet that influence both capital and operating costs. Metallurgical properties such mineralogy are an important consideration as the following hypothetical example shows two types of ores with the same total value that may not have the same net recoverable value:
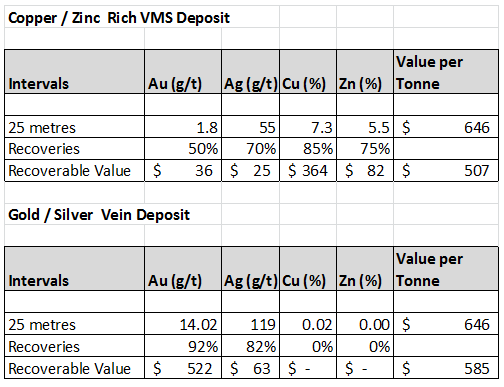 Figure 5. Source: Hewgill Geoscience.
Metallurgical reports are an important part of any exploration program as it may often be the fatal flaw that makes a project uneconomic. While metallurgy is most commonly considered in more advanced projects it can be the best way to avoid spending early exploration dollars on a project that is unlikely to proceed due to unsurmountable metallurgical issues. It is thus important to watch for red flags:
- Combining oxide transitional and sulphide material into one interval without separating in. The metallurgical characteristics are quite different in the two domains. For example, copper oxides with gold values are leached with acid but only the copper is recovered while the deeper sulphide material will require higher cost floatation but the gold and silver can be recovered.
- Potential high acid consumption in copper oxide material that is associated with carbonate or other calcium rich minerals.
- Likewise in gold deposits it is important to understand the depth of weathering as the cyanide leaching characteristics change significantly below the level of oxidation.
- Arsenic or other contaminants in a copper concentrate may make a concentrate unattractive to a smelter even though the concentrate grade is attractive.
Summary
Understanding drill results requires careful observation beyond the headline numbers. The junior mineral exploration industry is perhaps unique when compared to other types of investments due to the sheer number of companies with exploration projects. To make sound investment decisions it is necessary to reduce risks by following management teams with demonstrated ability to not only create value for shareholders but maintain a high level of reporting their data.
By using tools such as the Drill Tracker in conjunction with the information on the Company’s web site the reader is better positioned to reduce the risk in the high risk – high reward exploration business.
Disclosure
I, Wayne Hewgill certify that the information in this report is sourced through public documents that are believed to be reliable but accuracy and completeness as represented in this report cannot be guaranteed. The author has not received payment from any of the companies covered in this report.
At the date of this release the author, Wayne Hewgill, owns shares in the following companies:
- Atac Resources Ltd.(TSX.V.ATC)
- Balmoral Resources Lyd. (TSX.BAR)
- Fission Uranium Corp. (TSX.FCU)
- Pilot Gold Inc. (TSX.PLG)
This report makes not recommendations to buy sell or hold.
Biography
Wayne Hewgill is a geologist with extensive knowledge of the global mining industry gained through 30 years of diversified experience in mineral exploration and new business development in Canada, as well as 10 years living in Africa, New Zealand and Australia. Previously was Senior Research Officer at BHP Billiton, an executive with an exploration company working in Argentina and a mining analyst at three Vancouver based financial groups where he developed the Drill Tracker database in 2006. He holds a B.Sc. in Geology from the University of British Columbia and is registered as a Professional Geoscientist (P.Geo) with APEGBC